A concise 3 year review of TPP

This is a summary of the key highlights from 3 years of daily market comments and weekly reviews on this site.

If you want a more extensive version, please see the featured posts item on the menu bar.

2015
Recognized the low 9/30/2015


2016
Shifted completely defensive 1/7/2016, declaring bear for real

Then starting buying back stocks one day off the major low of 2/11/2016

And oil from 2/12/2016

And EWZ & RSX shortly after (massive years for both from there)

March 2016 turned back to full bullish mode on stocks

Recognized semiconductors in early stage of massive parabolic move

Called the all time bond top & yield low at the decade turn, one shot

Long and strong in August 2016 despite skepticism by big names on the street

Long financials before the election jump

Massively bullish after election

2017
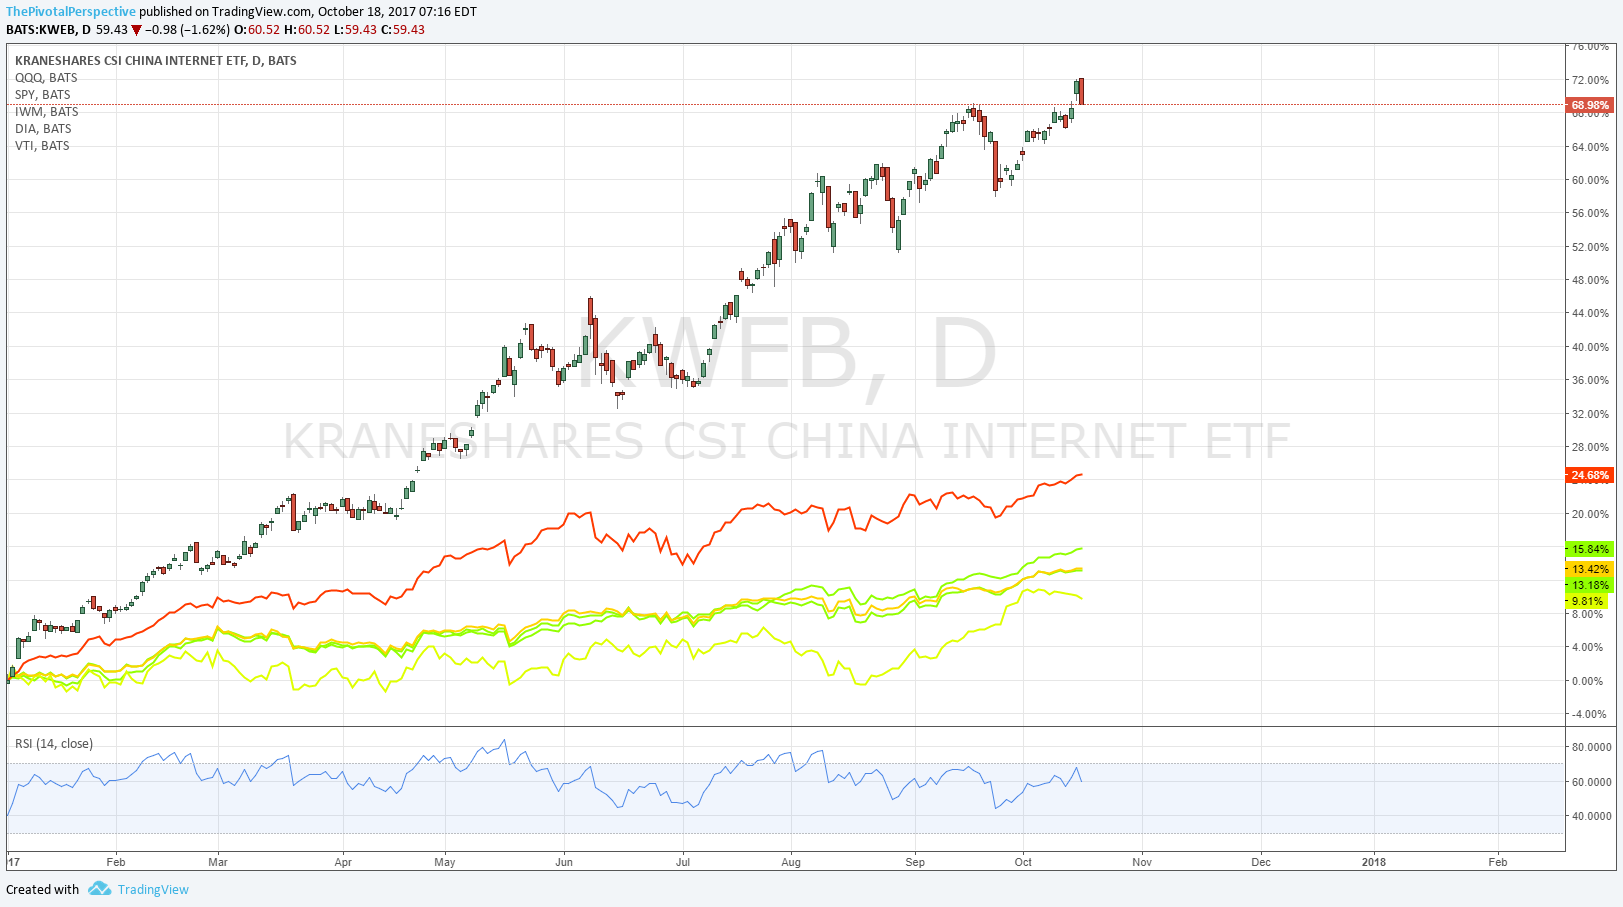
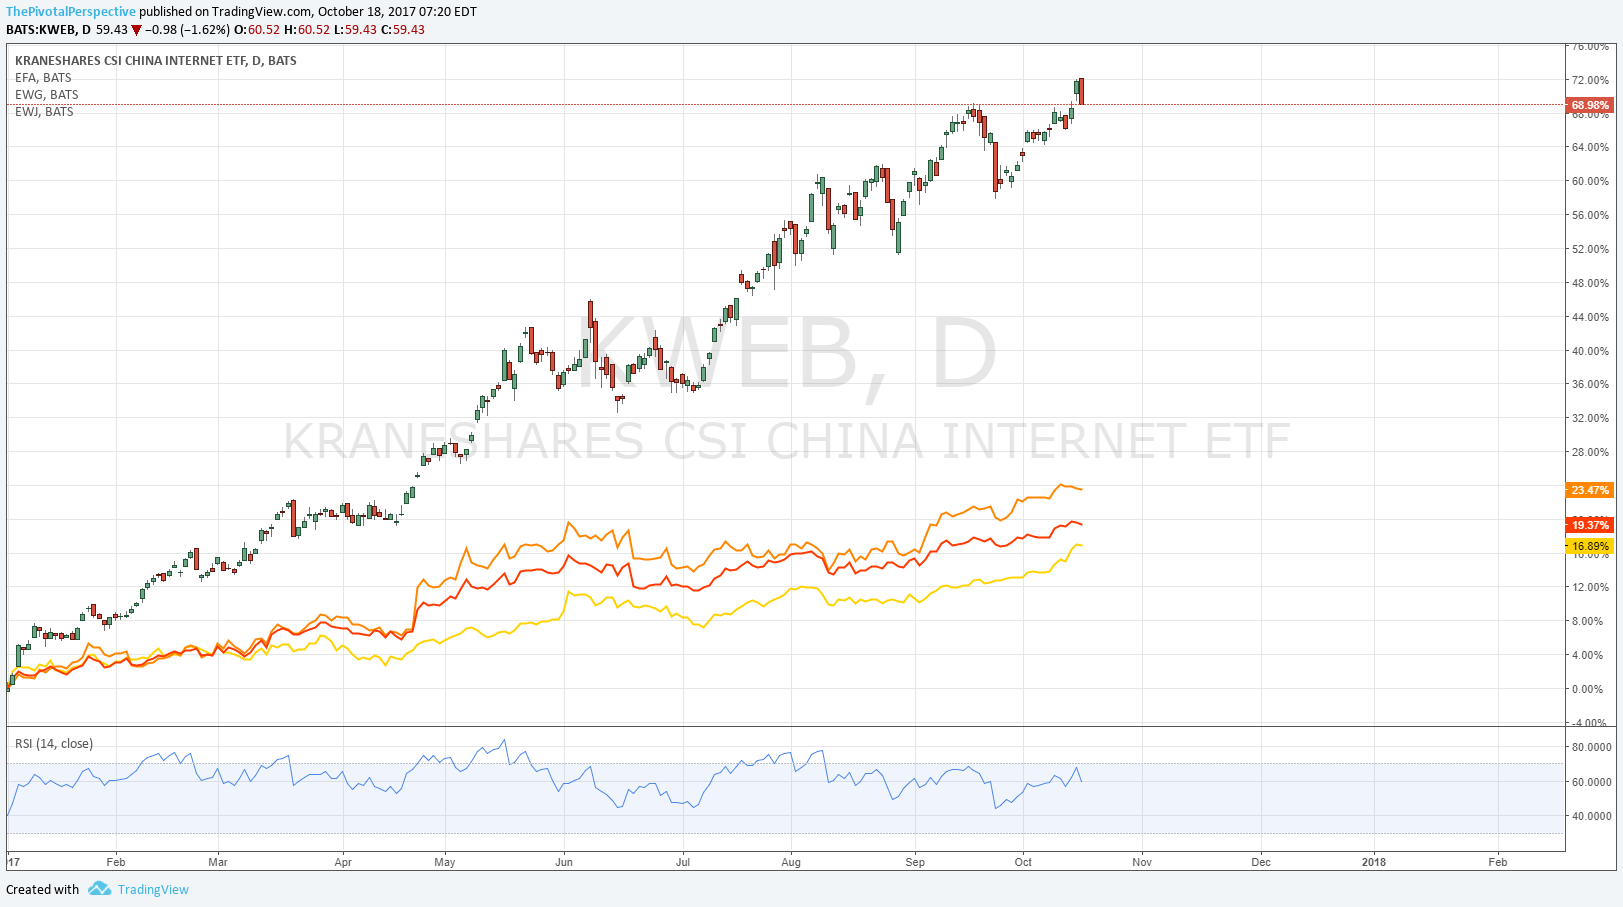
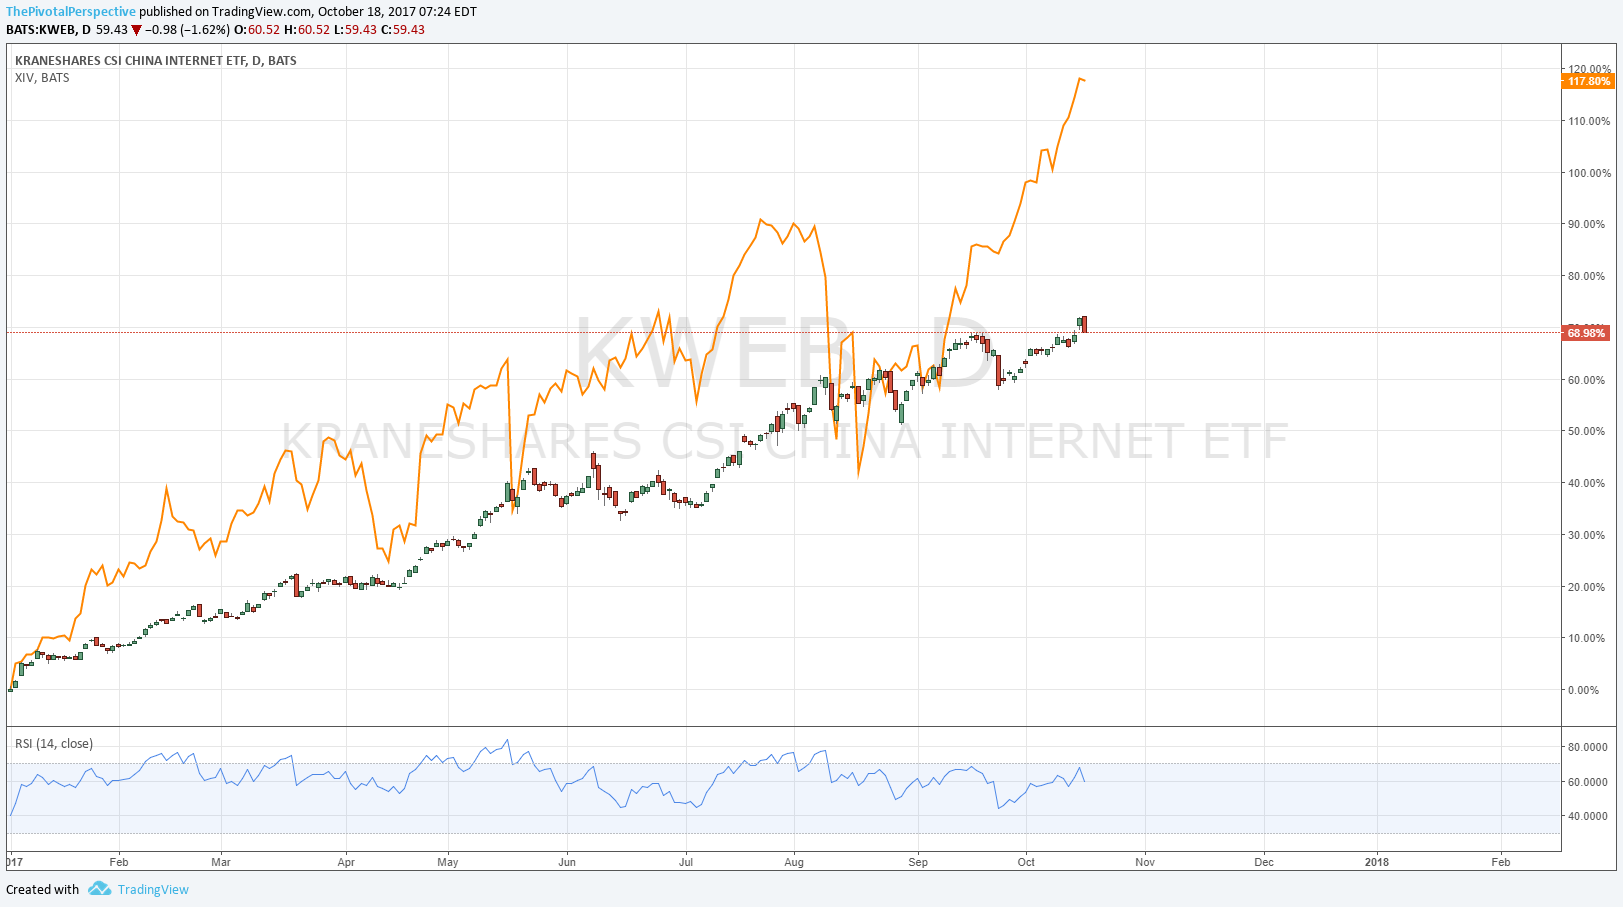
Called for China tech to be leader for 2017 in Dec 2016 (3rd best category of 2017 after cryptos and short volatility)

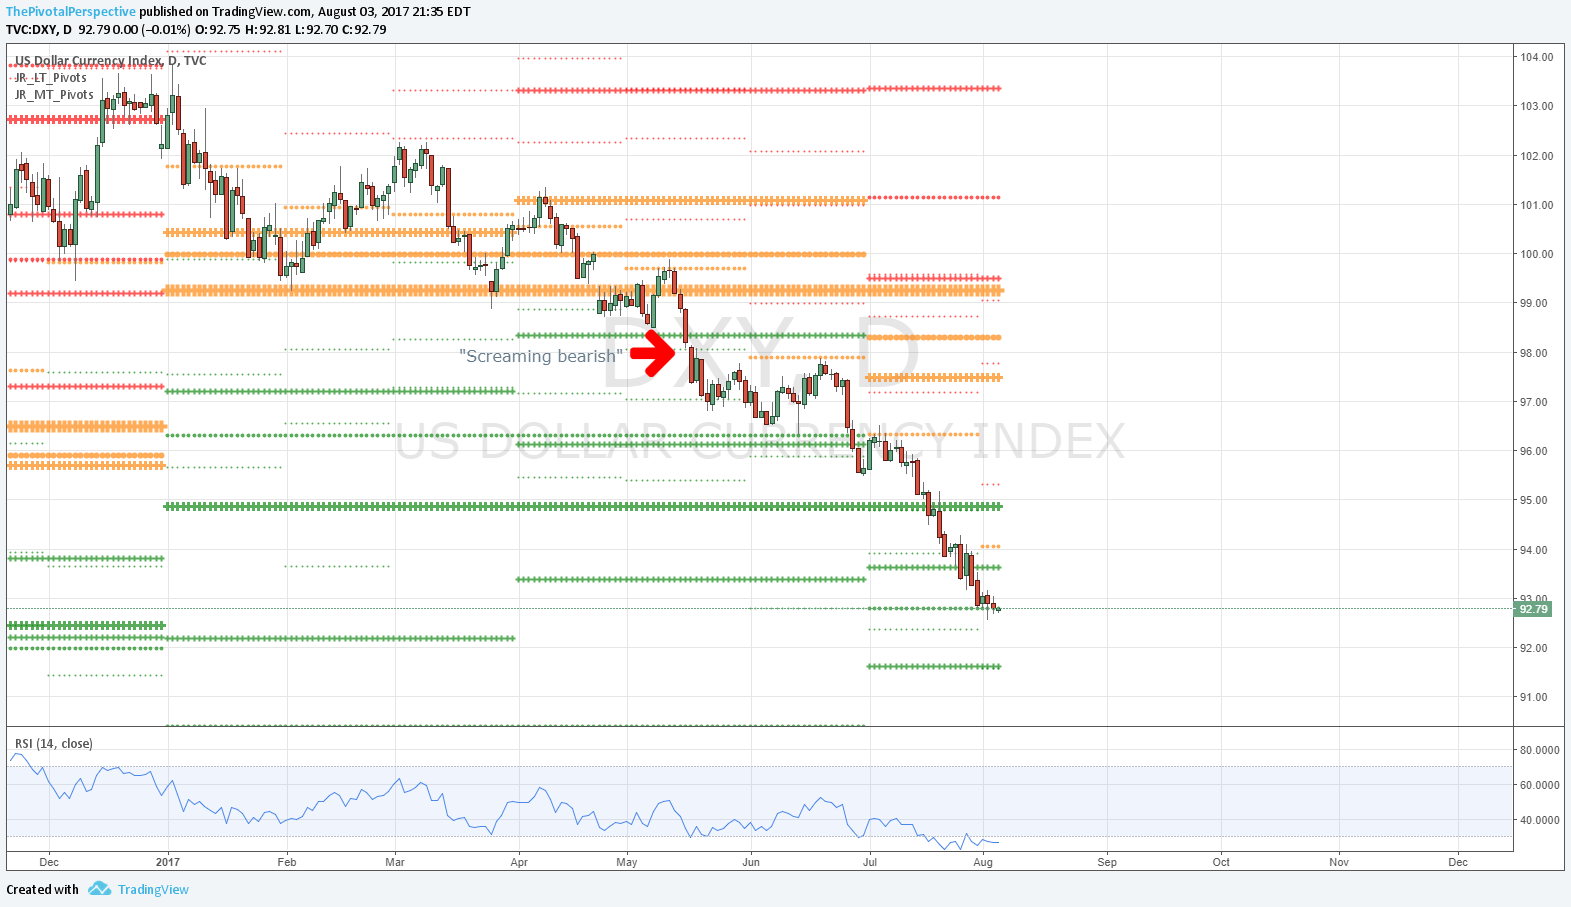
Bought the dip in April after showing mild caution before

Remained bullish after August mini pullback

2018
Year started strong as expected

While noting that the asset class to avoid was bonds from mid January

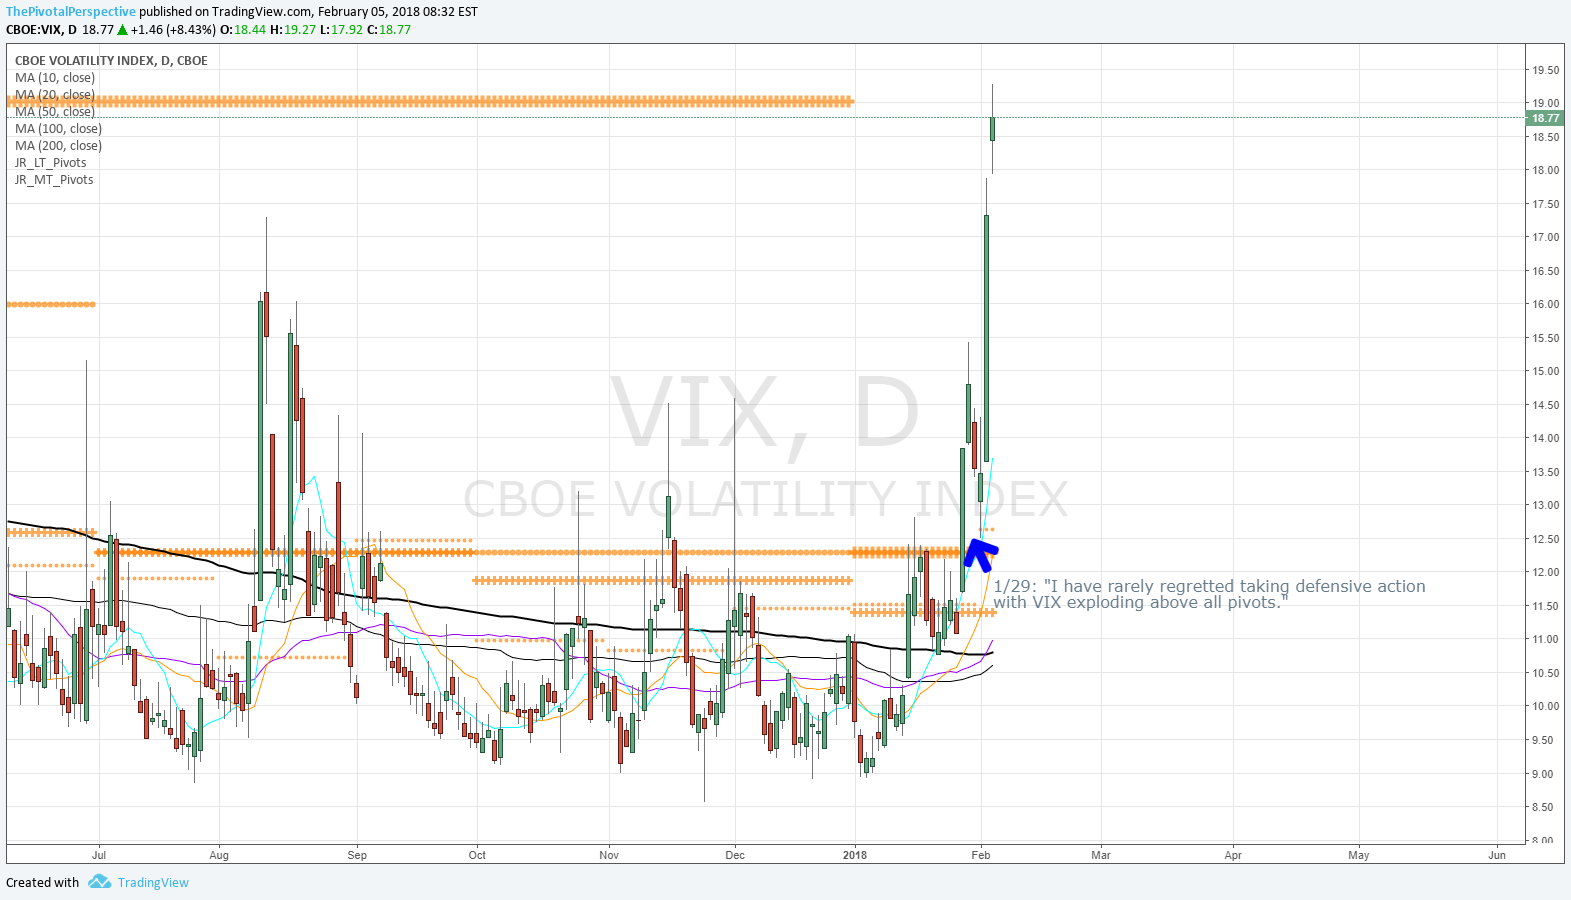
Then nailed the stock top and volatility spike with VIX spiking as called in advance!
Twitter timestamp on volatilty call to spike 1/25-2/15 made on 1/24

Bought the 2/9/2018 low

Expected commodities to outperform in 2018

Noted emerging market weakness from April and beyond (one of many examples)

Bullish from early May

Caught the bond low and main rally of the year

And then nailed the October stock drop in advance with call of larger cycle weakness from 10/10 which played out exactly as called!
Twitter timestamp #1 calling for October down with tech most at risk for drop on 9/20
Twitter timestamp #2 on October 10/10 risk off from late Sept
Twitter timestamp #3 on next move -5% down on day of DJI high
Twitter timestamp #4 on immanent breakdown to happen 10/19-26 made on 10/22

PS: Bitcoin rec 406

As impressive as this list is, there are many many more good calls on the featured posts. I didn’t pick out the medium term trading tops and lows, currency moves, etc.

Throughout these years I have stayed mentally flexible and committed to my process and system. As it turns out I have spotted the many of the major moves in markets each of these years, despite their vary varying nature:

Turned bullish stocks and oil from 2/12/2016, including focus on oil, EWZ & RSX
Recognized semi-conductors in early stage of massive move up
Spotted the bond turn
Long financials before election jump, and bullish from there in general
These were most of the biggest moves in 2016.

Stayed bullish 2017
China tech was the 3rd best trade of 2017, after crypto and short vol (bitcoin rec from 406 kind of takes care of #1). Yes emerging markets were hot but it was China tech that was the leader of this theme.

In 2018, nailed both the Jan-Feb volatility spike (Twitter timestamped!)
and the October drop (Twitter timestamped!)
Among the two biggest moves in the shortest time of the year, while being largely bullish from the beginning of 2018, especially May and then July.

Is there any other analyst that compares?

I would love to pursue my passion full time at a fund or wealth management company. I have made all of these calls on a very part time basis while maintaining a busy day job, combining my system of technicals and timing. How is this possible? Because I performed many years of research for many years on what really moves the market in a way that is truly unique.

If you want to dig into the details and perform due diligence, 3 years of daily comments are on this very site. Recently I have shifted to 100% Twitter for more interaction. Thanks for your interest in my work, and I hope to be able to be in a position to do this full time in a role of more consequence in the near future. Thank you.

Nailed the high

Daily comments made it clear that there was potential for a major turn. I outlined criteria for a partial long exit days in advance on 1/24, and those criteria were met on 1/29. Special timing post on Twitter from 1/24 recommended UVXY as volatility set to spike. 2/1 added to bearish conclusions for next near term move. 

1/23/2018 Daily comment: "There are so many indexes on or near YR1s the situation calls Jan-Feb 2016 to mind, as the only difference was that they were on YS1s. Both years started with a directional bang, reached yearly levels, and then... we shall see. That is our task now, to assess the chances of a turn here." 

1/24/2018 Daily comment (thinking ahead): What to do, especially if VIX is above its Q1P and JanP tomorrow? And then even more so when it lifts above its YP and doesn't look back - something we haven't seen since 8/2015.

  • Take gains on longs that are having clear rejections from resistance levels.
  • Bonds are not working as safe havens this year, so avoid.
  • GLD & GLD are popping on these days especially with $DXY down - watch for these setups or add (site recommended GDX 12/13 then cut mid Jan; GLD from 12/26, still holding personally).
  • UVXY - I've already had one great trade this year and started talking about this yesterday on the site and twitter. I think this will be a favorite setup this year as VIX low is the 2nd trading day of the year and XIV high is not far after on 1/11."

1/24 Tweet from @pivotalmomentum: Special timing post: volatility cycles picking up 1/25-2/2 maybe through 2/15. This does not mean i am saying stocks down from here. There are a lot of YR1s to watch though. Yup back in UVXY already."

1/29/201 Daily commentLong exit recommendation, "Some of the bullish conclusions of Friday were undone today - most especially in VIX. I have rarely regretted taking defensive action with VIX exploding above all pivots. Today met criteria for taking partial profits per Daily comment of last week. (quoted 1/24 notes above) ... All seem like good steps except metals have since looked more toppy. UVXY was up 14% today, and although some of that was a gap there were still large intraday gains."

1/30/2018 Daily comment: "A lot of long term level rejections today, so it was rather pleasant to have taken major defensive action yesterday by significantly reducing longs and adding to UVXY hedge." 

2/1 Tweet: "YR1 rejections brewing on $SPX / $SPY, $NDX / $QQQ, $INDU / $DIA. Weekly charts on continuous futures with yearly levels only on $ES_F, $NQ_F and $YM_F."

2/1/2018 Daily comment: "Stalemate continues with YR1s threatening on 4 of 5 USA main indexes but without serious damage. In particular, YR1s on SPY, QQQ and VTI look like very clear resistance with a weak advance and tag of the level. Usually this means the next move is down. In addition, though XIV held Q1P, clear resistance on the FebP. Combining this with VIX above all pivots adds to bearish conclusion for risk." 

5 2 VIX.png

The China tech call, 10 months later

As we get deeper into 2017 Q4, I am becoming more and more pleased with the call I made about 10 months ago in December 2016:

"...maybe China tech will takeover as a sector-like leader. This is pure theory at this point, since some key China tech names have weaker pivot status than QQQ. Because we should compare apples to apples, let's stick to ETFs instead of stocks. The highest volume is KWEB and it has the big names: Alibaba, Tencent, Baidu, etc. Repeat, not a trade rec, this is larger view idea for a theme we may see in 2017."

Yup! Caveat - portions of the original post were not right because I was also thinking that tech a la QQQ would get laggy at the time. This was when QQQ was still below its 2000 top. After it cleared that level, I changed my mind :)

But really, long China tech was *almost* the best move of the year. The only other thing that I could have said to beat it would have been something like "Everyone thinks Trump will be high volatility, so just put everything into short vol and that will win big." That would have been genious, but I didn't quite get there.

China tech has been the second best trade of 2017 - not too bad. And a lot less drawdown than the -26% shocker in XIV (which I nailed too btw). 

This sort from ETFDB takes out leveraged vehicles; sorted by YTD %.

17 10 ETFDB.PNG

Chart below of KWEB with data of comment "maybe China tech will take over as sector like leader" with QQQ in red, dated from 2016 Q4.

17 11 KWEB vs QQQ.png

Now for the truly dedicated readers - WHY did i make this call? There was not much in charts at the time.

1. Sentiment seemed quite bearish on China, and SHComp already had dropped -49% and was acting more stable. Keep in mind that 2008 was only -57% absolute high to low; so what people were expecting significant downside after -49% already done seemed rather absurd. 

2. I thought given multiples that smart money would start to allocate outside of USA - correct, big time, not just in China tech. It just so happened that China tech benefitted the most from this movement. 

3. Esoteric / proprietary time cycle analysis. Searching timing for more of this aspect of my work. 

A few more charts:

KWEB vs USA main indexes - SPY QQQ DIA IWM VTI.

KWEB vs sectors - XBI SMH XLF XLE
XBI & SMH both having great years too.

18 2 KWEB vs sector.png

KWEB vs other developed, in $USD - EFA EWG EWJ

KWEB vs other emerging - FXI EEM ASHR (ETF for Shanghai Comp) INDA EWZ

18 4 KWEB vs EEMs.png

And now to the short vol XIV, one of the few things to be beat KWEB but with lot more volatlity. 

The VIX low and XIV high, again

I am perhaps tempting the market gods to humble me by another post in this featured section on this call. You see, the first version from 7/28 had suspicions of a decent turn, but this was before the big move that turned a 30% VIX jump into a 95% explosion!*

* VIX 7/26L to 7/27H = 30.1%
* VIX 7/26L to 8/11H = 95.5%

Before that big move, I pounded the table on 8/6 with a post, "XIV, again".

"In case you haven't gotten the point I am very keenly watching VIX and XIV for a trade and in fact already partially positioned in a rare UVXY position. XIV is sitting on YR3 at 95.23. This could be the turn of the year. The VIX short trade is hugely crowded. As it turns out the July close on XIV was 94.37. This means there is a hugely significant zone between 95.23-94.37 that combines YR3 and the monthly close high. Anything below this is very vulnerable. Interactive brokers hiked margins for VIX futures and this could be the spark for a XIV selloff on Monday. I'm ready to add."

15 10 XIV D.png

Monday didn't sell off but daily comment spotted the rally as fake and then Tuesday dropped in a big way. Full disclosure - I did not nail the exit. Great trade nonetheless. 8/4 close to 8/14 open still +20% on UVXY.

The full series of VIX and XIV posts:

7/25 VIX and XIV blog post - Intro to idea of an immanent turn.

7/26 daily comment: "I think VIX may have bottomed today..." (In case you don't know or aren't looking at charts, that was *the low!*

7/28 Featured post "So if you are not getting the point about XIV being on YR3 with me pointing out GDX major high, China multi-decade high, GLD all time high, SPY & QQQ multi-decade highs, I cannot really help you."

7/29 Safe havens: "We could have just seen the major turn in XIV for the year. If you think this is too much a stretch then please review the charts towards the end of this review and see if you are convinced that seemingly unstoppable trends can and do end on yearly levels."

8/5 Safe havens blog post: "XIV is seeing resistance at YR3. This could be a critical turn..."

8/6 XIV, again blog post

Any algos out there that caught both the global yield low in 2016 and VIX low in 2017 - one and only one shot each? I didn't think so. 

2016 year in review

The collection of key calls below have been on the right side of markets - meaning mostly USA and global stock indexes, and also selected bonds, currencies and commodities - for much of the year. At nearly every point, The Pivotal Perspective has been long the market leaders early in the move, and locked in gains near the highs. The Pivotal Perspective has been bearish when correct to be bearish - on stocks in January, $USD in March and April, TLT and GLD in Q4. And it has been bullish when correct to be bullish - TLT and GLD in January and well beyond, stocks since March through Brexit and TrumpIt, $USD in Q4. Please see for yourself by reading the real time comments made on the day of entries, not after the fact, all documented below. 

Most usually I go with trends - buying and rotating into strength, and avoiding weakness (except as occasional shorts). Only three "speculative" ie pure counter-trend positions were recommended all year. All others required the index to be at least above a monthly pivot to be long (and most usually more than that, ie, above 2, 3 or 4 pivots); or below a monthly pivot to be short (again, most usually more than that, ie, below 2, 3 or 4 pivots). But these were the three - and only three - pure counter-trend plays:

DIA long 2/12, one day off re-test low of year 2/11
Oil long 2/12, one day off low of year 2/11
TLT short triggered by level specified in advance on 7/8, high of year within .02

Is there anyone else out there in the market commentary universe - or for that matter, any algo - who (or that) told you to buy stocks and oil both one day off the low of the year, and short bonds on the very top? And without buying on any drop, and shorting bonds the whole way up? Three for three on the biggest turns of the year? I don't think too many people or programs can match what I did this year in this regard. 

An assessment of the calls below leads to only one conclusion - despite all the current hoopla about passive indexing, an intelligent active approach is possible. Perhaps a bit less so for the very largest institutions who are less flexible in maneuvering, but if major players like Druckenmiller and Icahn can unwind significant positions in a day, then most of us can too. 

Funny, hedge funds are suffering huge withdrawals due to pathetic performance. And yet there *is* a different way which I have demonstrated from the start of this site - it just takes some fresh synthetic thinking. I hope to continue to demonstrate this in months ahead. 

January
Turned decisively defensive USA stocks 1/6-7 and bullish TLT 1/6 as well.
SPY to 186.25 from 1/6
Bear for real from 1/7
TLT buy from 1/6/2016

Targeted TLT at 134 when it was at 125.
TLT target 134.42 from 1/13

Highlighted gold at the end of January and recommended to add in early February.
GLD posts 1/27 & 2/1

February
Started buying back stocks and oil 2/12.
INDU / DIA speculative buy from 2/12
Oil speculative buy or short cover 2/12

Recognized this as possible low of year. 

Spotted Brazil, Russia and EEM out-performance early in the move. All three, especially Brazil, continued out-performance into November. 
RSX & EWZ long ideas from 2/13

March
Turned back to bullish USA stocks 3/12.
"Bull alive and kicking" with INDU above 17138 from 3/12

Recommended Dow Industrials and Semi-conductors on the way up. Semi-conductors among best USA sectors to hold for most of the year. 
DIA and SOXX longs on the way up

While being bearish $USD.
DXY weak from 3/16

April
Bullish USA stocks.
Bullish throughout April...

Until 4/19-20.
Top calls 4/19-20 and 5/1

May
Spotted 5/19 as decent pullback low. 

June
Bullish after Brexit.
Critical day 6/27, very bullish from there through early July.

July
Shorted bonds at the top! 
Bond short at the high!

This remains the only speculative (ie above pivots) non hedge short I have recommended on this site - ever.

August
Stayed long early August when several prominent names were all saying sell. 
"Long and strong" in August so far...

And added a top performing EEM early in the month. 
EEM long 8/3

Until turning more cautious and saying upside limited later in August and early September.
Caution comments last several weeks!

Started thinking about a big jump in rates that would benefit financials - written with TNX at 1.57 (TNX currently about 100 bps higher, and XLF up more than 20% since then).
Big picture thoughts

September
Expected "stiff resistance" to hold 9/6 (market agreed with a 9/7 key high)

October
Was clearly bearish TLT and GLD early in October.
Not surprised at TLT and GLD slam

And massively bullish $USD.
Long both $USD and oil for Q4

While ducking out of the way of a stock pullback later in the month.
Caution alert 10/27, lifted 11/7

November
Was accumulating financials in October, specifically recommended early 11/5, and proclaimed new sector leader 11/9.
All over financials before the jump!

Clearly bullish USA stocks after the election, and continued bearish safe havens TLT and GLD.
Bullish comments from 11/9+

December
Suggested partial portfolio hedge right on RUT / IWM highs.
12/11 Total market view

And got the FXI short! (The only non-hedge short since 12/7)
Caught China short!


Bond short at the high!

Yes it is true. Regular readers know my basic take is "buy what is going up" ie above pivots. Once in a while, a combination of pivots and other factors lead to good "speculative" ie counter-trend buy setups. To me this means buying support levels (green lines on charts) which by definition are below pivots (orange). I issued these for INDU and oil on 2/12 and have documented these calls elsewhere. And even rarer than that, a short setup at resistance levels will attract my attention. 

Shorting the market is very enticing because then things drop they go down fast but in practice it is often difficult. Money around the world is looking for a place to go, and this makes most asset classes move up over time. When you are long you may have people taking profits and a few pro short sellers against you, but if you are short then you have the trillions of $ out there looking to buy something. 

Anyway, I digress. RSI's on bonds across the board were getting historically stretched and I wrote up two special posts on this here and here. 

On 7/6 I wrote this: "Interestingly, as "analysts" are starting to sound calls for TNX 1.0 (the % not a computer program version), I am increasingly wondering about a major turn in bonds based on major levels and RSI. TNX came very close to reaching YS2 today and remember the big turns that seem impossible happen on the big levels, just like the USA stock low of the year on RUT YS2 exact. Remember, resistance levels are better used as profit areas on longs instead of shorts - but if you want to take stabs at speculative trades (ie short above all pivots), then multiple RSI extremes and levels are the place to try. Watch reactions on these levels: JulR1 reached today, then Q3R1 just slightly higher 143.64 which would be a good tag area for a setup. If above that then I'll start thinking 2HR1 / YR2 combo 145-148."

The TLT high according to my data feed was 143.62 on 7/8. 

Thus far this has been the only bond short I have even mentioned all year, and in fact the only counter-trend short (ie short at resistance, usual focus is short what is below pivots only) I have recommended on this site ever.  

That was a pretty hot day too because I also pointed out a biotech long idea. See previous featured posts! 

DIA and SOXX longs on the way up

From the start of the rally on 2/12 I have been recommending DIA (or INDU or YM take your pick).

And on 2/24 on playing the bounce scenario: "If so then way to do it is reduce on full safe haven positions if they show rejections from major resistance and put into the USA leaders DIA and SPY that are above the FebPs (obviously, only if that is the case)."

3/8, 3/9, 3/10 pointing out how DIA / YM holding YP already, the most bullish of the USA main indexes. 

Along with every weekly USA main index post after from 2/13 (just go to FAQ, put in USA main index and then use the tag feature to view them all) - I pointed out that INDU had held its YS1 (where others broke and recovered).

OK, DIA is not that big a deal compared to SPY as percents up from lows approximately the same. Actually by percentage gain IWM is up the most from the 2/12 low; but also most at risk to stall. If it is percentage up from lows you are after, then you had chances on oil, EWZ, RSX and EEM too!

But I would say DIA being the pivot leader has been much easier to hold the way up, and this counts as a psychological advantage. After clearing the FebP on 2/17, there was not 1 daily close below a monthly pivot! And despite the red bars 3/8-10, DIA was clearly holding its yearly pivot! Now today as I type it is soaring above its MarR2 as well! Just no reason to be reducing at any point yet on the rally. 

And here is SOXX idea from 3/1 as a way to shift portfolio more long even though already quite a bit up from lows: "Then easiest way to shift more bullish was to cut FXI shorts, add on SOXX above its 1HP and possibly QQQ above its YP, although that level is a bit suspect."

Now this has mattered quite a bit. QQQ from 3/1 close to today as I type it is only up 1.5%. SOXX up nearly 5.5%! If you wanted in on the rally and get back into tech, then QQQ is middling, IBB is a disaster, and SOXX is leaving them in the dust. 


"Bull alive and kicking" with INDU above 17138 from 3/12

Some good old fashioned human judgment and pivot analysis here. On 2/11-12, I noticed that of the 5 main USA indexes, SPX, NDX, INDU, RTY and NYA, INDU held up the best. So that in addition to a VIX and VXD reversal signal from major pivots, timing window 2/11-15, bearish some bearish sentiment extremes, and most especially the amount of indexes all holding yearly levels, led to the speculative buy call 2/12 on both DIA and oil. 

I called it "speculative" for the simple reason that nothing was above any pivots yet, and my preferred method is to long above pivots and avoid, hedged or short below. Later after the shuffle at the end of February, INDU / DIA / YM was still the leader and so first choice. Last week still the leader, with DIA & YM clearly holding their YP level for 5 days *before* the big jump on 3/11. 

This wasn't the case last year or even 2014; NDX was usually the leader (of these 5 majors; IBB even better). But this year IBB is getting crushed and dragging down NDX. So that is why I shifted with the post on 3/12 - if the leader INDU is strong and holds levels, bull is alive. Other analysts are chiming in now after the jump above the D200 MA and breadth etc, but really DIA has been nothing but incredible from 2/24 and then especially from 3/1. 

From 3/12 Bull vs Bear post:

"But now it may be time to shift tune. INDU / DIA / YM has been the pivot leader on the rally. [...] INDU was the first cash index to close above its FebP (fractionally on 2/17) with others still below, and likewise the first to close above a long term pivot on 3/4 above its 1HP, where the others hadn't done that yet. And really YM and DIA were the best tells last week, clearly holding major support before the big jump at the end of the week. On Friday both SPX and INDU leaped above all pivots on Friday, but with INDU the current leader the market call here is:

Bull alive and kicking above 17138 (the highest of the INDU pivots, the Q1P) and still more likely than bear with INDU above its YP at 17048."

INDU / DIA speculative buy from 2/12

While I'm generally in favor of buying above pivots, sometimes you get a good setup. From the 2/12 post early in the morning and well before the close.

"INDU is reclaiming 2 long term levels, YS1 15746 and 1HS1 15817. VXD poked above its YP 26.79 and 1HP 27.14 and as I type back below. All the other yearly levels I have been mentioning the last two days here and here and here and here as I type are all resolving in bullish fashion. INDU is the only index of the main USA 5 to hold its YS1 (SPX, NDX, COMPQ, RTY) all broke. 

So if INDU holds its YS1 and 1HS1 into the close, along with VXD remaining below levels, i think a decent speculative buy setup."

RSX & EWZ long ideas from 2/13

In the weekly strategy sum, I noted that RSX and EWZ were the closer to regaining the Feb Pivots compared to USA indexes, and if any further gains in oil, RSX "will pop" and EWZ "could be squeezy."

From Weekly strategy sum written on 2/13:

"3. Interesting vehicles to watch are anything that is poking above a monthly pivot. This is far from the case in any USA main or supplemental index, although if oil continues XLE will have the first shot. In world indexes, RSX will also pop on the oil trade and is just barely below its FebP as of 2/13 close, and selling in EWZ seems to have dried up with a much higher low forming and EWZ above its FebP on 2/13 close. That is probably more currency effect and DXY weakness, but could be squeezy."

Here are pivots only charts (without S or R levels) for clarity. RSX +4% today and EWZ +5%. XLE is just recovering its pivot today, so actually RSX and EWZ beat out on the buys. I also added EEM as speculative buy for the same reason yesterday.