Regular readers know that I factor VIX & XIV into every equity positioning decision. Market observers know that VIX and XIV are historically stretched. Where is the turn?
Let's take a detailed look.
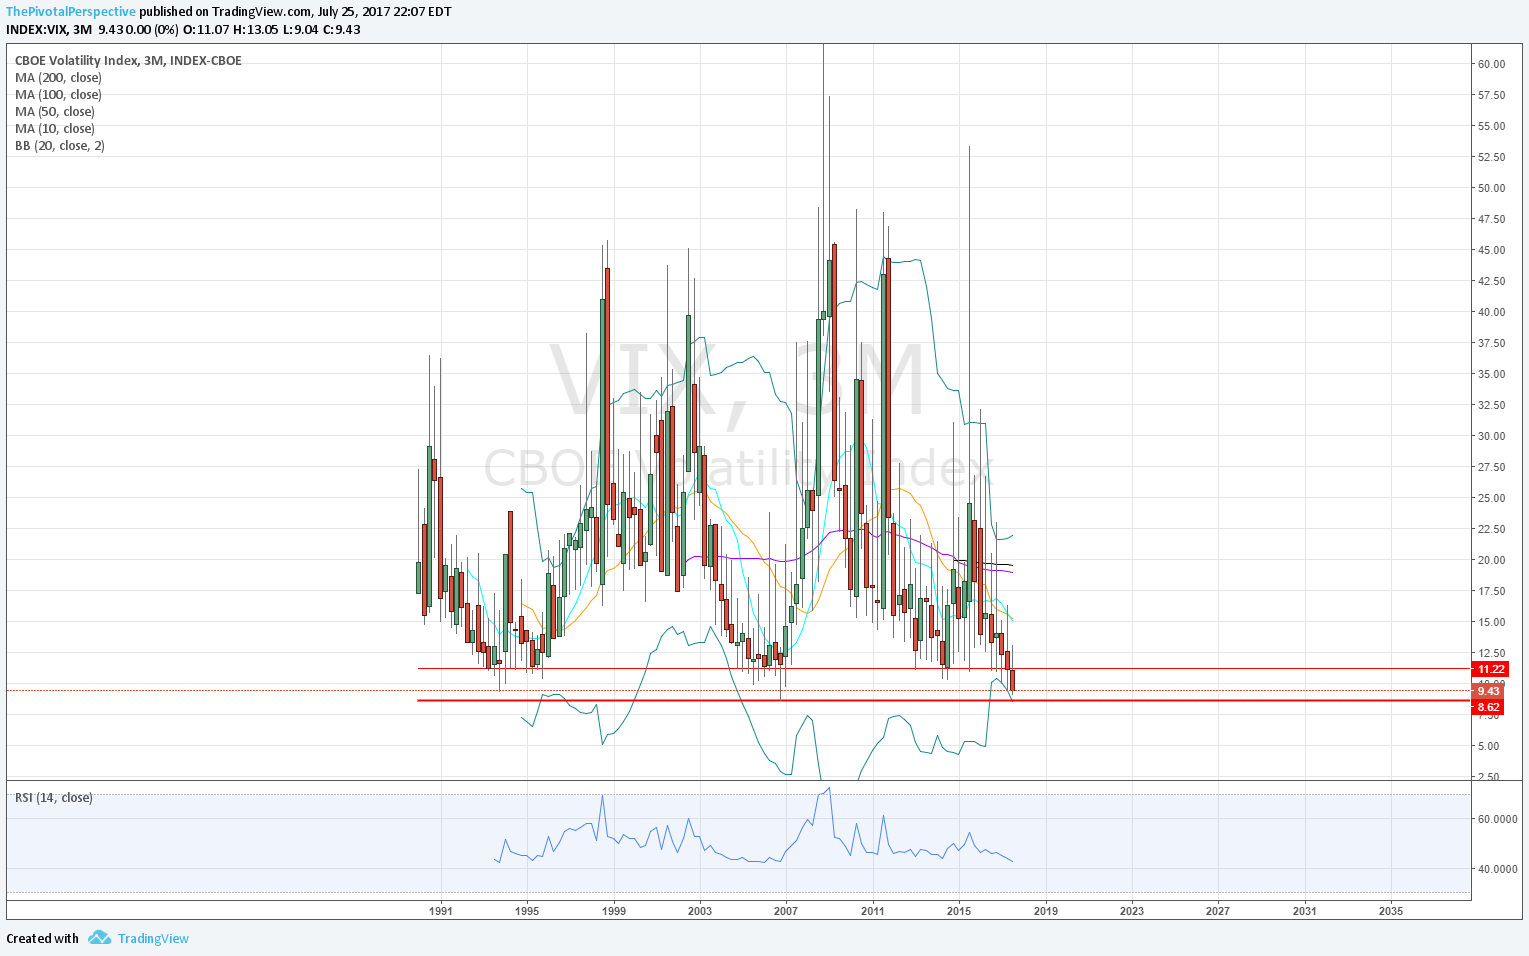
VIX Q
Already crumbling below the quarterly close low (thin red line) of 11.26, VIX seems intent on testing the all time price low of 8.60 reached in 2006 Q4.
VIX M
Monthly low close of 10.41 was in May 2017; before that 10.42 in January 2007. Also seems like VIX could tag the lower monthly BB for a turn, currently 8.03!

VIX W
And here is the weekly version with low close just the prior bar at 9.36. Other than RSI at typical low area, nothing glaring here other than above last week's close.

VIX D
JulS1 only a few days left, but at 8.64.

VI Q
Would have to move above 11.25 for better buy.

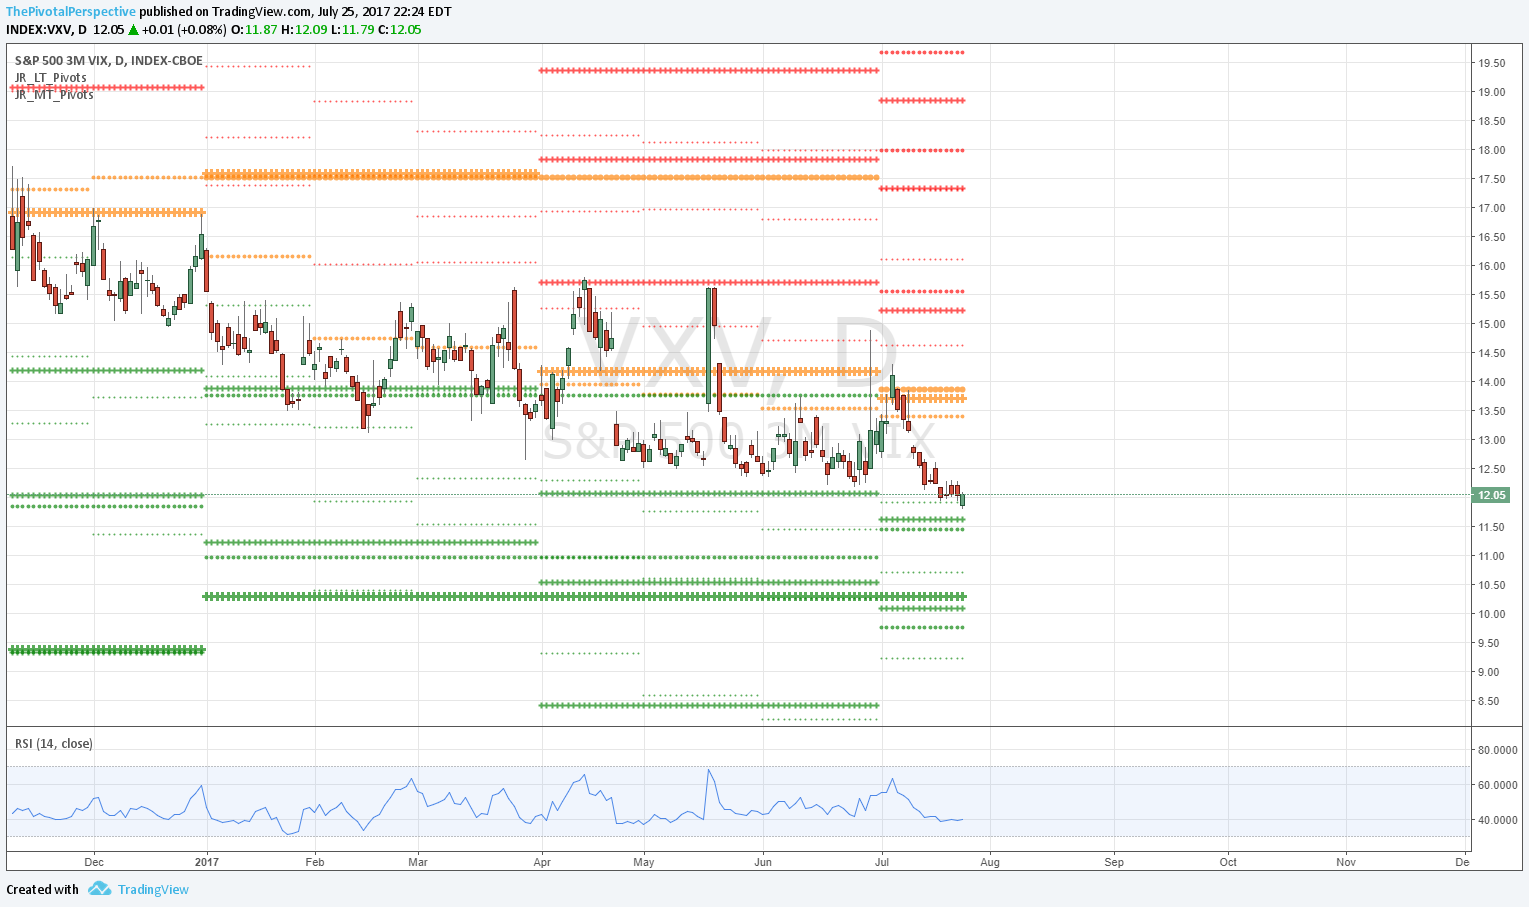
VXV (3M)
Might be reversing on JulS1 HERE, with lots os support not far below.
VVIX
The VIX of VIX is bang on JulS1 as well, and just a little higher would look like decent reversal.

XIV Q
Unfortunately not enough price history, bu tRSI 78.9 getting up there. Also, BB value 80 is significant % below current levels.

XIV M
7th bar outside the montly BB! RSI 81 is impressive, but let's face it, sometimes RSI goes higher.

XIV W
RSI positive divergence and outside weekly BB. Cannot say glaring top yet.

XIV D
And here are pivots. Testing YR3, so far above for 2 trading days.

OK - full analysis of other technicals does not give huge edge to a turn. But XIV is on YR3. I leave you with a few other charts for consideration.
GDX W
Major high on 2016 YR3.

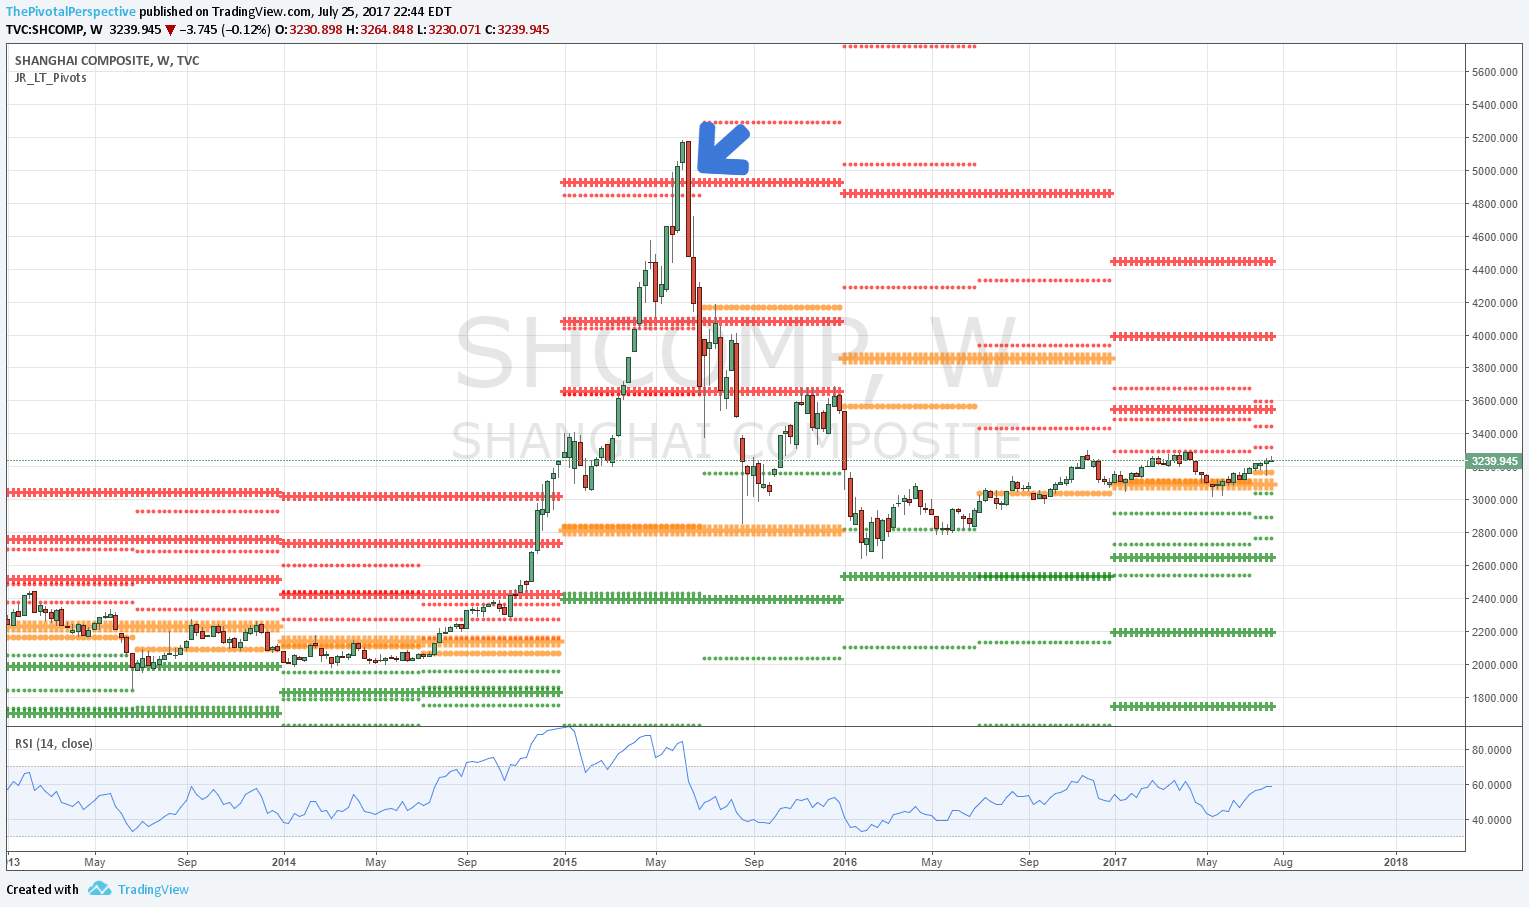
Shanghai Comp W
Major high near 2015 YR3 - 2 bars of overshoot then wham.
GLD W
2011 top on 1HR3, with near tag of YR3.

SPY W
2007 top on YR2 exact, along with 2HR1.

QQQ W
2000 top 1HR2 exact, near tag YR2.
