The VIX low and XIV high, again

I am perhaps tempting the market gods to humble me by another post in this featured section on this call. You see, the first version from 7/28 had suspicions of a decent turn, but this was before the big move that turned a 30% VIX jump into a 95% explosion!*

* VIX 7/26L to 7/27H = 30.1%
* VIX 7/26L to 8/11H = 95.5%

Before that big move, I pounded the table on 8/6 with a post, "XIV, again".

"In case you haven't gotten the point I am very keenly watching VIX and XIV for a trade and in fact already partially positioned in a rare UVXY position. XIV is sitting on YR3 at 95.23. This could be the turn of the year. The VIX short trade is hugely crowded. As it turns out the July close on XIV was 94.37. This means there is a hugely significant zone between 95.23-94.37 that combines YR3 and the monthly close high. Anything below this is very vulnerable. Interactive brokers hiked margins for VIX futures and this could be the spark for a XIV selloff on Monday. I'm ready to add."

15 10 XIV D.png

Monday didn't sell off but daily comment spotted the rally as fake and then Tuesday dropped in a big way. Full disclosure - I did not nail the exit. Great trade nonetheless. 8/4 close to 8/14 open still +20% on UVXY.

The full series of VIX and XIV posts:

7/25 VIX and XIV blog post - Intro to idea of an immanent turn.

7/26 daily comment: "I think VIX may have bottomed today..." (In case you don't know or aren't looking at charts, that was *the low!*

7/28 Featured post "So if you are not getting the point about XIV being on YR3 with me pointing out GDX major high, China multi-decade high, GLD all time high, SPY & QQQ multi-decade highs, I cannot really help you."

7/29 Safe havens: "We could have just seen the major turn in XIV for the year. If you think this is too much a stretch then please review the charts towards the end of this review and see if you are convinced that seemingly unstoppable trends can and do end on yearly levels."

8/5 Safe havens blog post: "XIV is seeing resistance at YR3. This could be a critical turn..."

8/6 XIV, again blog post

Any algos out there that caught both the global yield low in 2016 and VIX low in 2017 - one and only one shot each? I didn't think so. 

Nailed India, China and EEM top!

8/2/2017 Global indexes blog post: "Yes I like the China, India and EEM trade and TPP rotated into this in March with a substantial percentage of portfolio since then, often 40%. This has benefitted from Trump shenanigans and institutional recognition that EEMs should have far higher market cap compared to global GDP and GDP growth. But if markets were to have a pause, it is at places like this."

11 2 INDA D.png
11 5 EEM D.png


All over IWM weakness

Today the Financial Times is reporting on IWM weakness. A bit late, imho.

7/22/2017 USA main indexes: "RUT W: Looks about to get whacked. Not sure how the cash index shows higher high and reversal on Friday but maybe option expiration related. IWM D: JulR1 near tag and down. Still a more threatening reversal here than the others..."

7/26/2017 Daily comment: "Keep in mind that recent sentiment measures have been extended, and this increases the risk of a slowdown or shakeout. It looks as if Trump trade IWM and XLF will lead the way if that happens. Also, "Also, IWM is now a leading short hedge candidate."

7/29/2017 USA main indexes: "RUT sum: Continues to be weak link of USA main indexes."

8/2/2017 Daily comment: "IWM leading down as called, below AugP."

8/3/2017 Daily comment: "IWM leading down (as called btw), below AugP and testing major support area (another day down of similar magnitude would be the first long term weakness in months)"

8/5/2017 USA main indexes: "IWM has led the way lower as called, already testing a major support area 2HP and Q3P."

8/10/2017 Daily comment: "IWM 2HP / Q3P rejection!"

11 20 IWM D.png

Onto China tech trade from 12/2016

First caveat - not all of my opinion from December 2016 was correct. However, considering that CNBC just today reporting that "These China tech stocks are even hotter than FANG" I was pretty good at anticipating the next big move in markets with comments from December 2016 on KWEB:

"maybe China tech will takeover as a sector-like leader"

"Repeat, not [yet] a trade rec, this is larger view idea for a theme we may see in 2017."

Here's the original post. And here is KWEB since then, with the QQQ comparison in red. That's +24% for QQQ and +50% for KWEB. Ding!!!

Looks like TPP caught another major market turn!

This site in under 2 years has caught some huge turns:

2/12/2016 Both Dow and oil buy (1 day off low of year for both)
7/6/2016 TLT short rec at price level hit 7/8 (the top in bonds!). This remains one of only two counter-trend short trades recommended on this site. 

And numerous trading turns, too many to count - most recently GLD buy 7/11/2017 - not the absolute low, but pretty close. Before that QQQ buy 7/7/2017, one day off pullback low. The list goes on.

And the latest, which could turn out a big one. I've always kept an eye on VIX and XIV but didn't start calling for a possible major turn until *this week!*

On 7/25/2017 I wrote a special blog post on VIX and XIV on the blog. This post includes a lot of views of VIX and XIV, but the latter portion pointed out that XIV was on the YR3. 

"OK - full analysis of other technicals does not give huge edge to a turn. But XIV is on YR3. I leave you with a few other charts for consideration."

And proceeded to list:
GDX 2016 high on YR3
Shanghai Comp 2015 high on YR3
GLD 2011 top on 1HR3 / YR3
SPY 2007 top on YR2
QQQ 2000 top 1HR2 / YR2

So if you are not getting the point about XIV being on YR3 with me pointing out GDX major high, China multi-decade high, GLD all time high, SPY & QQQ multi-decade highs, I cannot really help you.

*

If that isn't clear enough, then 7/26/2017 Daily comment: "PS: I think VIX may have bottomed today (on the 7/26 timing date FWIW), or near a bottom soon. I don't know if VIX will go lower to its Q3S1 or start moving up from today's low; the corresponding move in XIV would be a rally to its 2HR1, or simply slide under its YR3 tomorrow. But at the same time, even if today was the VIX low & XIV high, I don't think those betting for a huge move in VIX via calls in the near term will make much money. This has been a massive trend with smart $ players, and they should distribute first. This would mean a subdued period of higher lows in VIX as stocks go higher. Then, possibly in a few weeks or months, a real move higher in VIX. I still will be watching UVXY and perhaps VIX calls for opportunities."

Now anything can happen in markets and maybe VIX will collapse from here and we'll see into the low 8s. But right now I think the low is in on 7/26, the day I posted the bottom call. This does not preclude higher stock prices as mentioned above.

PS: JP Morgan Head Quant Marko Kolanovic has been calling for a VIX low for months. 

On a roll!

The Pivotal Perspective on such a roll in the last few weeks! Maybe has to do with just a bit more time to look at charts - day job in summertime mode.

ALL adjustments from 6/20 on (E = entry, X = exit)

6/20X - Out of QQQ (from 12/7/16) and KWEB (from 4/20/17), not bad exits of multi-month holds
6/26E - 7/5X SMH short, +3.35% x 1 unit
6/26E - 7/5X USO long, +4.15% x 1 unit
6/27E - 6/28X FXI short hedges, -.5% x 2 units
6/28E - 6/29X IWM longs, -.5% x 2 units
6/29E - 7/5X FXI short hedges, -.9% x 2 units
7/6E - 7/6-7X, UVXY, +6.0% x 1, +1.7% x 1
7/6X - 4 SPY & 2 EEM, various entries from March - April
7/7E - 7/10X, IWM longs, -.43% x 2 units

Open positions
4/17E, 2 SPY longs, current +4.7%
6/28E, 2 XLF longs, current +1.3%
7/5E, 2 INDA longs, current +3.5%
7/7E, 1 QQQ, current +3.2% 
7/7E, 1 SMH, current +4.0%
7/10E, 2 EEM, current +4.1%
7/11E, 2 GLD, current 1.4%

Not counting the entries from April, and just measuring 6/26+ (open position gains as of 7/17 close):

14 winners out of 22 positions for 63.6% win rate; current average gain 3.07%
8 losers, average loss -.58% 

Meanwhile SPY from 6/20 is 1.04%. 

This is not a quant strategy, nor AI, nor an algo. Technicals, timing, and judgment. 


Nailed two counter-trend moves

I was totally on top of the potential for re-balancing / mean reversion near the end of June from early in the month. Specific trades triggered with oil long and semi-conductor short, both from 6/26. 

6/3/2017 Total market view: "Another thought - at some point in June we may see professional re-balancing move. This would imply tech slowdown and and possible bid in energy, the weakest S&P sector this year."

6/11/2017 Total market view: "Given the disparity between tech gains and energy losses, I think there could be more to recent moves given likely institutional re-balancing near the end of the second quarter."

6/18/2017 Total market view: "As we head into the last 2 weeks of the 2nd quarter / 1st half, it is still possible to have re-balancing out of the hottest trade and money into sectors like energy. This would imply risk to tech, semi-conductors, Europe (which I don't track too much here) and global indexes."

6/24/2017 Oil blog post: "While CL1 contract is not a screaming buy, USO looks like a decent speculative buy setup based on: Monthly chart Bollinger band and RSI divergence and just as important 2017 YS1 hold. I don't know if this will get far but if not short (as one could be on USO from 4/20 on) then this is the kind of place to try a rare counter-trend move. Note: I mention these only rarely because the easier money is usually with the trend."

6/26/2017 Daily comment: "Portfolio is up to 90% long with a speculative buy on USO near the YS1. This is totally counter-trend move - ie below all pivots - but in certain very rare circumstances these setups offer good risk-reward. I haven't done too many of these but mentioned in an oil post on the blog over the weekend. Risk is limited to daily close below the YS1."

6/26/2017 Daily comment: "I will go out on a limb and issue speculative short on SMH based on rejections of 1HR3, Q2R2, and D20MA failure." 

USO for the week from 6/26 open, nearly +7% gain.
SMH short from 6/26 close, +4%.

My record on speculative trades on this site is 5 for 5:
Dow and oil longs 2/12/16
TLT short 7/8/16
USO long and SMH short 6/26/17

That's it.


Timing the market?

This phrase is like saying you believe in UFOs or something. Everyone knows timing the market is impossible. Right? 

6/26/2017 Daily comment added: "In addition, special 1 day timing cycle indicates higher than usual odds of a market smash on Tuesday. What qualifies as smash? Let's say QQQ -1%."

Nailed that, QQQ -1.8%. Quants, please tell me, what were the statistics on that happening?

This is just smart part of a Timing project I have been pursuing for quite a while, and maintain in skeletal fashion like this at the end of each Total market view.

6/3/2017 Total market view:

"TIMING (Proprietary work in progress model)
June dates (published in 5/29 Total market view)
6/9
6/15-16
6/21-26

In addition, a larger timing cycle points to momentum slowing in risk assets from 6/5 into July."

So there you have it.

6/9 price high in SPY, QQQ and IWM - on a turn date mentioned weeks before
6/16 pullback low in SPY and QQQ - ditto

6/18/2017 Total market view added this for the 6/21-26 window: "prefer down for stocks especially the hot trades of 2017." Check.

The larger cycle turned out the most important. From 6/5 on, all the momentum trades have been whacked:
QQQ - only 1 day fractionally higher than 6/2 on 6/8, then slammed for the worst drop in months
SMH - a bit higher into 6/8, then slammed
Bitcoin - top 6/11 just a bit higher than 6/6 high, then -30% drop in 4 days
Ether - did go higher into 6/12, but flashiest crash ever on 6/21

So, market timer for service... all I can say is this part of my work went into the 110% annual gain in 2013 at the fund. But thus far, I haven't found anyone else interested. Too bad - it works, no one else is doing it (uncorrelated!), it is mindblowing, and fun. 

Bought the dip

While showing concern about the market from 4/5+:

4/5/2017 Daily: "Heads up! While not a full fledged caution/trouble alert, we have a semi-one today, with VIX close above the Q2P. I don't mess around with VIX breaking out to upside!"

4/6/2017 Daily: "VIX closed fractionally below all pivots again which removes the semi trouble alert, but move lower is not clear rejection enough to be fully bullish. That said, XIV looks ready to get slammed with clear resistance on the YR2 level - this would be bearish for stocks." 

4/7/2017 Daily: "Everyone knows that USA stock indexes were very resilient today, with ES futures finishing ~16 points off overnight lows. Given double whammy of Syria and jobs, does that mean all is OK and Trump bull market can carry on for Q2? No way! VIX and XIV have together sent the clearest warning signal this year, and SPY, DIA and VTI continue to have trouble at their AprPs while IWM is below its Q2P. Only QQQ holds."

4/8/2017 Safe havens: "Main point for stock exposure is that VIX is above Q2P and XIV has both YR2 rejection and AprP break on same day. So to my view, these are looking more threatening for risk assets since before the election."

Portfolio was buying back 4/17 and was fully long by 4/20, maintaining overweight in global indexes.

4/15/2017 Safe havens: "VIX jump above Q2P sounded alarm. ... Already at 1HP but not above. This sets stage for stock bounce next week." 

4/16/2017 Total market view: "VIX closing just under its 1HP of 15.99, and some SPX and INDU variations within striking distance of recovering Q2Ps, make a bounce a possibility. Should this happen with VIX reversing lower from 1HP, the portfolio will return more long, continuing to emphasize what has shown pivotal strength during this pullback."

4/16/2017 Total market view: "Though N Korea worries seem to have ebbed over the weekend, there are still political concerns ahead with the French vote. It is possible that VIX remains elevated, or USA stocks bounce and then fail. It is a week to stay nimble, because a hold here could be one of the better buying opportunities of the year; yet in this environment there is the risk of lower before the bottom that matters."

4/17/2017 Daily: "Let's count bullish developments... Safe havens all confirming... sentiment studies indicated enough bearish sentiment over the past 2 weeks... easy to jump back in here with all this pivot action happening simultaneously and VIX below 16 for session and dropping hard all day... This takes portfolio to fast 100% long." 

4/20/2017 Daily: "What a difference a day makes. Yesterday I thought the markets were hanging by a thread - but SPY Q2P held in convincing fashion. A lot of items in the bull column today..."

4/20/2017 Daily: "IWM USA small caps are especially interesting here, first time above all pivots since 3/21, a month ago. Tech and semiconductors both back above all pivots as AGG has faded. This is very bullish, and given daily RSIs and long term levels it is possible that some safe havens (AGG, LQD, MUB) just made a very key turn for the year."

4/21/2017 French election risk: "This may be part of the Q2 safe haven bid. ... But I think currency is telling the story here. Euro is in the middle of its range for 2017. It is below its YP and 2HP, but above its Q2P and still above AprP. DXY is weaker by comparison, closer to lows of the year." 

4/22/2017 USA main indexes: "Positive action on USA indexes last week as SPY, DIA, IWM and VTI all recovered Q2Ps as leader QQQ back above all pivots. But not as strong as it could be, with SPY, DIA and VTI below AprPs. NYA is the one non confirming index, still below Q2P."

4/22/2017 Politics and charts: "In a bull market, VIX RSI overbought along with pivot tests & holds have been many of the perfect places to buy. These are all pointed out in blue arrows on both pivots and RSIs, with one notable fake-out before the British election in red."

4/23/2017 Total market view: "We will find out Monday whether index & currency calmness was correct given French election. Perhaps after 2 spikes down and rallies (Brexit and USA election), people weren't selling in front this time yet should have been. But I have to go with what the market is doing instead of what I imagine it could do. The fact is by the end of last week nearly all USA main indexes recovered Q2Ps, an overbought VIX was rejected by 1HP, and these were happening as some sentiment meters were recently bearish. These are often the best times to take a stab on risk assets."

4/24/2017 Daily: "The Pivotal Perspective delivers again! The VIX 1HP rejection and multiple Q2P holds last week, in addition to EUR chart looking fine especially compared to DXY, gave me confidence to be fully long. Current portfolio already 100% in and the global indexes all did great with DXY down. Now I think there is the case for some leverage..."

Another major turn nailed

To set the stage for this post, I cannot claim the huge out-performance I have demonstrated in other quarters because I didn't rotate into tech and global indexes soon enough in Q1. But the portfolio has kept up with benchmark SPY and had some nice rotations out of heavy long IWM, maintaining XLF overweight until last week, jumping in INDA and EEM before recent pops. 

The real point of this post is that I've been largely bullish USA main indexes in 2017, but at the end of February pointed to valuation concerns; and since March 1 mentioned expectation of "a decent top" on SPY or DIA YR1 areas. It turned out SPY YR1 (or near enough tag to count, as related ES1 contract was within 2.5 points). Also as expected, the real damage didn't happen until after a high test. 

2/25 Blog post: SPX nearing longstanding valuation target

2/26 Total market view: "Price may continue to increase based on increasing earnings, but ultimately I think the markets will make a significant top with SPX in 18x-19x range."

3/1 Daily: "Based on VIX and other technicals, I think SPY YR1 or max DIA YR1 will be a decent top. That doesn't mean the market goes straight down. Usually the first reaction off a high is not the big drop."

3/2 Daily: "When I talk of markets "ringing the bell", it is days like this. ... this has many of the configurations of a classic top. What we don't really have yet is divergence on technicals, retests, and most importantly, more indexes on more than monthly levels, so this may yet still play out."

3/4 Valuation and fundamentals: "High of the week was SPX 2400. Basically the valuation target zone I have been mentioning since last August shifting over to Thomson numbers from WSJ data has been tagged."

3/4 USA main indexes: "SPX set sum - Major resistance cluster of YR1, 1HR2 and Q1R2 essentially reached and so far rejection. But momentum has been so strong that a test of this area more likely than an immediate big drop."

3/5 Total market view: "The most likely scenario from here is a consolidation or mild pullback for stock indexes (if they aren't going higher already) which then is bought and more indexes test key levels."

3/6 Daily: "But after this mini pullback completes, stage is set for high retest of sorts with major divergence, and this has potential to be a very key top."

3/7 Daily: "So far, top calls near 3/1 & 3/2 are playing out, but decline has been a creeper move. On the daily charts it looks like we could easily see a high retest of sorts. Zooming out to weekly or monthly charts, however, the drop looks more threatening, or at very least suggests minimal upside from here."

3/12 Total market view: "... there are significant factors which I think will limit upside ahead. First, monthly Bollinger bands on the USA main indexes. SPY and VTI have dropped back inside monthly Bollinger bands after being outside the bands in February. Once an index drops back inside the band, the band is more likely to act as resistance going forward. While QQQ and DIA remain outside monthly bands, this is fairly rare and at some point even a profit taking urge or other event will drop the price back in the band. Second, valuation has reached 17.99 per the current week's data and tagged the 10MA of 18x forward earnings (currently 2396). The moving average is still increasing which is a good sign, but I think the market may see some professional selling at this multiple. Third, the next visit to highs (should that happen) will likely involve RSI divergence on daily chart. Fourth, if the market can revisit highs or go higher, then major resistance lies on the SPY set (already tagged), DIA and VTI, which will all run into YR1 1HR2 Q1R2 clusters on any such move."

3/18 Valuation and fundamentals: "Sum - I consider the market fully valued here. We may see a professional selling reaction from 18x forward earnings and so far it has paused the rally when seemingly nothing else could."

3/18 USA main indexes: "However, market is pausing at SPX set cluster of YR1 / 1HR2 / Q1R2 resistance. At this point I think sideways or down is more likely that blast through..."

3/19 Safe havens: "VIX and XIV are still supportive of stocks. Levels to watch are move from MarS1 and YR2 respectively. XIV slightly above YR2 currently but "looks like" it may fade - please note the 11/3-4 XIV & stock index low was a fantastic tell. I always view tests of yearly levels as a big deal and the more things that say the same thing the better the signal."

Note: XIV broke YR2 in first hour of trading 3/21. 

3/19 Total market view: "Upside for stocks likely limited, but pullbacks will be bought. This has been the view all of March. Yet portfolio is back to 100% net long via 11 longs and 1 short hedge. If next week plays out more bearish I may reduce to 70-80% long via XLF or other exit, or hedge."

3/19 Total market view: "I didn't do a full Market top checklist post this week, but the difference between 3/20 week and 3/13 week is that now there is more divergence on daily RSIs and highs have been tested on SPY with lower highs on DIA. Also, more indexes have reached yearly levels - XIV YR2, EEM YR1, INDA above YR1."


Protecting gains from 12/12+

Recommendations shifted from extremely bullish post election to partially long after reaching major pivot level resistance and sentiment extremes. Heading into 12/12 week recommendations for 120% leveraged long (ie, anything above 100% is considered leveraged long). From there quickly down to 80% via hedges and shorts, and has remained 50-70% net long since then.

This has been the right approach with IWM high 12/9, SPY high 12/13, DIA close high 12/20.

12/11 Total market view: "Bottom line - Just like last week all we needed to do was watch Tech set Q4P (which clearly held and rallied), this week I'd suggest watching reaction from RUT YR2 1387 which is an amazing accomplishment with lows of year on YS2. The market has surprised me with strength and I suppose that could continue, but I 'think' the next move is sideways or some drop.  

[...] A partial hedge against RUT YR2 is a possibility with a tight stop above; this effectively locks in gains from any buys while holding longs. [...] Also, there is no reason to lose any money on the most recent leverage longs on QQQ from 12/7."

12/12 Daily: "Per Total market view could have had a quick reduction of 3 hedges on IWM as suggested near open and 1 FXI short on close based on the Q4P, taking total longs to 80%. with a partial hedge & short of -40%. Seems about right."

12/13 Daily: "Given NDX 100 tag, I think take 1 gain on that, dropping longs to 110% and total exposure 70%, and if FXI is visibly above DecP tomorrow then out."

12/14 Daily: "Per yesterday's note, if market reacted negatively from yearly levels I mentioned taking gains on DIA. If out 1 then 100% long and the shorts & hedges adjust to for 60% net long. Adding 1 FXI short with Q4P and DecP resistance, below all daily MAs except D200, for -50% short and maintaining 150% exposure."

12/20 Daily: Held ground to not be too bullish despite Santa and Dow20K chatter. "Perhaps I will miss out on some gains but I cannot return to leveraged long with USA leaders outside monthly and weekly Bollinger bands and sentiment in a top zone. But probably I should be market weight here, which means to add on the long side. Adding 1 DIA above the 2HR1 which is slightly above the price where I took it off last week. In spite of lower net long exposure though, IWM hedge will not cost much and FXI was right choice." 

12/27 Daily: Thought markets would be up, but kept hedges. "Most USA main indexes still under major resistance levels but if I had to guess it looks like breakout up in very near future. NDX closed above YR1 the first time this year, bullish. [...] No change to positioning. Keeping 2 IWM short hedges until daily close above YR2, and still in 1 FXI short."

12/28 Daily: "I don't know if this is right but thinking semi-conductors have had a huge run and might be subject to more tax related selling pressure in the new year. If we take the gain on that remaining position that will leave the portfolio with a bit more cash. This will help if things drop further, but could harm if the market rebounds and semi's jump yet again. Based on weekly and monthly charts I think this is the right move to take the gain." 

2016 year in review

The collection of key calls below have been on the right side of markets - meaning mostly USA and global stock indexes, and also selected bonds, currencies and commodities - for much of the year. At nearly every point, The Pivotal Perspective has been long the market leaders early in the move, and locked in gains near the highs. The Pivotal Perspective has been bearish when correct to be bearish - on stocks in January, $USD in March and April, TLT and GLD in Q4. And it has been bullish when correct to be bullish - TLT and GLD in January and well beyond, stocks since March through Brexit and TrumpIt, $USD in Q4. Please see for yourself by reading the real time comments made on the day of entries, not after the fact, all documented below. 

Most usually I go with trends - buying and rotating into strength, and avoiding weakness (except as occasional shorts). Only three "speculative" ie pure counter-trend positions were recommended all year. All others required the index to be at least above a monthly pivot to be long (and most usually more than that, ie, above 2, 3 or 4 pivots); or below a monthly pivot to be short (again, most usually more than that, ie, below 2, 3 or 4 pivots). But these were the three - and only three - pure counter-trend plays:

DIA long 2/12, one day off re-test low of year 2/11
Oil long 2/12, one day off low of year 2/11
TLT short triggered by level specified in advance on 7/8, high of year within .02

Is there anyone else out there in the market commentary universe - or for that matter, any algo - who (or that) told you to buy stocks and oil both one day off the low of the year, and short bonds on the very top? And without buying on any drop, and shorting bonds the whole way up? Three for three on the biggest turns of the year? I don't think too many people or programs can match what I did this year in this regard. 

An assessment of the calls below leads to only one conclusion - despite all the current hoopla about passive indexing, an intelligent active approach is possible. Perhaps a bit less so for the very largest institutions who are less flexible in maneuvering, but if major players like Druckenmiller and Icahn can unwind significant positions in a day, then most of us can too. 

Funny, hedge funds are suffering huge withdrawals due to pathetic performance. And yet there *is* a different way which I have demonstrated from the start of this site - it just takes some fresh synthetic thinking. I hope to continue to demonstrate this in months ahead. 

January
Turned decisively defensive USA stocks 1/6-7 and bullish TLT 1/6 as well.
SPY to 186.25 from 1/6
Bear for real from 1/7
TLT buy from 1/6/2016

Targeted TLT at 134 when it was at 125.
TLT target 134.42 from 1/13

Highlighted gold at the end of January and recommended to add in early February.
GLD posts 1/27 & 2/1

February
Started buying back stocks and oil 2/12.
INDU / DIA speculative buy from 2/12
Oil speculative buy or short cover 2/12

Recognized this as possible low of year. 

Spotted Brazil, Russia and EEM out-performance early in the move. All three, especially Brazil, continued out-performance into November. 
RSX & EWZ long ideas from 2/13

March
Turned back to bullish USA stocks 3/12.
"Bull alive and kicking" with INDU above 17138 from 3/12

Recommended Dow Industrials and Semi-conductors on the way up. Semi-conductors among best USA sectors to hold for most of the year. 
DIA and SOXX longs on the way up

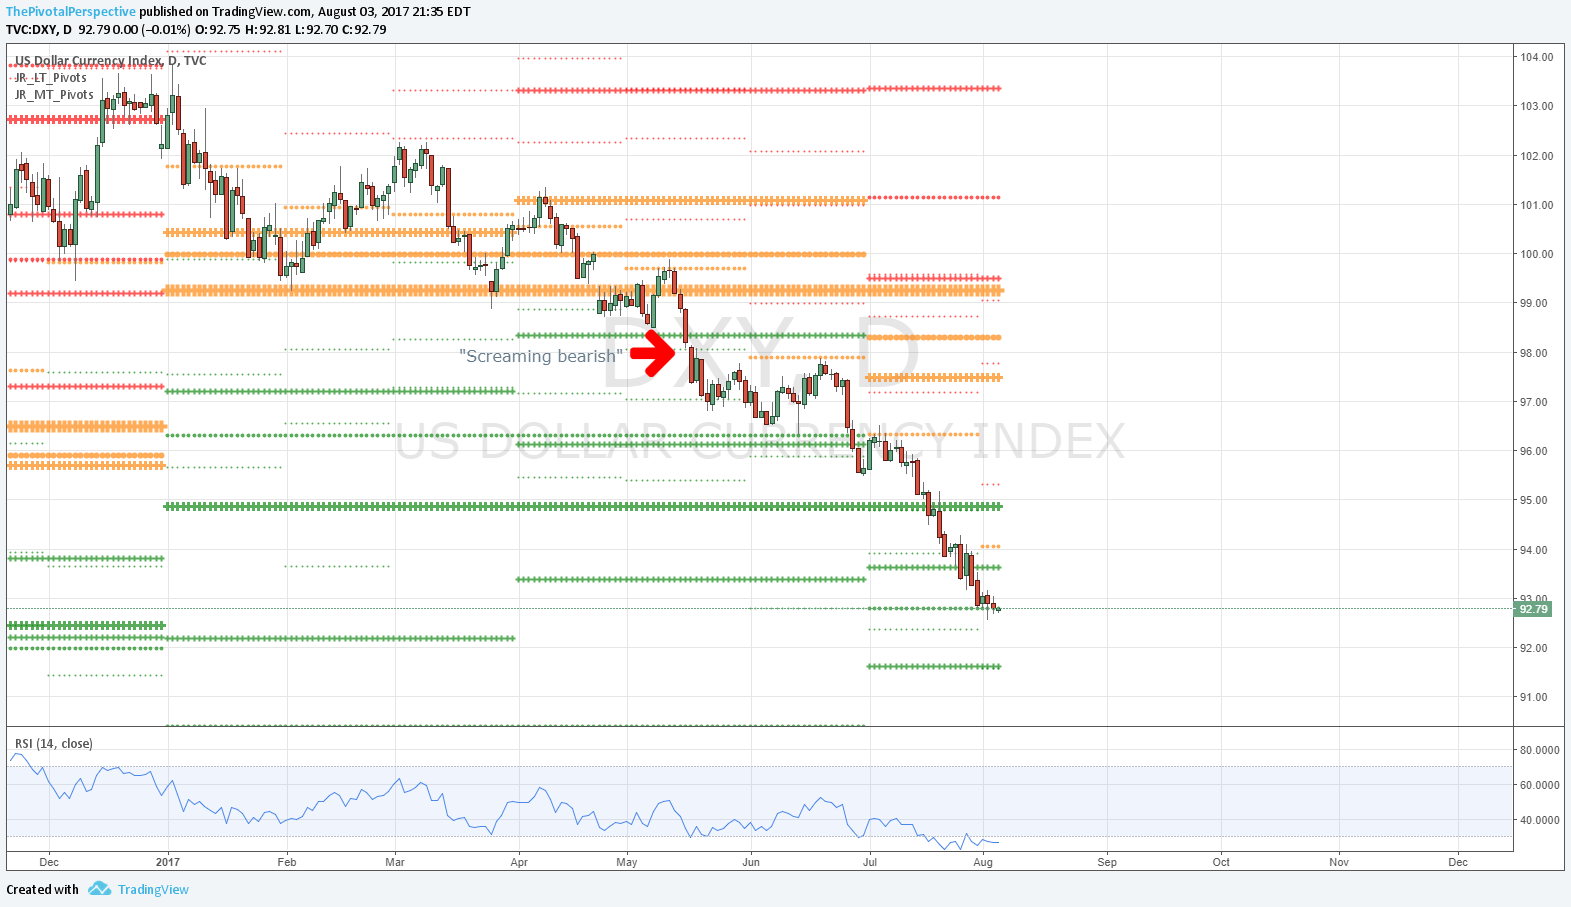
While being bearish $USD.
DXY weak from 3/16

April
Bullish USA stocks.
Bullish throughout April...

Until 4/19-20.
Top calls 4/19-20 and 5/1

May
Spotted 5/19 as decent pullback low. 

June
Bullish after Brexit.
Critical day 6/27, very bullish from there through early July.

July
Shorted bonds at the top! 
Bond short at the high!

This remains the only speculative (ie above pivots) non hedge short I have recommended on this site - ever.

August
Stayed long early August when several prominent names were all saying sell. 
"Long and strong" in August so far...

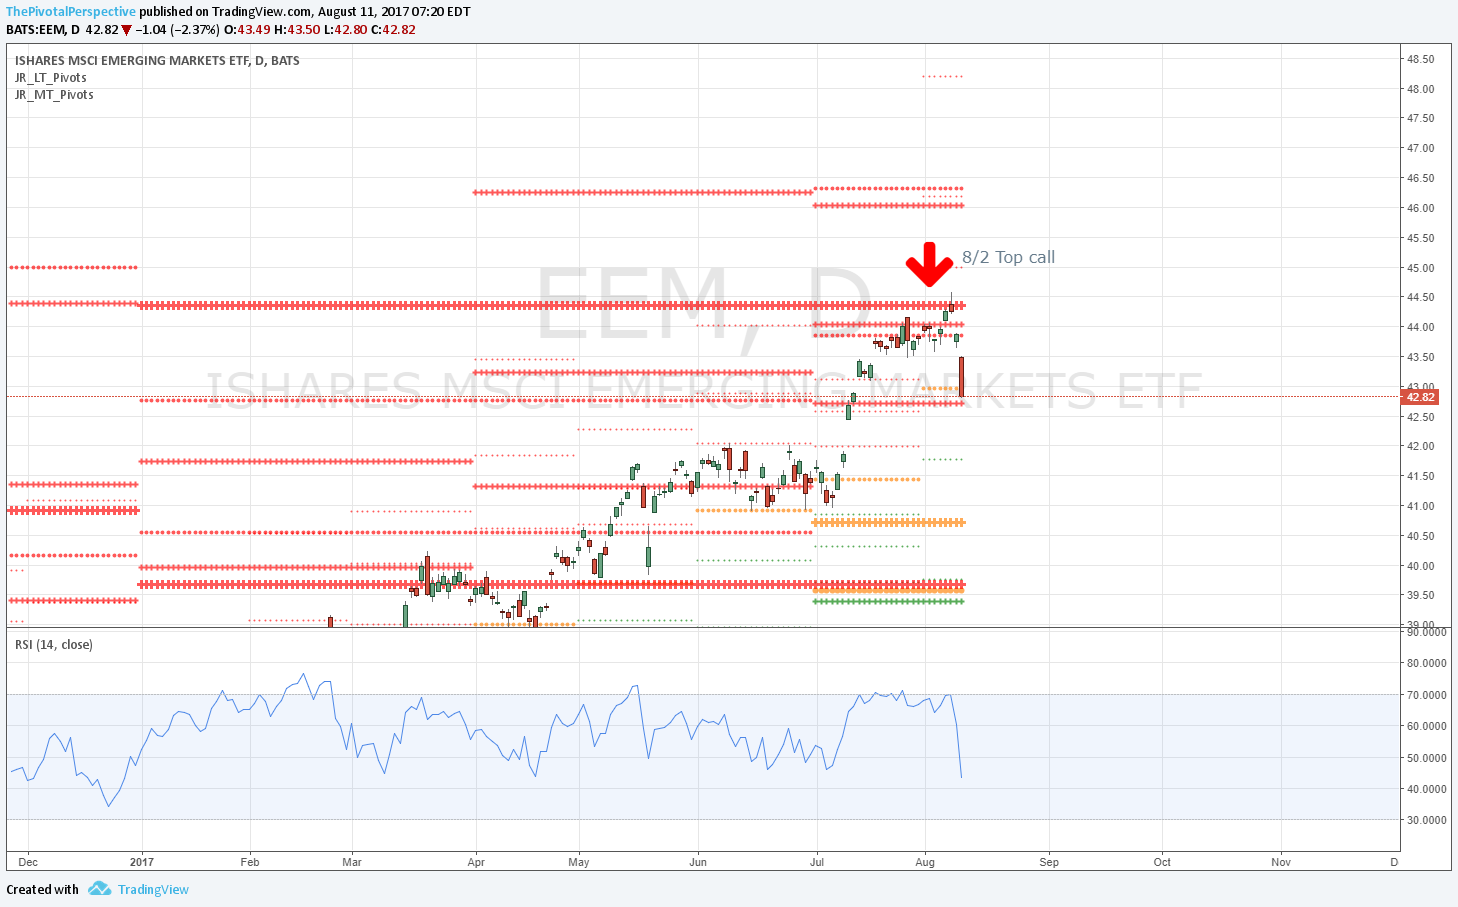
And added a top performing EEM early in the month. 
EEM long 8/3

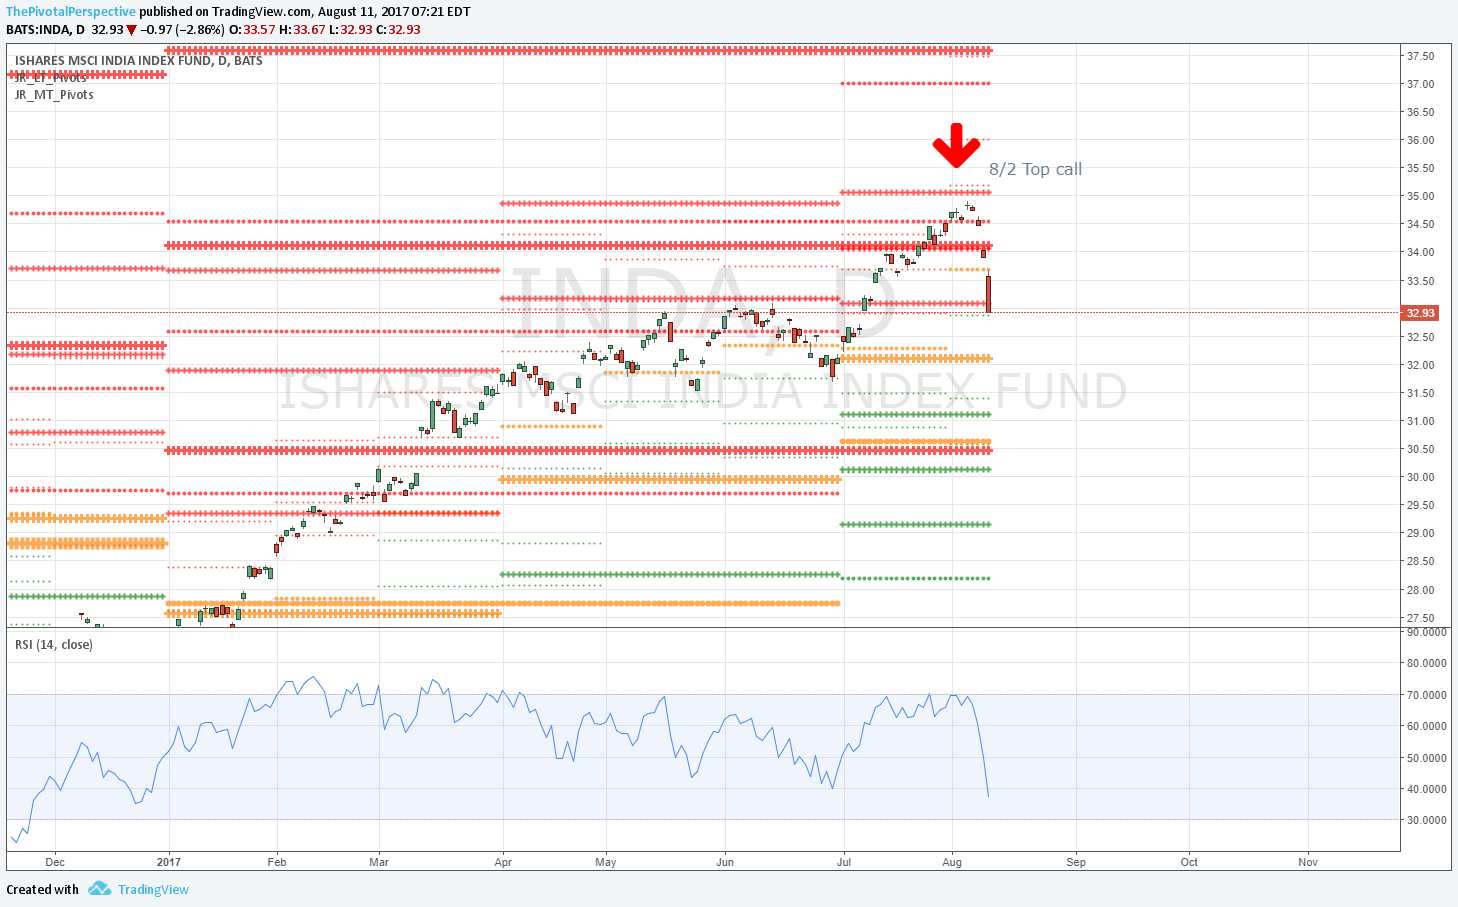
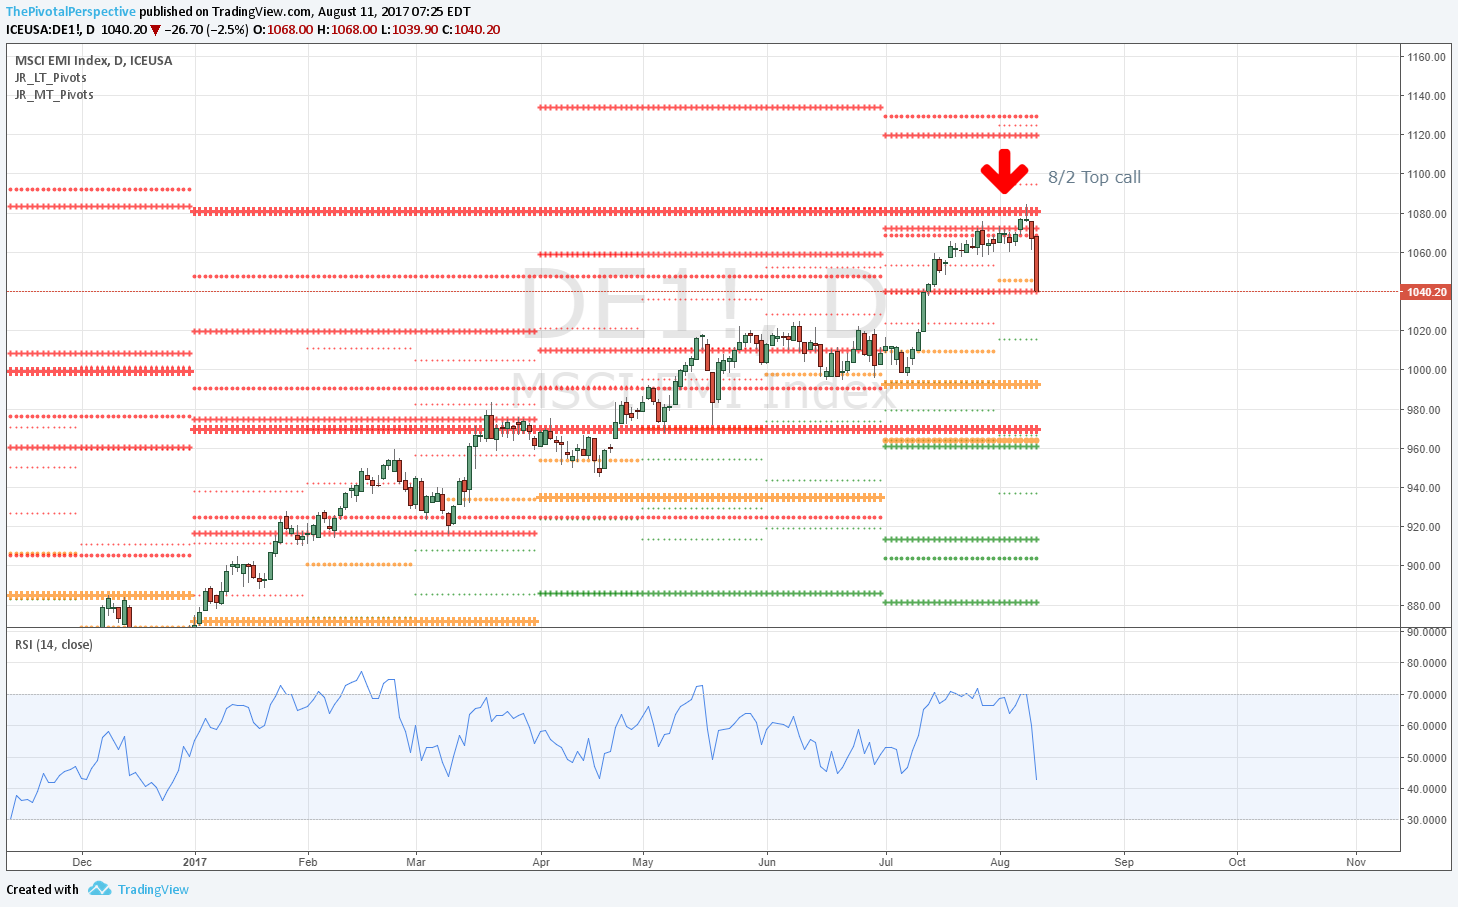
Until turning more cautious and saying upside limited later in August and early September.
Caution comments last several weeks!

Started thinking about a big jump in rates that would benefit financials - written with TNX at 1.57 (TNX currently about 100 bps higher, and XLF up more than 20% since then).
Big picture thoughts

September
Expected "stiff resistance" to hold 9/6 (market agreed with a 9/7 key high)

October
Was clearly bearish TLT and GLD early in October.
Not surprised at TLT and GLD slam

And massively bullish $USD.
Long both $USD and oil for Q4

While ducking out of the way of a stock pullback later in the month.
Caution alert 10/27, lifted 11/7

November
Was accumulating financials in October, specifically recommended early 11/5, and proclaimed new sector leader 11/9.
All over financials before the jump!

Clearly bullish USA stocks after the election, and continued bearish safe havens TLT and GLD.
Bullish comments from 11/9+

December
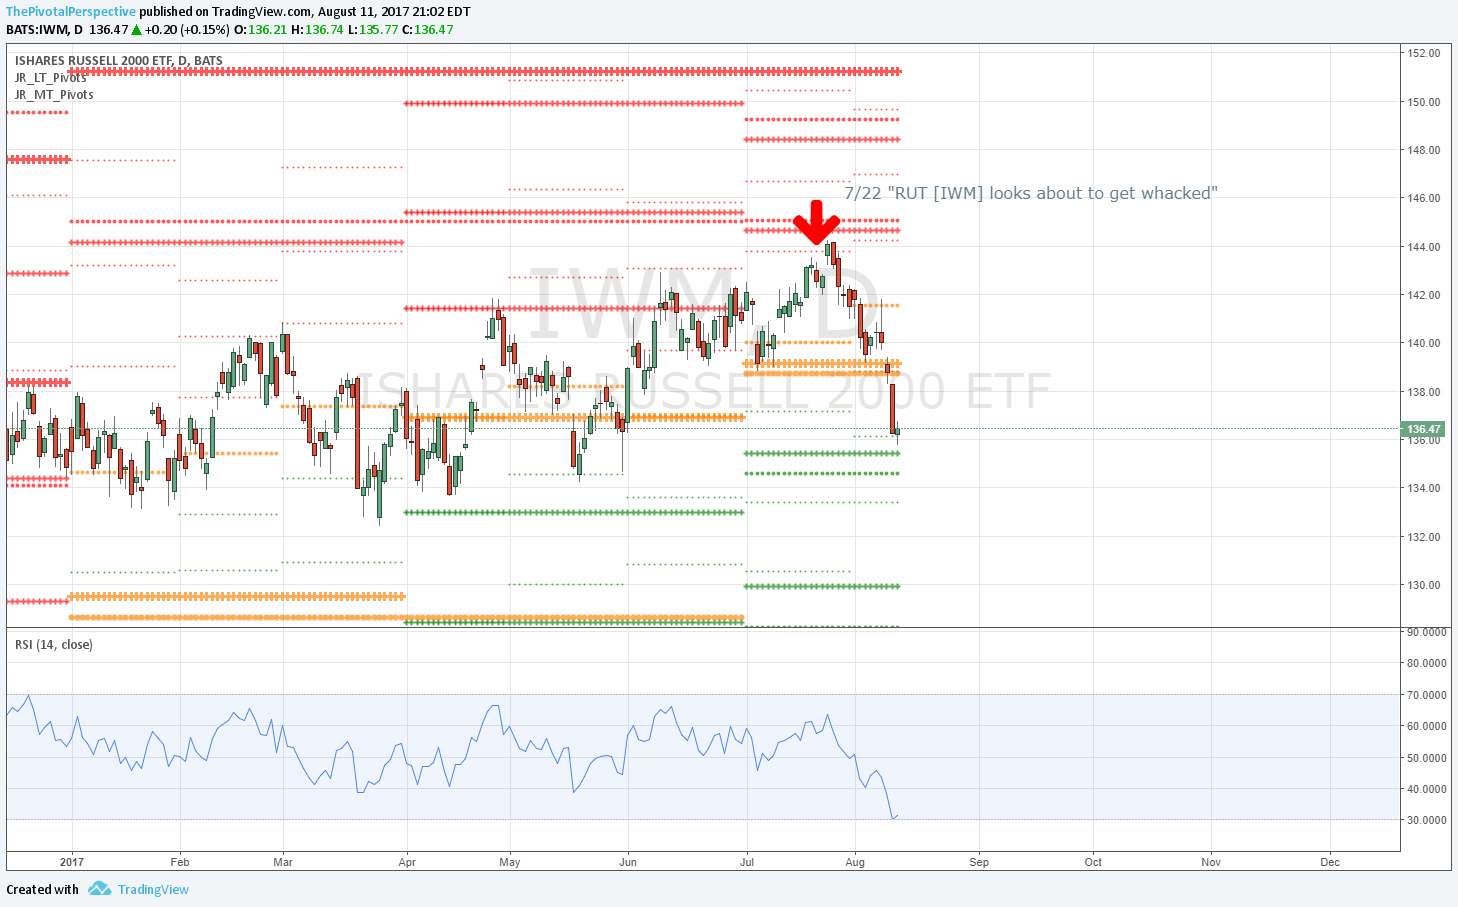
Suggested partial portfolio hedge right on RUT / IWM highs.
12/11 Total market view

And got the FXI short! (The only non-hedge short since 12/7)
Caught China short!


Caught China short!

12/11 Total market view: "FXI weekly chart still looks like it could easily drop."

12/12 Daily: "Positioning was 120% long (not counting currency & commodity trades) coming into the week, and per Total market view could have had a quick reduction of 3 hedges on IWM as suggested near open and 1 FXI short on close based on the Q4P, taking total longs to 80%. with a partial hedge & short of -40%."

12/13 Daily: Held despite bounce. "...if FXI is visibly above DecP tomorrow then out."

12/14 Daily: Doubled up short. "Per yesterday's note, if market reacted negatively from yearly levels I mentioned taking gains on DIA. If out 1 then 100% long and the shorts & hedges adjust to for 60% net long. Adding 1 FXI short with Q4P and DecP resistance, below all daily MAs except D200, for -50% short and maintaining 150% exposure."

12/19 Daily: "1 FXI short (taking gains from later entry)" Oops. 

IWM shorts were specifically recommended as a hedging trade to lock in equivalent number of earlier longs while not missing out on further upside (because buy stop above YR2 would take off hedge). FXI only short specifically recommended since 12/7. 

Bullish comments from 11/9+

Actually, caution alert issued 10/27 was lifted 11/7 (see previous featured post) and from there I was recommending more longs (or lifting of hedges). 

11/9 SPY Daily: "So, DIA started fractionally below the Q4P and jumped above in the first 15 minutes. VIX started a bit above 2HP and collapsed all day. The Pivotal Perspective is clear. We don't know what will happen tomorrow, but for now, the markets are quite fine. (I suggest keeping an eye on VIX Q4P from here.) ... Sectors of note: XLF/IYF new market sector leaders; XBI/IBB massive jump. EEM/FXI noticeably weaker however, both under Q4Ps as all 5 USA mains held or recovered."

11/12 Winners and losers post on the blog: "We are trying to catch the winners, hold those, then take some gains and rotate into other winners. ... We avoid the losers, or hedge, or short. Strongest: DIA - above all pivots, above YR1; IWM - above all pivots, above YR1; SOXX/SMH - continuing strong above all pivots, above YR1, above 2HR2.

11/12 Monthly charts: "In general, stock indexes look quite healthy led by INDU on the main indexes, then RUT; and XLF on the sectors. Safe havens GLD and TLT are dropping hard."

11/13 Total market view: "4 of 5 USA mains are above all pivots (QQQ lagging, below NovP). 2 of those have cleared YR1s, which were resistance from August on. At the same time, safe havens TLT and GLD are collapsing while both VIX and XIV have said all clear from 11/7 on. This is all very bullish and must be respected no matter what you think of upcoming politics. ... USA indexes look great, most especially DIA and IWM among mains, and XLF/IYF financials among sectors. Safe havens look terrible. This is very bullish action for USA stocks."

11/14 SPY Daily: "Though QQQ broke Q4P slightly, everything else still looks quite bullish. SPY mild pause from YR1, but cannot say rejection when NovR1 holds as support. Safe havens especially all saying risk on: TLT and GLD both broke Q4S3s, VIX below all pivots, XIV above all pivots. Oh yeah, financials, small-caps and biotech continue melt-up."

11/15 SPY Daily: "The Pivotal Perspective is quite bullish today, because several key levels acted as support on the USA main indexes. ... Ding! 5 of USA mains (I count VTI & NYA together as one) have bullish action on key levels. Safe havens TLT could not bounce above Q4S3, and VIX & XIV stay very constructive for the market. Perhaps tomorrow will be different but right now long and strong stocks is the right view." 

11/16 SPY Daily: "...USA main indexes are quite fine today without much change from yesterday. No rejection from resistance, and the weak link Tech / QQQ continues to play catch up. SPY could have closed below the YR1 but didn't. Bulls still have the ball."

11/17 SPY Daily: "Trump honeymoon continues with everything positive for USA stock indexes. SPY looks to be lifting from YR1 which is very bullish. It has run into Nov R2, but no sign of resistance thus far. In addition, all safe havens (TLT, GLD, VIX, XIV) bullish for risk assets."

11/18 SPY Daily: "Overall action was mixed... If we allow VIX & XIV to settle the issue, then bulls still have the ball and this is more likely a pause that start of a big drop."

11/21 SPY Daily: "Amazing TrumpIt rally continues. SPY soaring above NovR2, DIA above 2HR1, QQQ above all pivots, and safe havens TLT and GLD continue to look weak. Despite my expectation of some digestion after the initial push of election week, markets just keep going up."

11/22 SPY Daily: "SPX set is already approaching the next major target area of 2HR1 2209, SPY 220.99 and ES1 2205 after clearing YR1s at 2163 / 217.63 / 2169 respectively. Despite the run up, we are not seeing signs of euphoria, and other USA main indexes are not on major resistance. This means the most likely scenario is tag of level, then higher or digestion." 

11/23 SPY Daily: "Markets continue to power up. SPY approaching key resistance and RSI near overbought, but without other signs of euphoria."

11/25 SPY Daily: "Still powering up. The charts I pointed out on Wednesday - SPY, IWM and XIV - are still in resistance areas, yet with no sign of pause or rejection."

Disclosure: Total market view of 11/20 not quite bullish enough!

Caution alert 10/27, lifted 11/7, markets fine 11/9 (except EEM)

10/27 Daily SPY comment: "Official trouble alert today, with SPY clear rejection from Q4P and VIX confirming risk above its Q4P."

11/6 Total market view: "Bottom line - Trouble alert from 10/27 was quite correct. The conditions to lift that trouble alert will be a VIX rejection of a pivot with clear move below the level. Right now VIX is above its 2HP and not yet at its higher YP. Either we need to see a move below 2HP, or higher to YP and rejection from there. Still I think it is better to be cautious with any long attempts with VIX above 2HP.

I will start sounding more bullish on the market when we see Tech set recover above its Q4P (QQQ 114.83), RUT set recover its YP (IWM 116.23), NYA above its YP (10302), and then SPX above Q4S1, VTI above Q4S1, all with VIX and XIV constructive for risk. Until then, cash on sidelines is quite fine."

11/7 Daily SPY comment: "Everyone back in the pool! 

Amazingly, not even the pros could get in (unless catching the falling knife last Thursday-Friday) with a monster gap even in globex. Everything checks out - Tech jumped above its Q4P, RUT/IWM back above YP, NYA huge jump above its YP; SPX & VTI above Q4S1, and DIA amazingly above all pivots! VIX confirmed with decent looking reversal bar below the 2HP, and XIV had huge hold of YP as well."

11/9 Daily SPY comment: "So, DIA started fractionally below the Q4P and jumped above in the first 15 minutes. VIX started a bit above 2HP and collapsed all day. The Pivotal Perspective is clear. We don't know what will happen tomorrow, but for now, the markets are quite fine. (I suggest keeping an eye on VIX Q4P from here.)

SPY above all pivots (YR1 level to watch)
QQQ fractionally above all pivots
DIA above all pivots and on verge of new highs
IWM above all pivots
VTI above all pivots (NYA bang on Q4P)

VIX collapse from 2HP and below all pivots
XIV above all pivots

Sectors of note: XLF/IYF new market sector leaders; XBI/IBB massive jump. EEM/FXI noticeably weaker however, both under Q4Ps as all 5 USA mains held or recovered."


All over financials before the jump!

As far back as mid August in Big picture thoughts: "So far my top call on TLT is still holding. I'm not totally certain that it does, but with TLT below the AugP then hold your shorts if you took that trade. Regardless, if TLT can rally again, then I think this will be a *very* key high. It might be higher, perhaps a double top, maybe lower; but after this, I will be quite bearish TLT and bullish rates. I am basing this opinion on the Bollinger band and RSI action on TLT across timeframes, some timing work, and the aforementioned perspective on government intervention in markets." 

And "So the translation of my historical and vaguely psychological references is this: maybe interest rates start to rise, and this is initially welcomed. Financials would rally, and money would come out of bonds into stocks. This will be enough to lift SPX into my ideal target zone of 2250-2500 from 2017 Q2 to 2018 Q2."

10/28 - Is Deustche Bank a good buy?: "Better financial buy: XLF. Holding up very well on drop, above all daily moving averages, and one of the few things still above all pivots (monthly, quarterly, half-yearly, yearly). Often what holds up best in drop is next market leader."

"Compare all this [DB] to XLF, one of the few things holding up the best in market weakness from August - September."

"[XLF] Above yearly, half-year, quarterly and monthly pivots. There are only a few asset classes with this status right now. May not take out highs in current range bound environment into election but I like this chart here and would look to accumulate. Hold above Q4P means about -5% risk for the position at 10/27 close price."

11/5 On entries: "XLF also a current leader, just a shade under NovP and entirely above Q4P this quarter. Not many assets in that category at this point. Needs to lift back above NovP and 50MA 20MA combo which would like turn MACD back positive; or drop lower near Q4P. 

IYF Financial ETF also decent so far with just a fractional move below Q4P, doing much better than other leaders like QQQ, EEM and FXI all of which had bigger moves under Q4P. Financials may take a hit if rates move the other way but for now holding up quite well."

These two were the only things I selected as potential new entry setups last weekend!

11/9 SPY Daily: "Sectors of note: XLF/IYF new market sector leaders; XBI/IBB massive jump. EEM/FXI noticeably weaker."

Long both $USD and oil for Q4

Not too many strategists would do this kind of thing, especially within the same week. The Pivotal Perspective did and was right on both. 

$USD
I don't have the time these days to spend much time on currencies but when I was a strategist at a small hedge fund it was part of my routine. Pivots work on these too. 

Overall I've been bearish on $USD this year for the simple fact of rally attempts fading back under the YP and rejections, and was still somewhat skeptical of strength per this post on 8/27.

Then I changed my tune and recommended a long on 9/17. Right idea, but I wasn't thorough and didn't check the MAs, and stop idea was too tight. Sorry about that. The same parameters were met for a long on 10/4 as well, FWIW.

Then on 10/6 I wrote up a totally bullish post on $USD - no ifs or buts.

"Anyway, my main point here is that just because $USD has been sideways since 3/2015 doesn't mean the rally is over. It is entirely possible that DXY breaks out above in months to come and this could, along with rising interest rates, be the next big move in markets. This would probably put a lid on USA indexes, even if rising interest rates support financials."

"DXY Q - This is really very bullish, weak selling above a sharply rising 10MA and next move has been the easy spot UP."

"DXY M - Recent small red bar on this chart too, and right now launching above the 10MA and 20MA. Head and shoulders fans (I'm not really one of them) will watch 96-100 for a possible top, but I'm thinking higher."

"DXY W - It is hard to imagine a more bullish working off of extreme overbought conditions. Test of high, drop to low of range, rising 100MA holds massively, builds higher lows, and after another small red bar (those are great to watch for on the long side!) another blast off and above all moving averages." 

Oil
10/1 Total market view wrote about bullish charts for oil three different times. 

"In addition, oil looks very interesting here showing 2 different signs of long term strength we have not seen in quite some time: the first close above monthly 10MA since July 2014, and the 2nd try above a long term pivot, also since July 2014. Oil strength will support the market."

"Watch oil, because the last time we started to see long term strength after a big drop that was on GLD in late January."

"Oil the story, with USO lifting above its 2HP for the second time this year. To put this in context, USO has only had 3 closes above a long term pivot since July 2014 and one of these two was last week."

ps: If you are thinking this buy looking late, I caught the low of the year on a speculative buy here. 

Not surprised at TLT and GLD slam

9/29 Quarter end approaches special blog post: "Often but not always there are definitive moves near the end of a quarter or beginning of another as big institutions adjust their allocations."

10/1 Safe havens TLT weekly chart comment: "Held 2HP on recent low, but weekly chart with wick vulnerable to drop."

10/1 Quarterly and monthly charts special blog post on GLD monthly chart: "This looks more threatening with falling 50MA (purple) acting as resistance."

10/1 Total market view: "in general long term charts look bullish for USA stocks and a bit more negative for the safe havens TLT and GLD."

10/1 Total market view: "Bottom line - We'll have new Q4Ps and OctPs on Monday, and it will be easy to see what is above all pivots, what isn't, then what holds and what breaks."

10/3 SPY daily: "TLT clear drop below Q4P and broke OctP, bearish. GLD below a QP for the first time since January."