USA main indexes

Sum
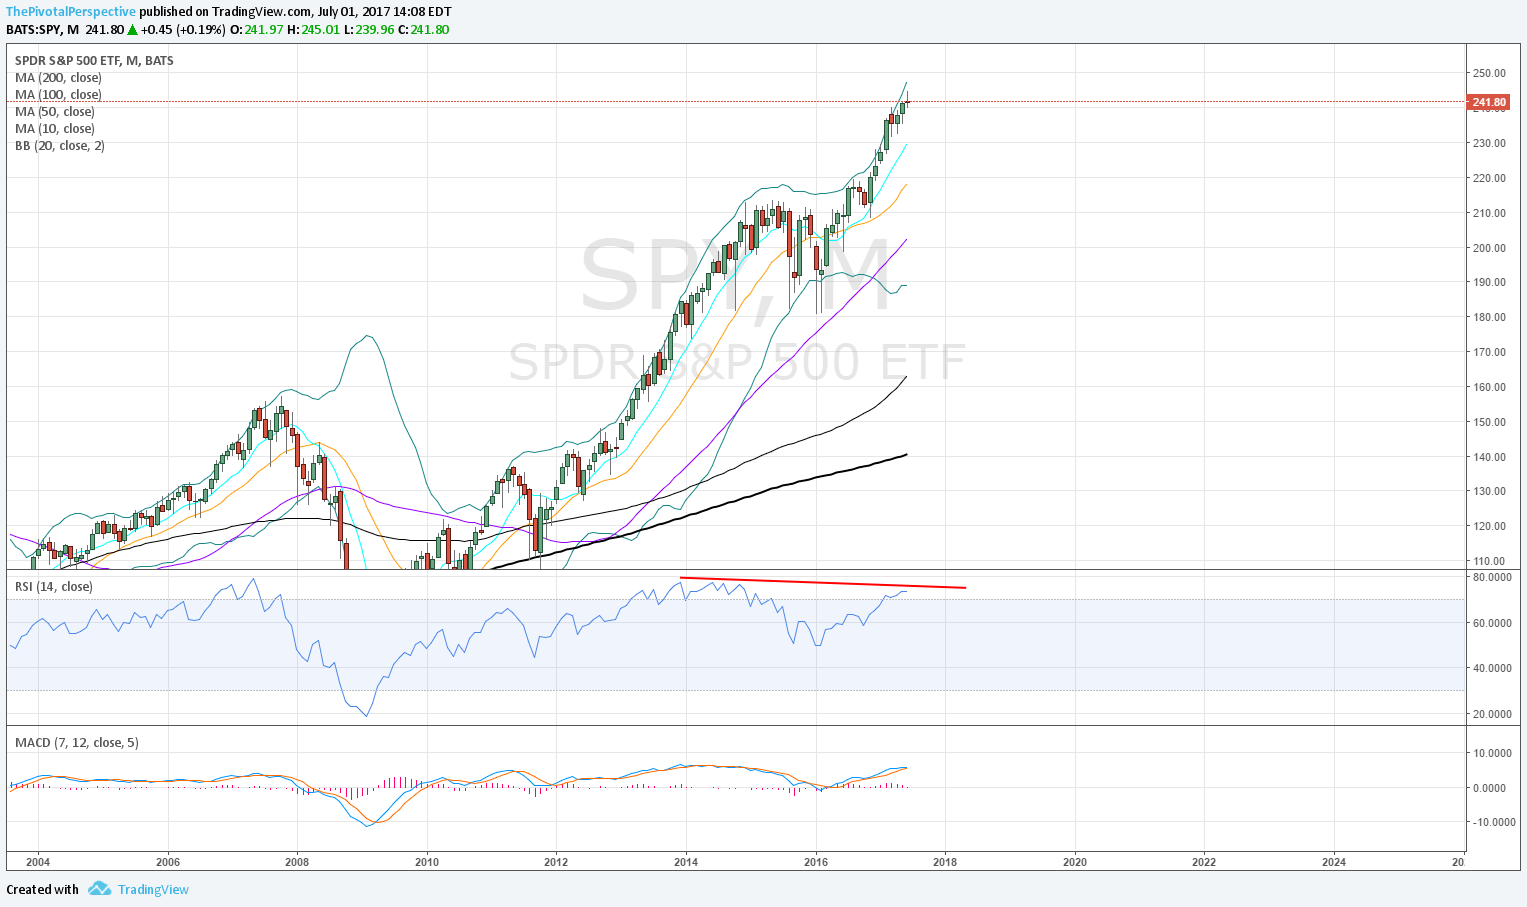
The last few weeks I've been very clear - as SPX just held major support I thought it would make a run to major resistance and so I've been pointing to 2820-30 (QR1 actually 2822) since. Last week reached 2816. Was that it? 

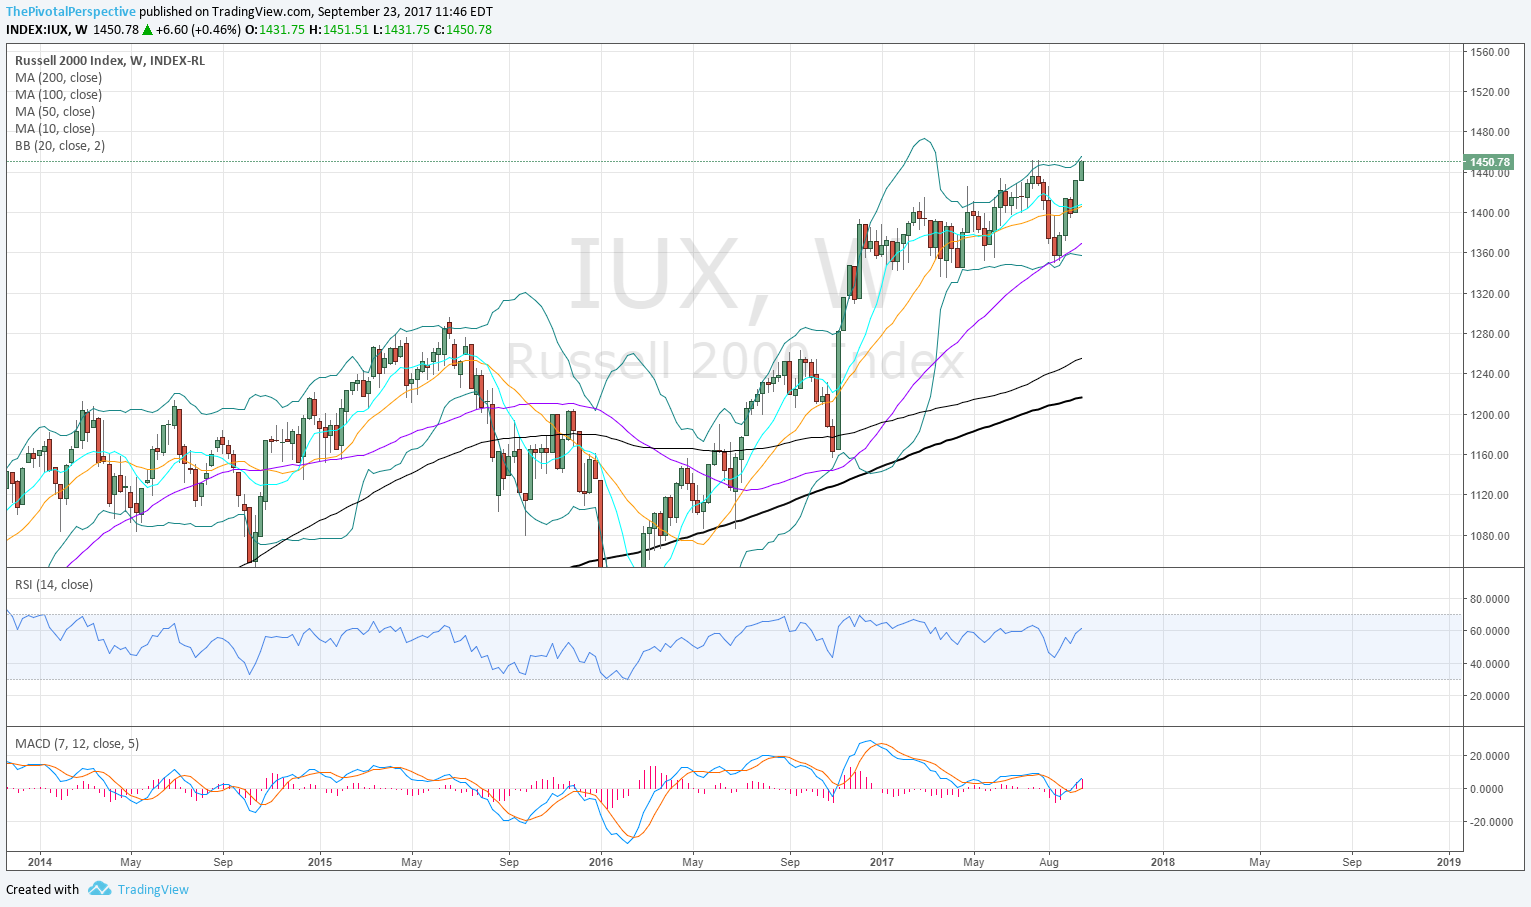
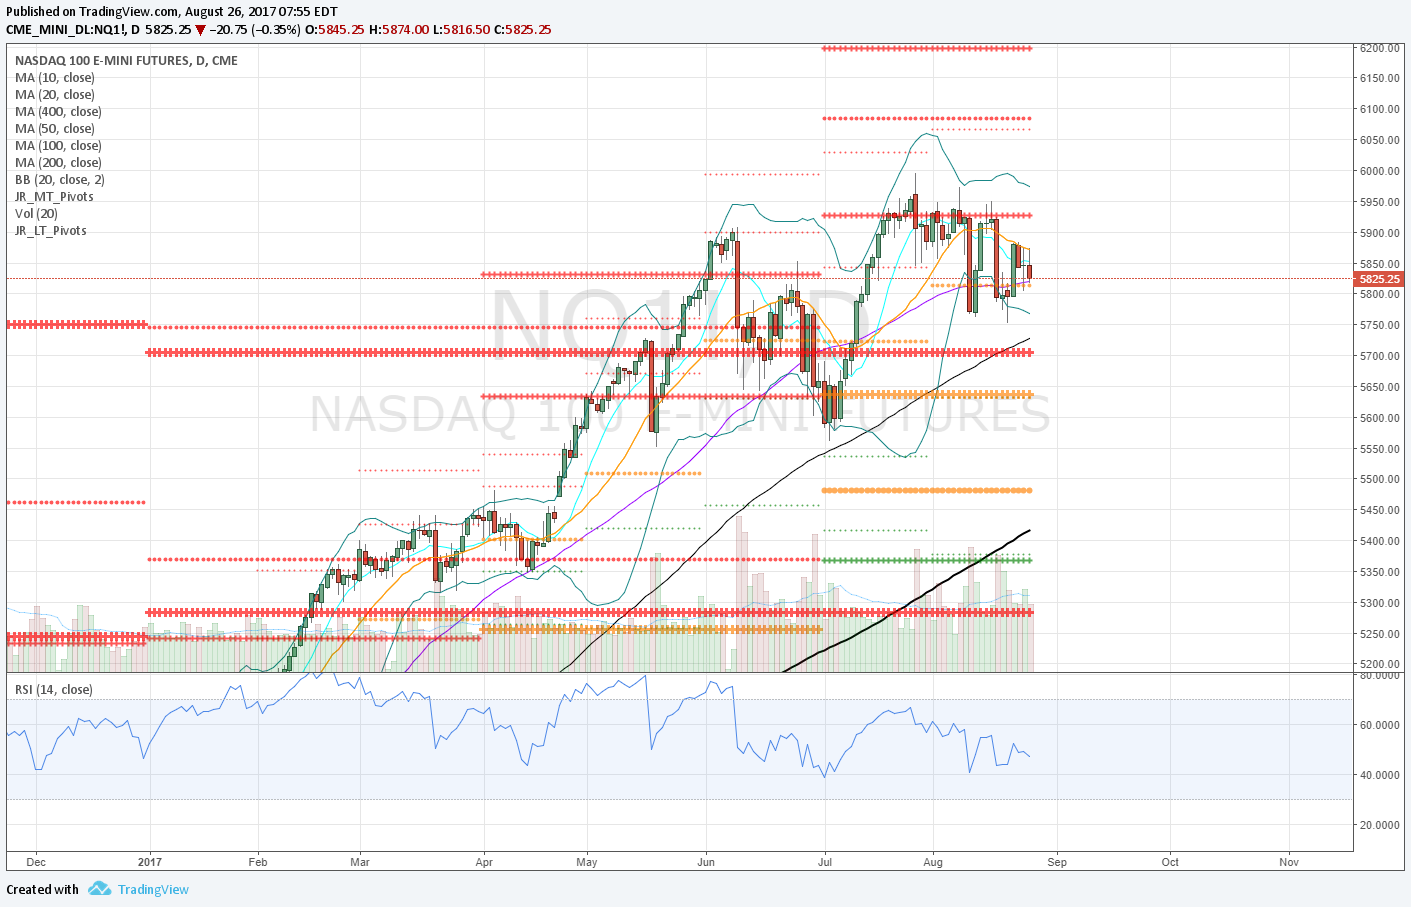
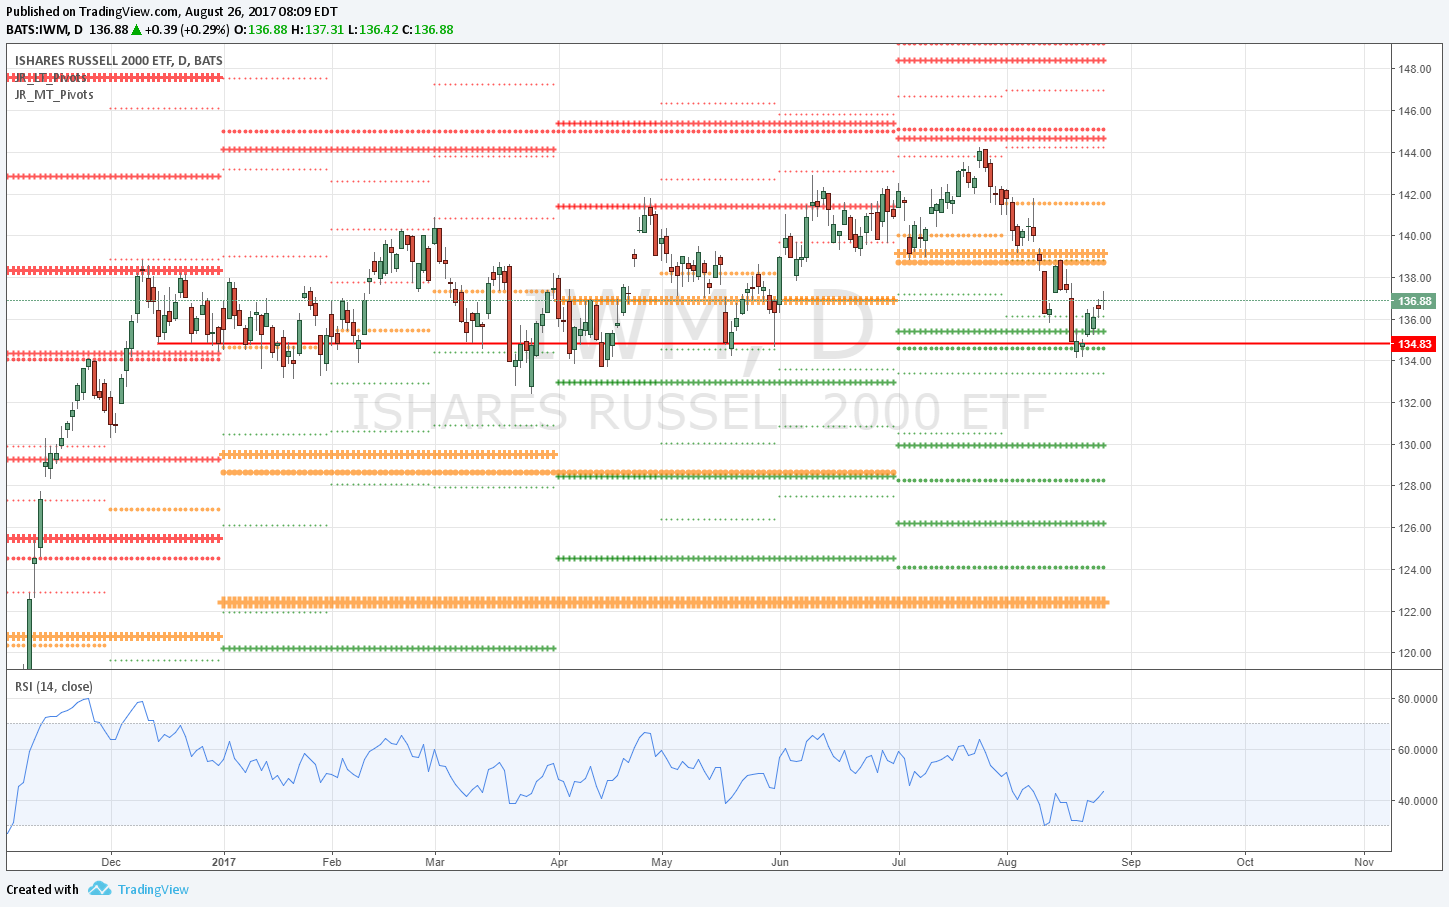
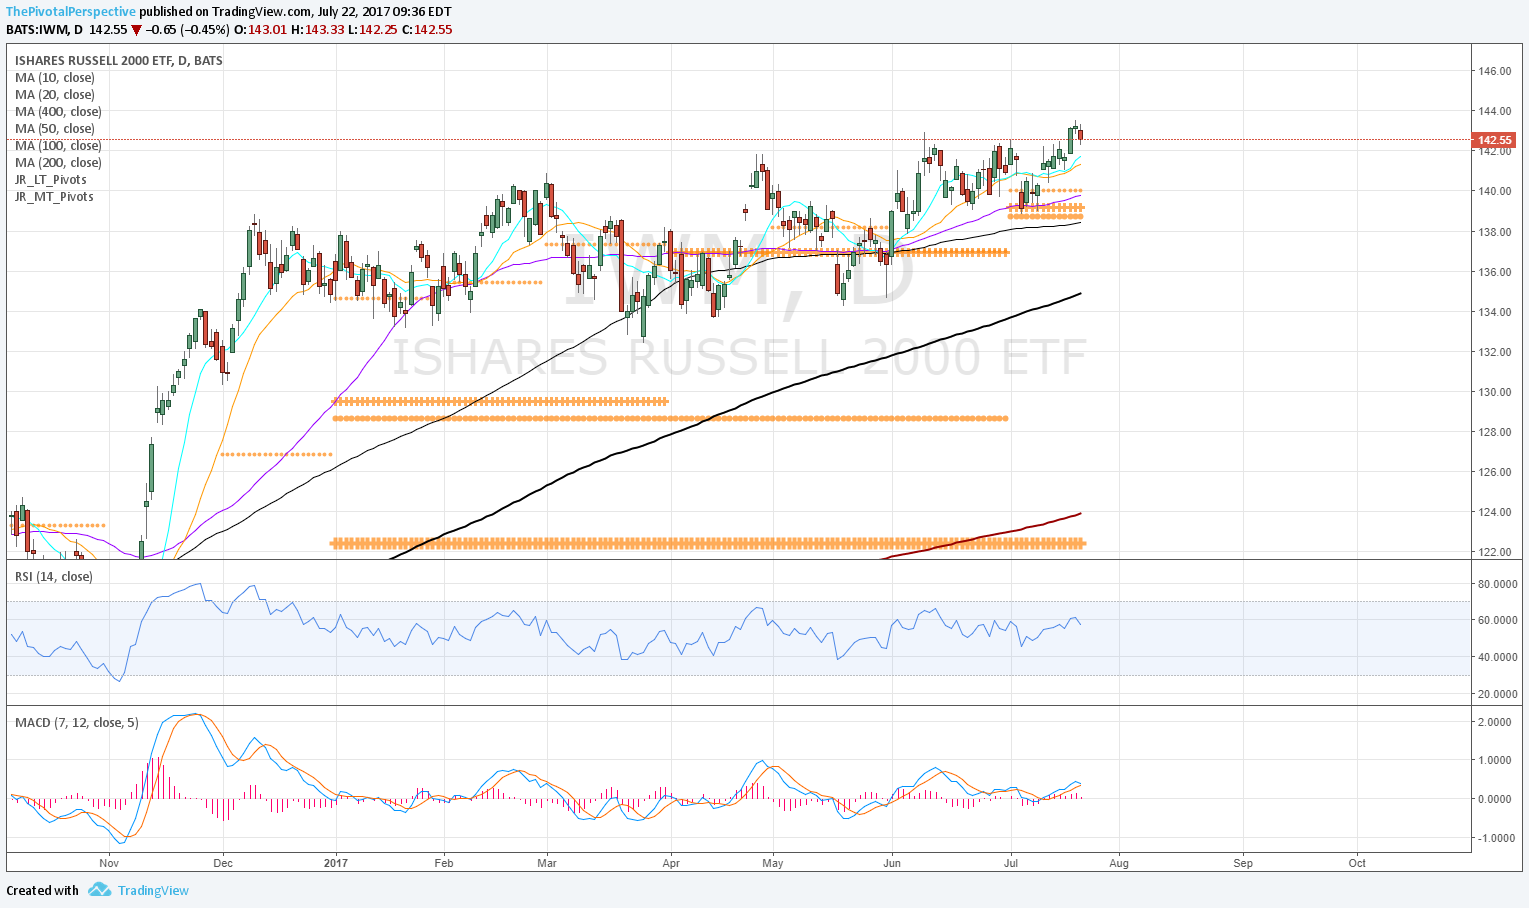
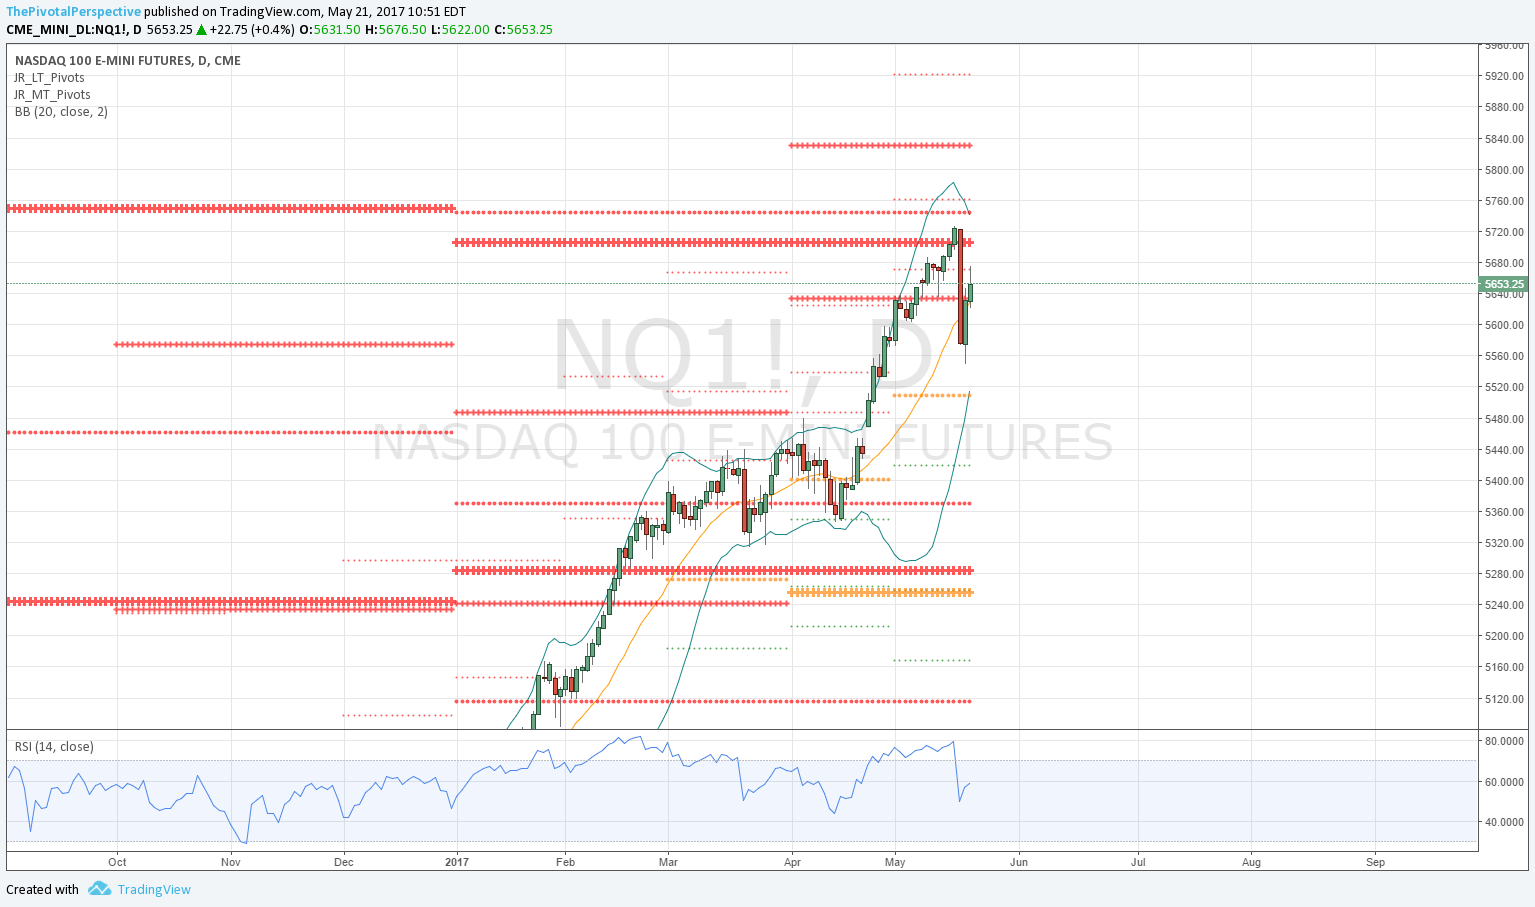
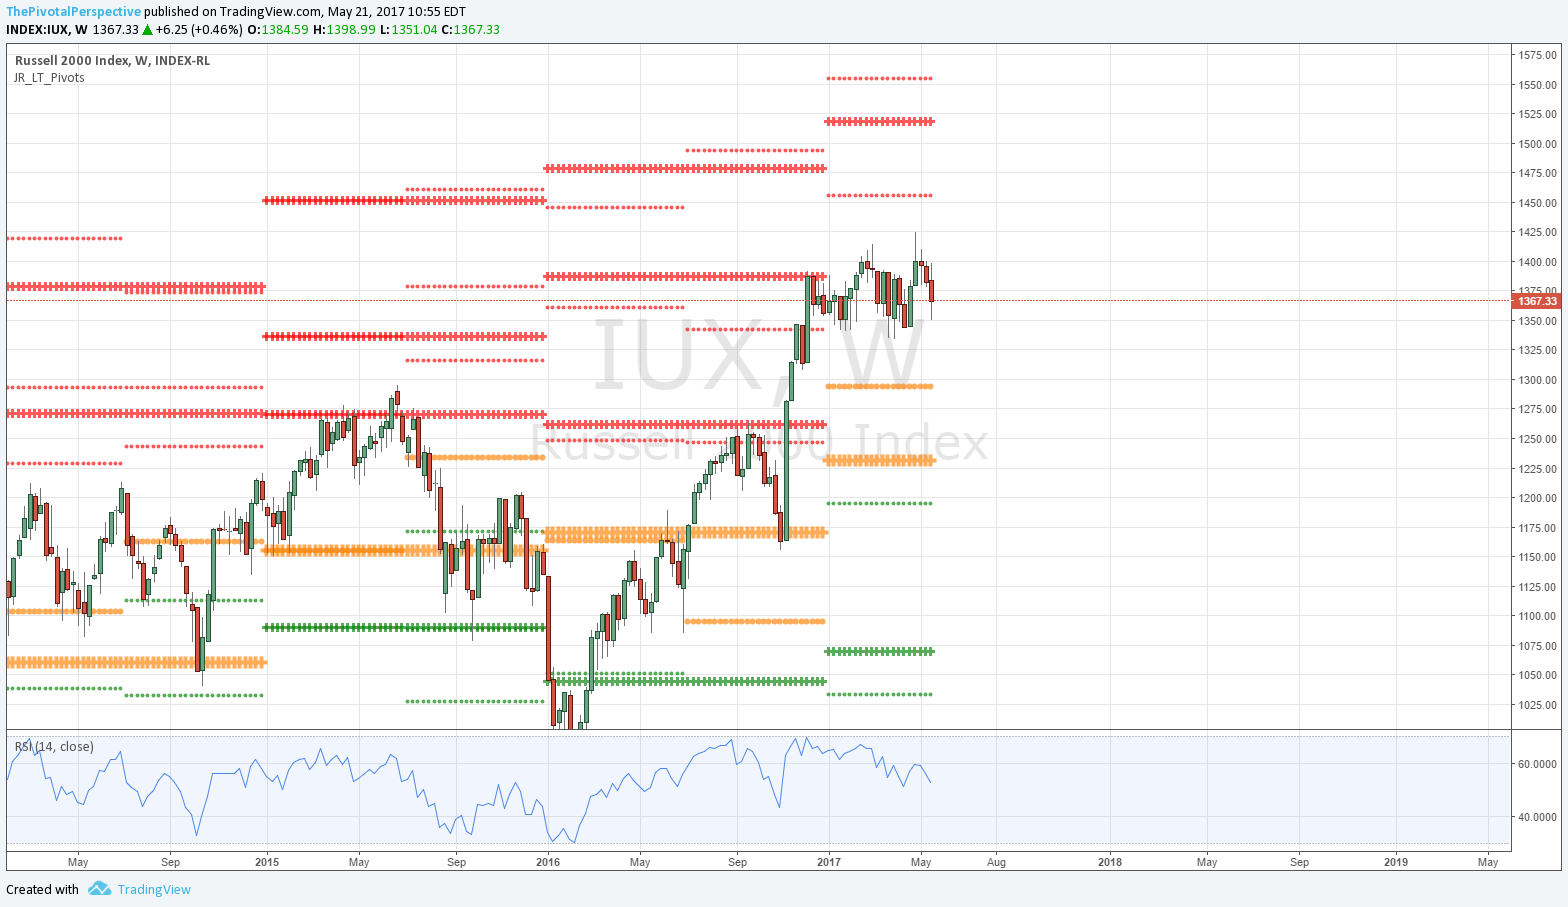
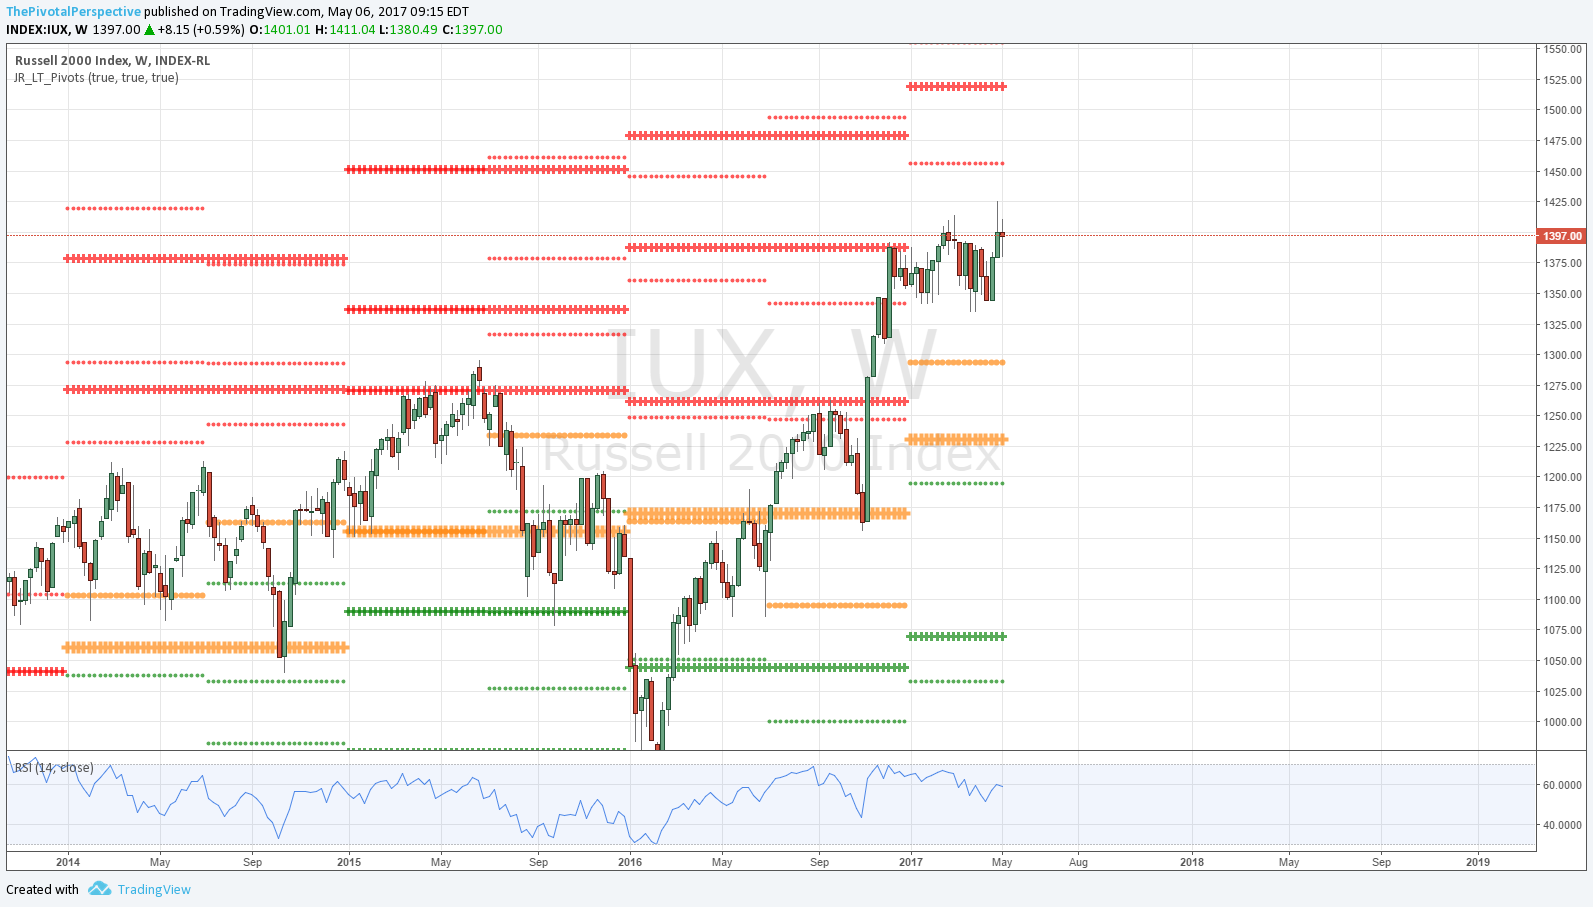
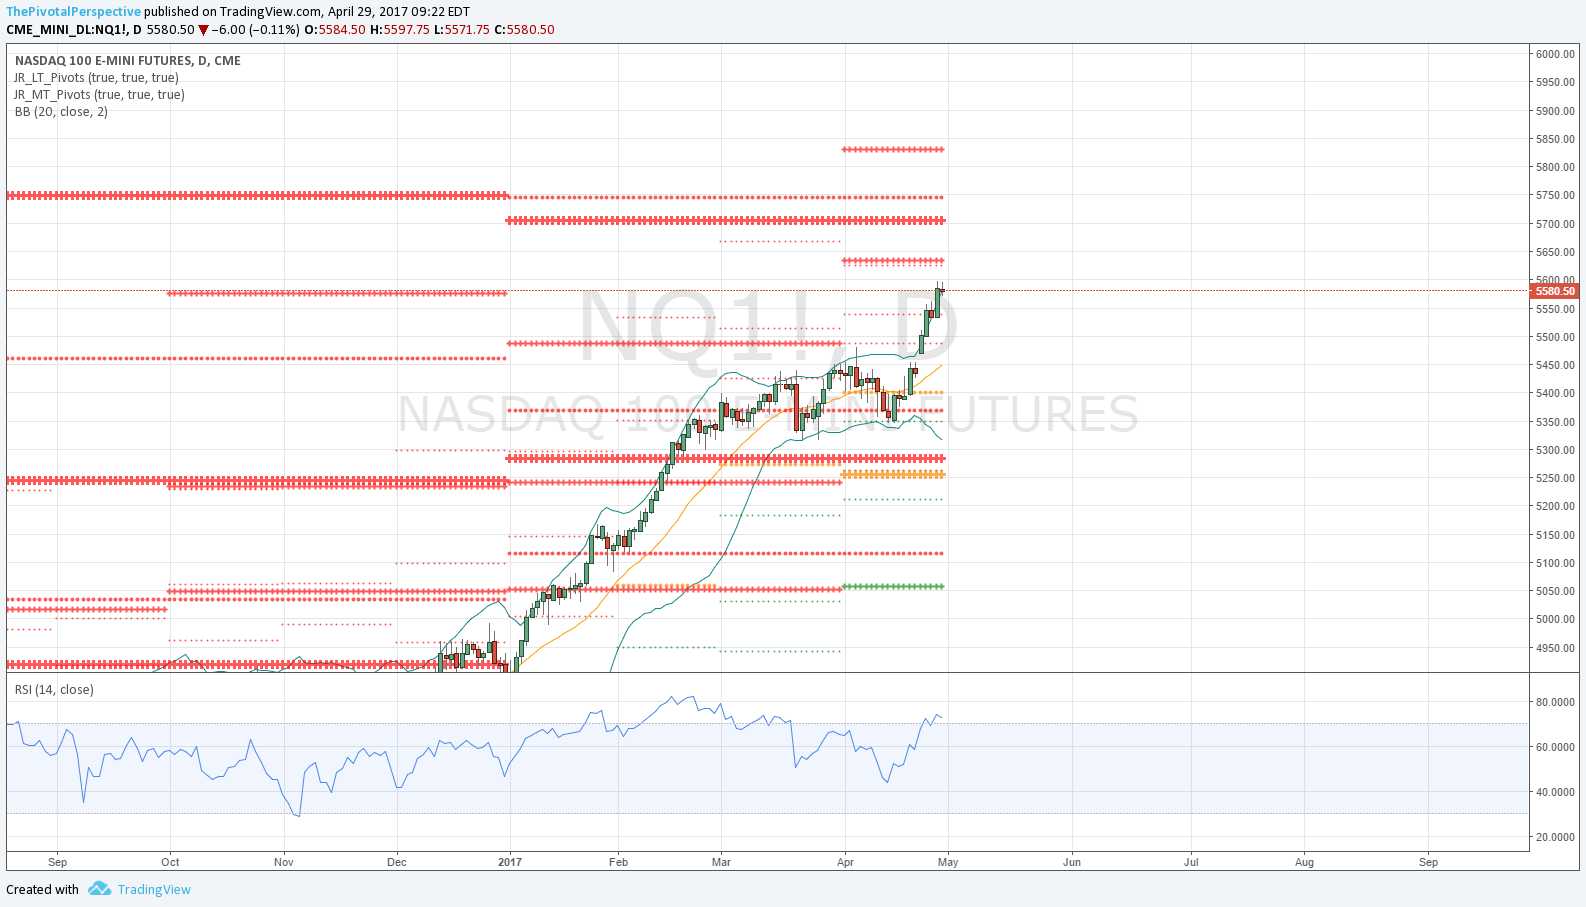
Similarly, NDX not quite at target area QR1 HR1 YR2, but still could power up to test those levels. RUT testing YR2 for the 3rd time this year and so far with the least damage. 

Bullish scenario will be SPX and NDX up to target areas with RUT above YR2. This will be more likely to play out if above WPs next week. 

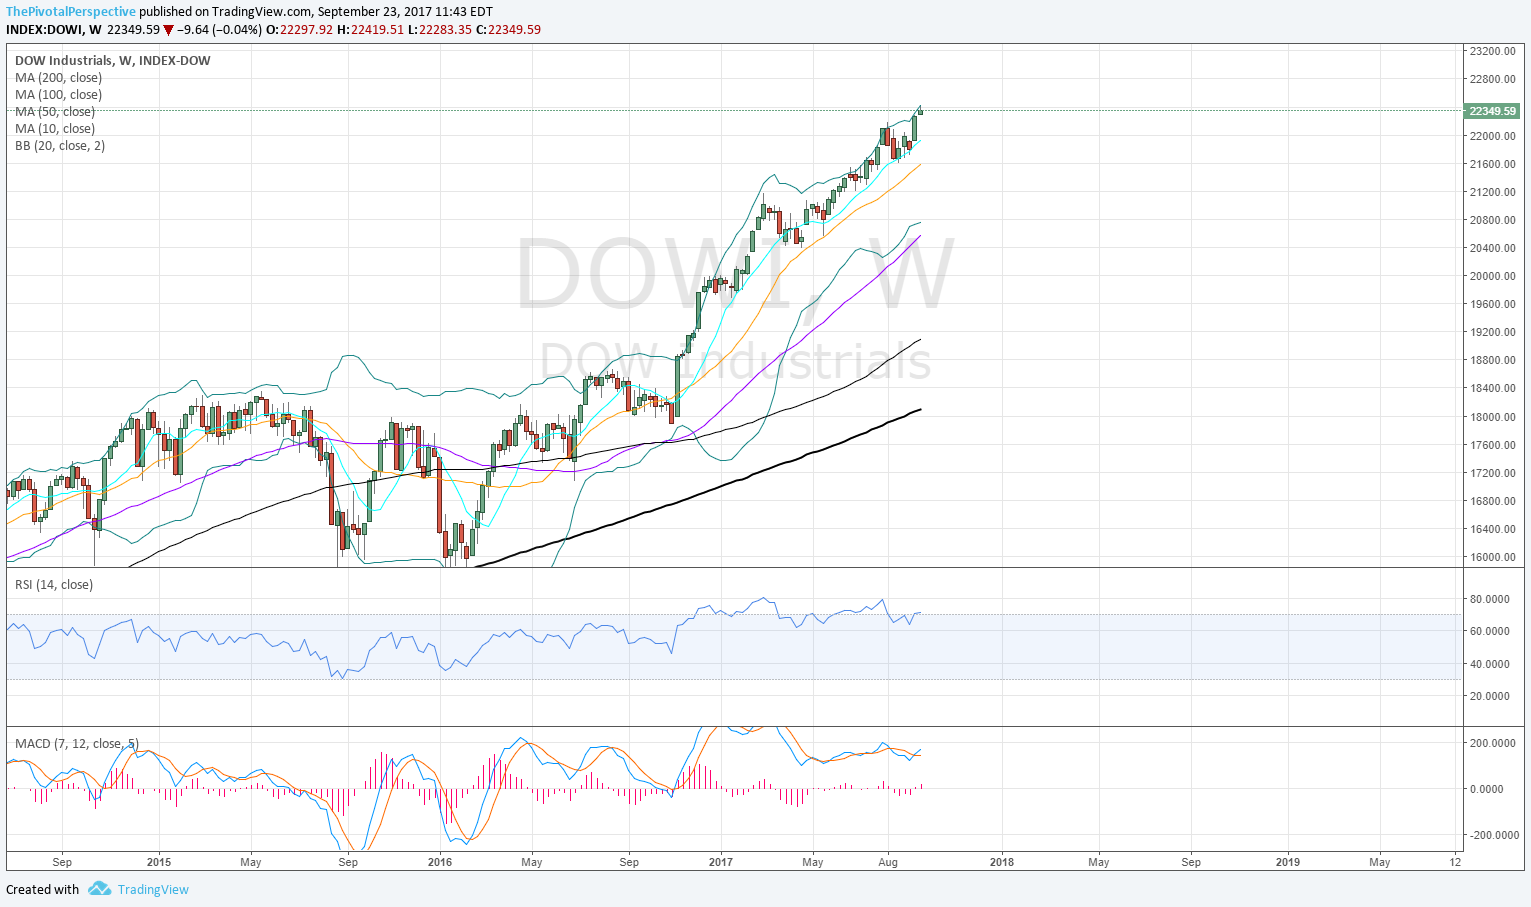
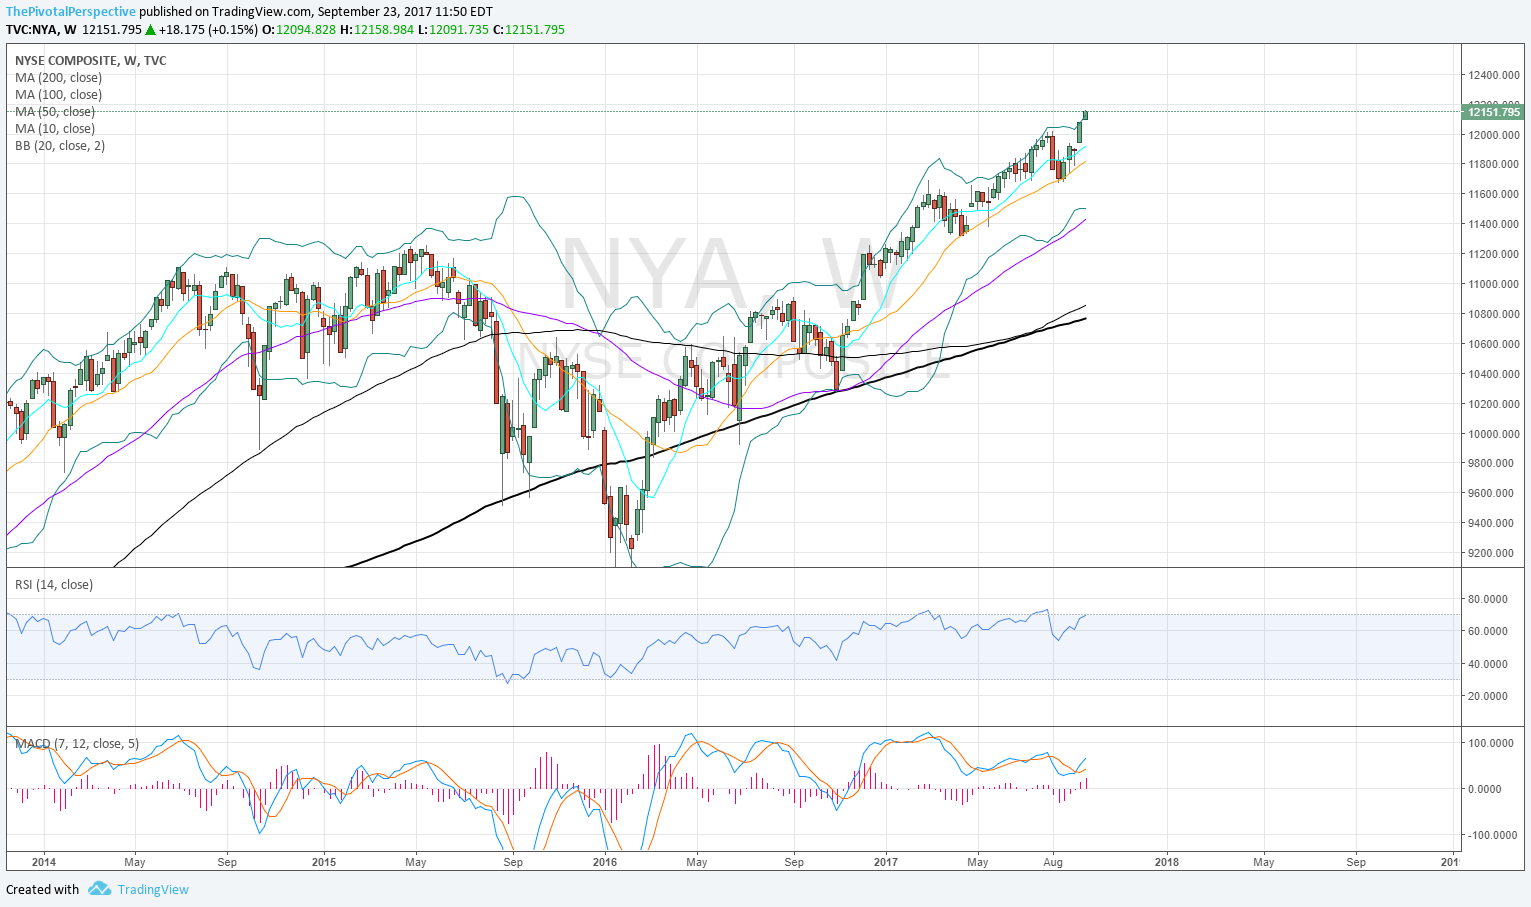
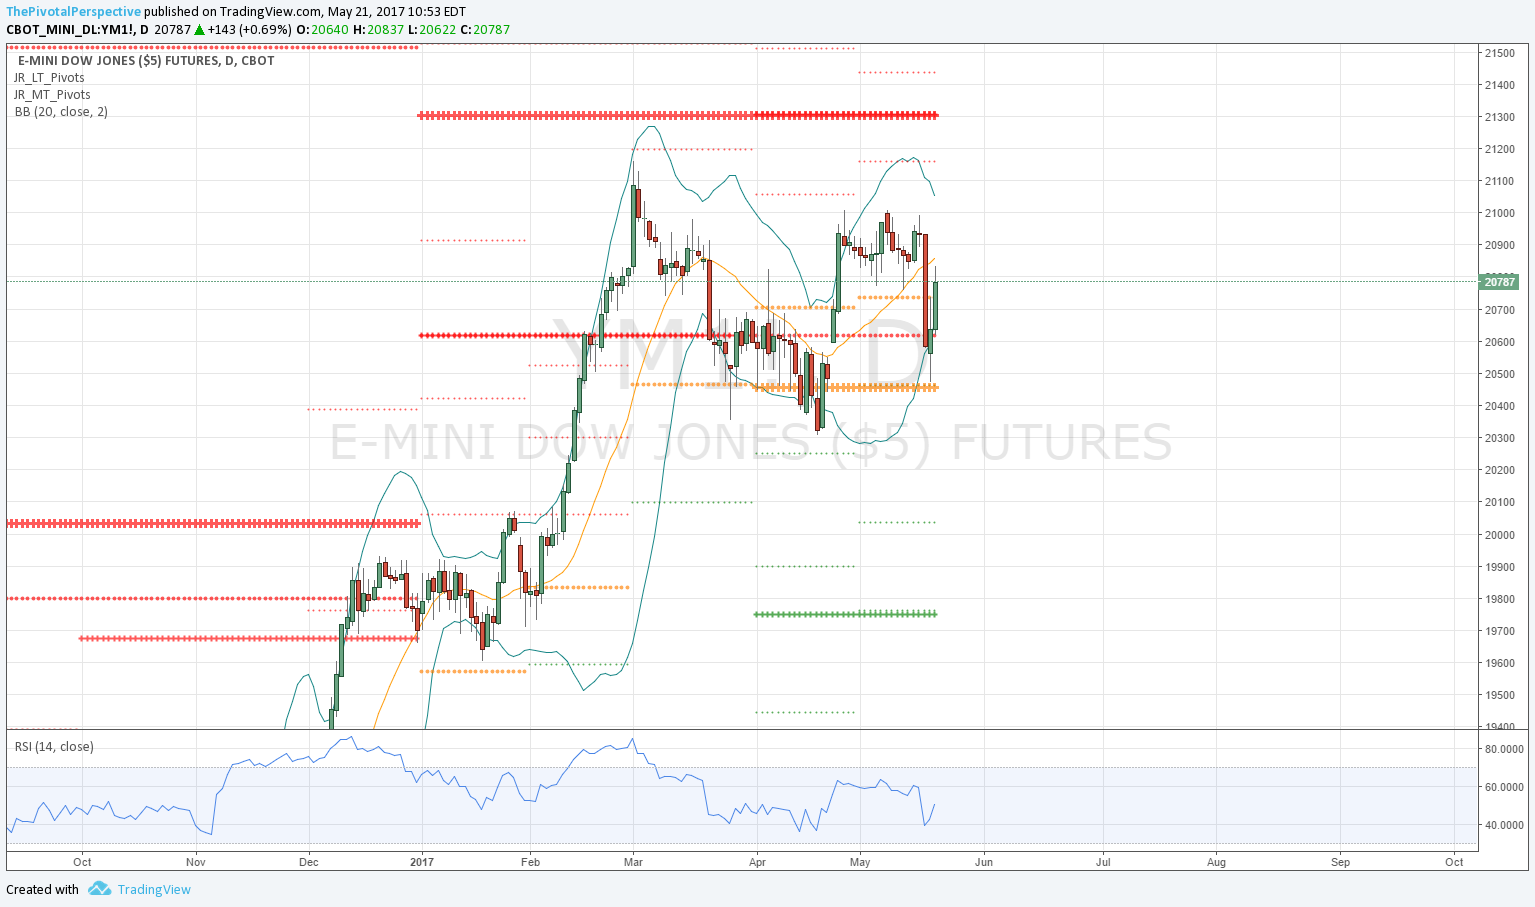
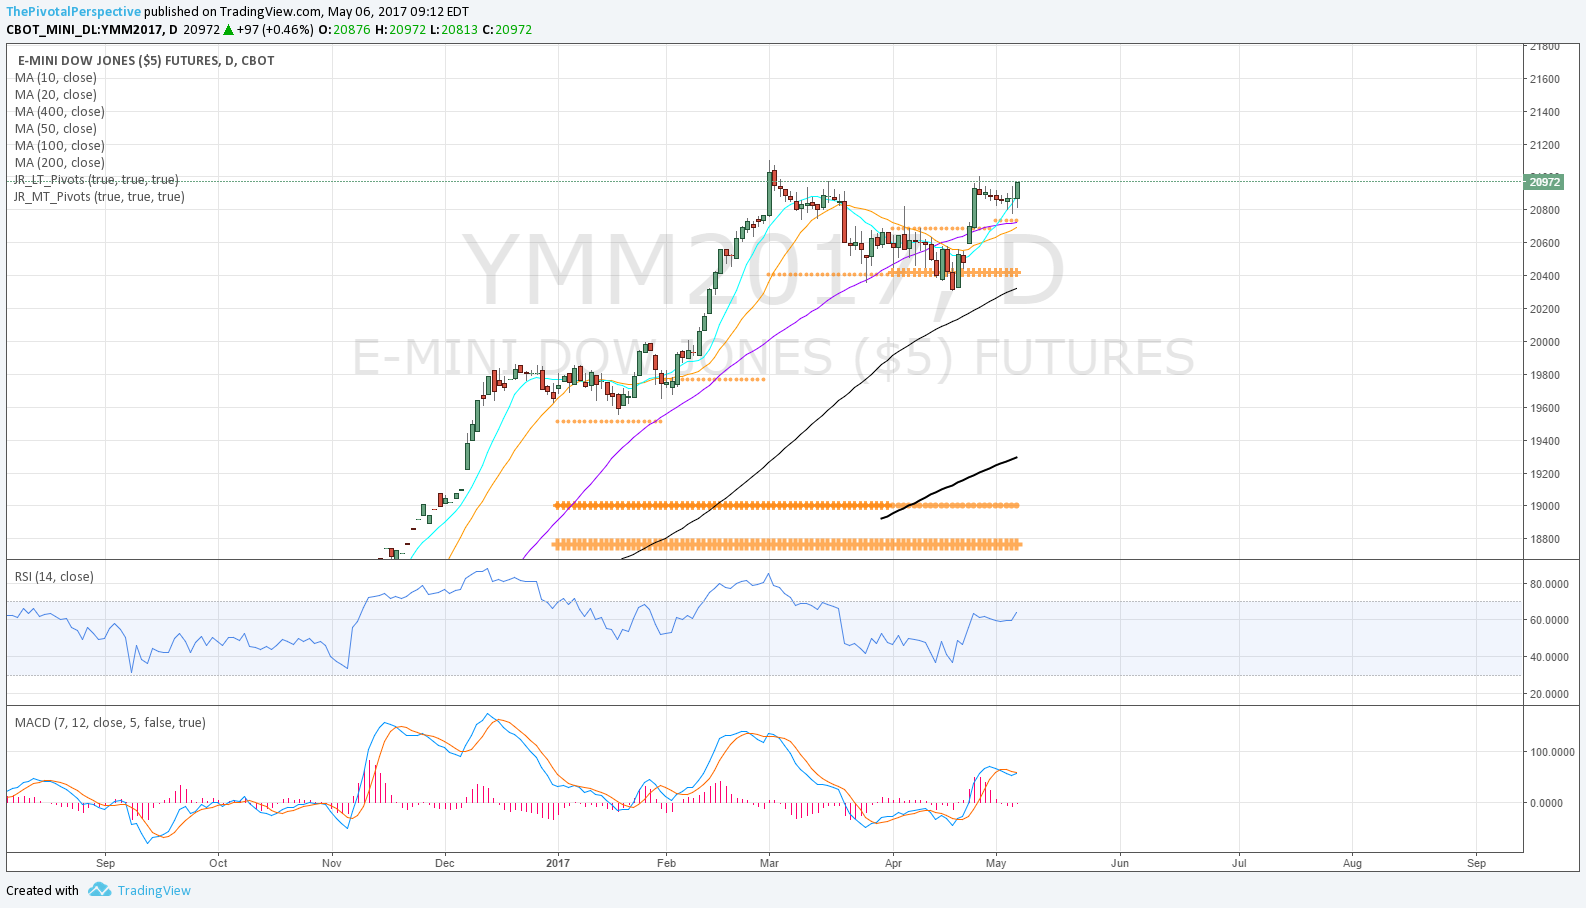
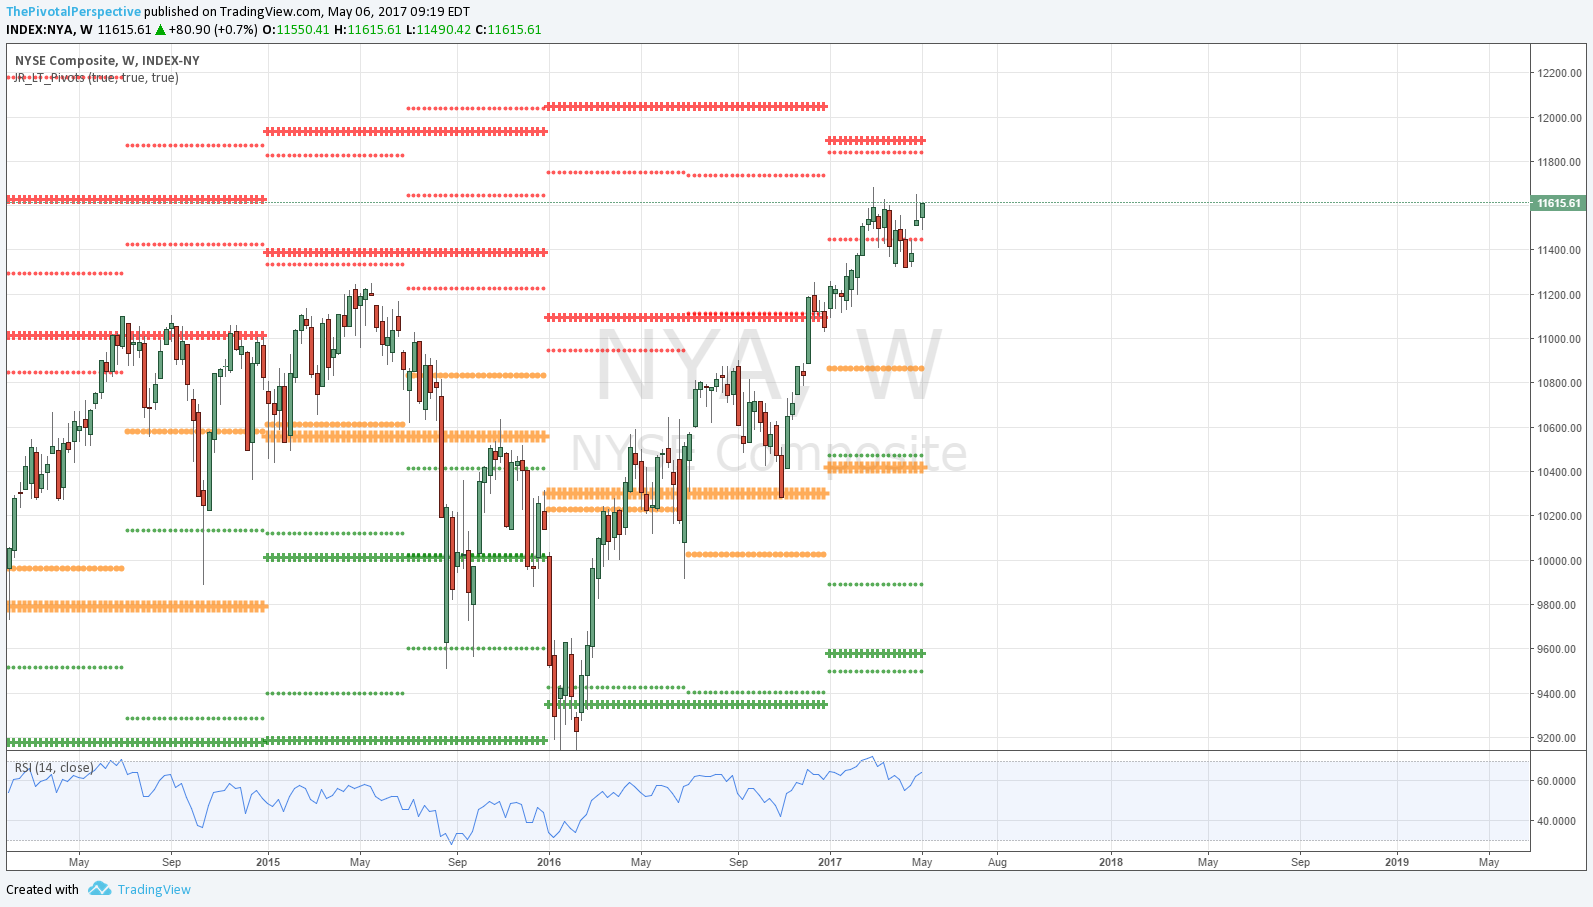
DJI and NYA comparatively weaker as they have been for much of the year. DJI could be first choice as main index hedge as it has had resistance at JulR1 and if lower will be first to have any pivot break. NYA reflecting global weakness but not a trading vehicle. 

Bottom line still pulling for indexes to reach target areas, but if any signs of weakness may take some off table and/or add hedges on DIA.
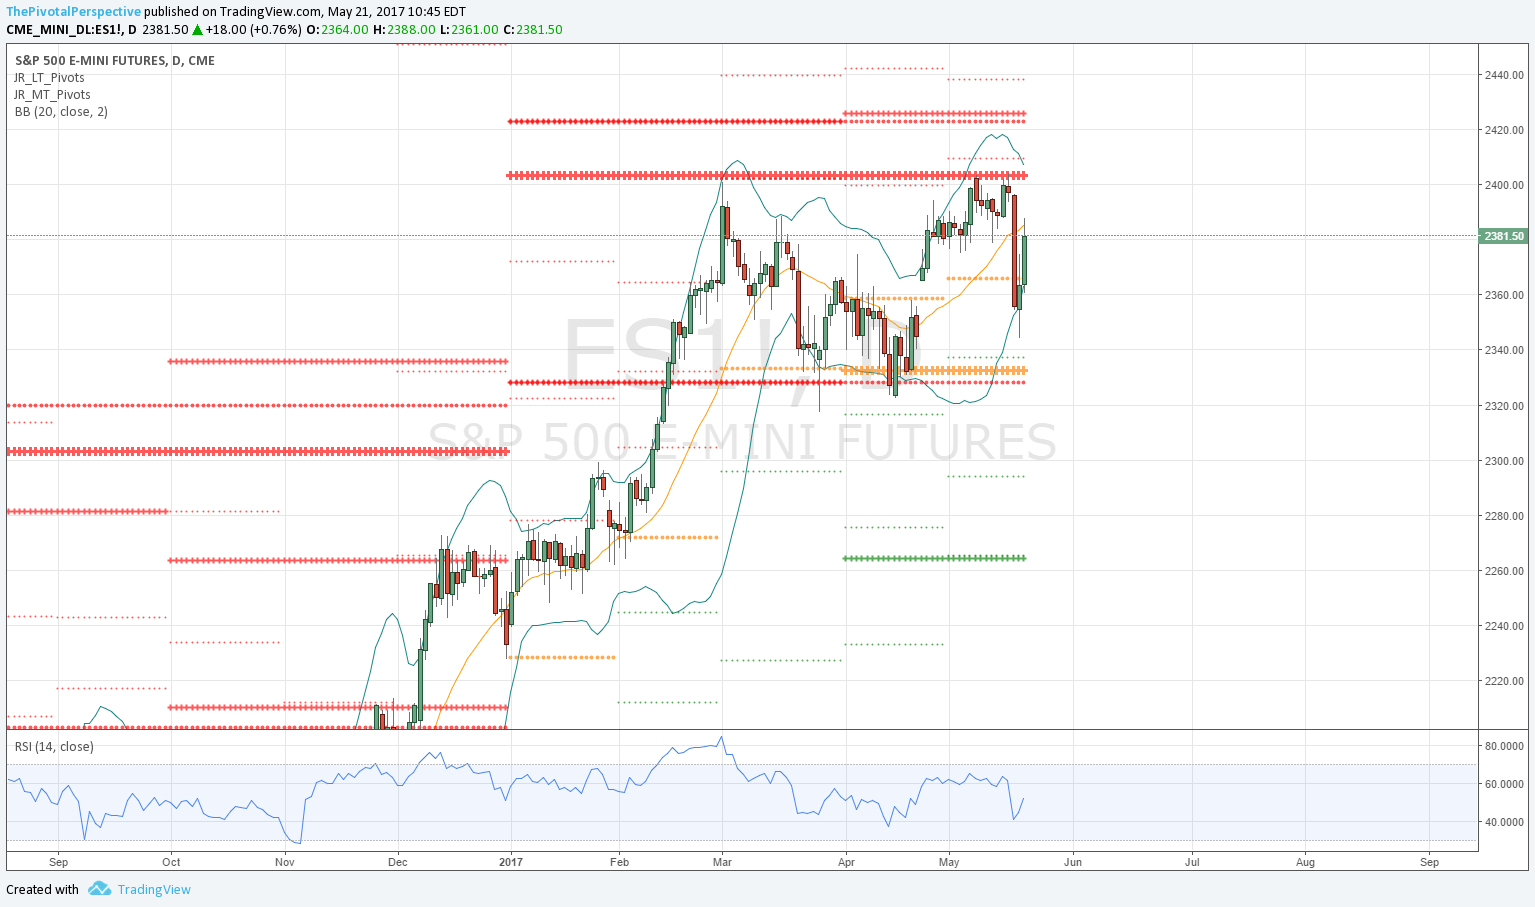
SPX SPY ES
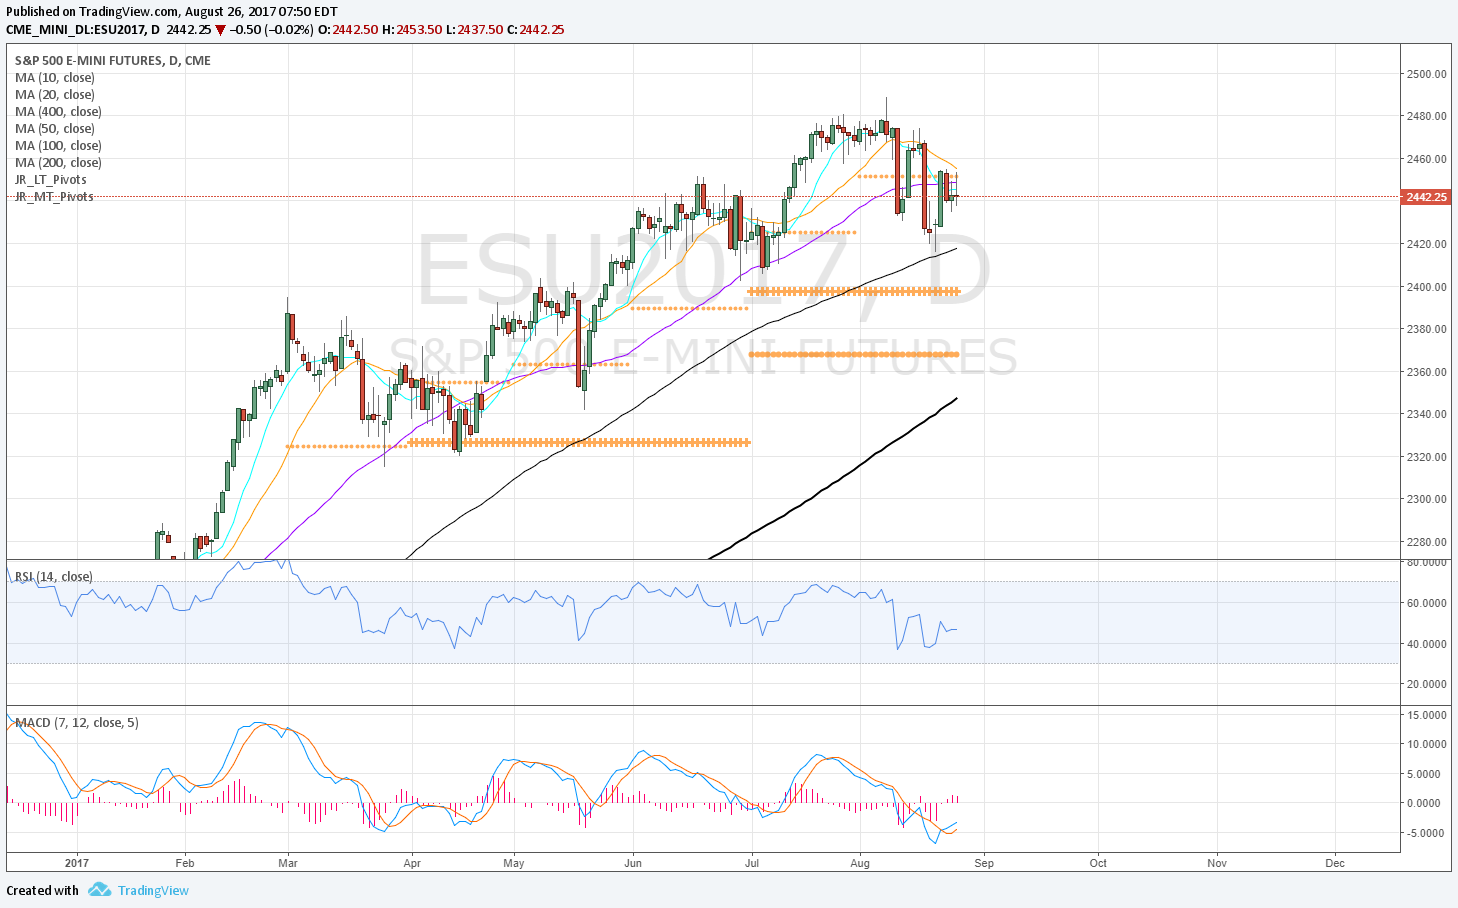
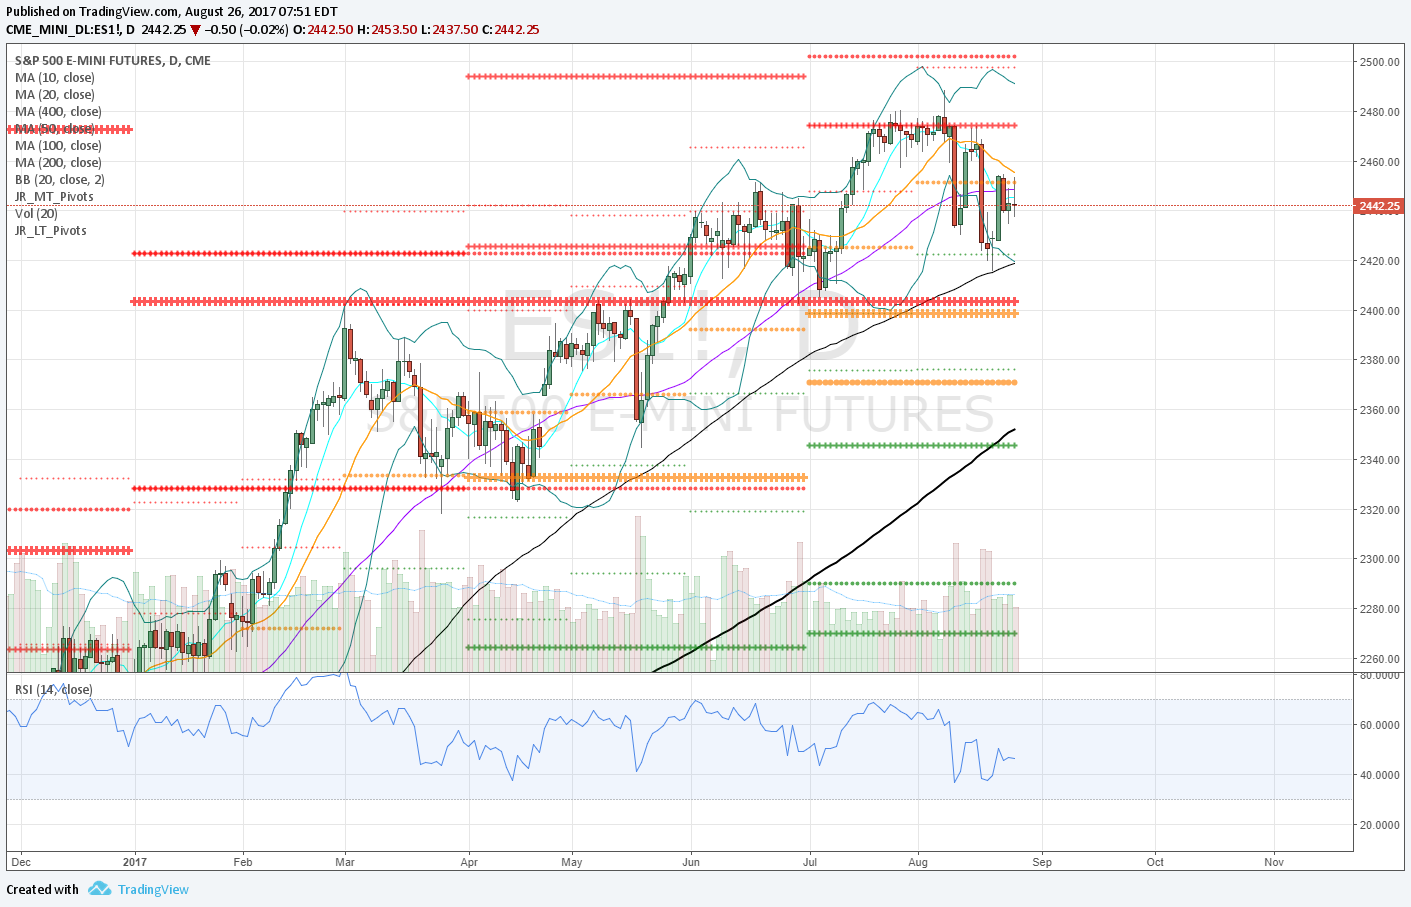
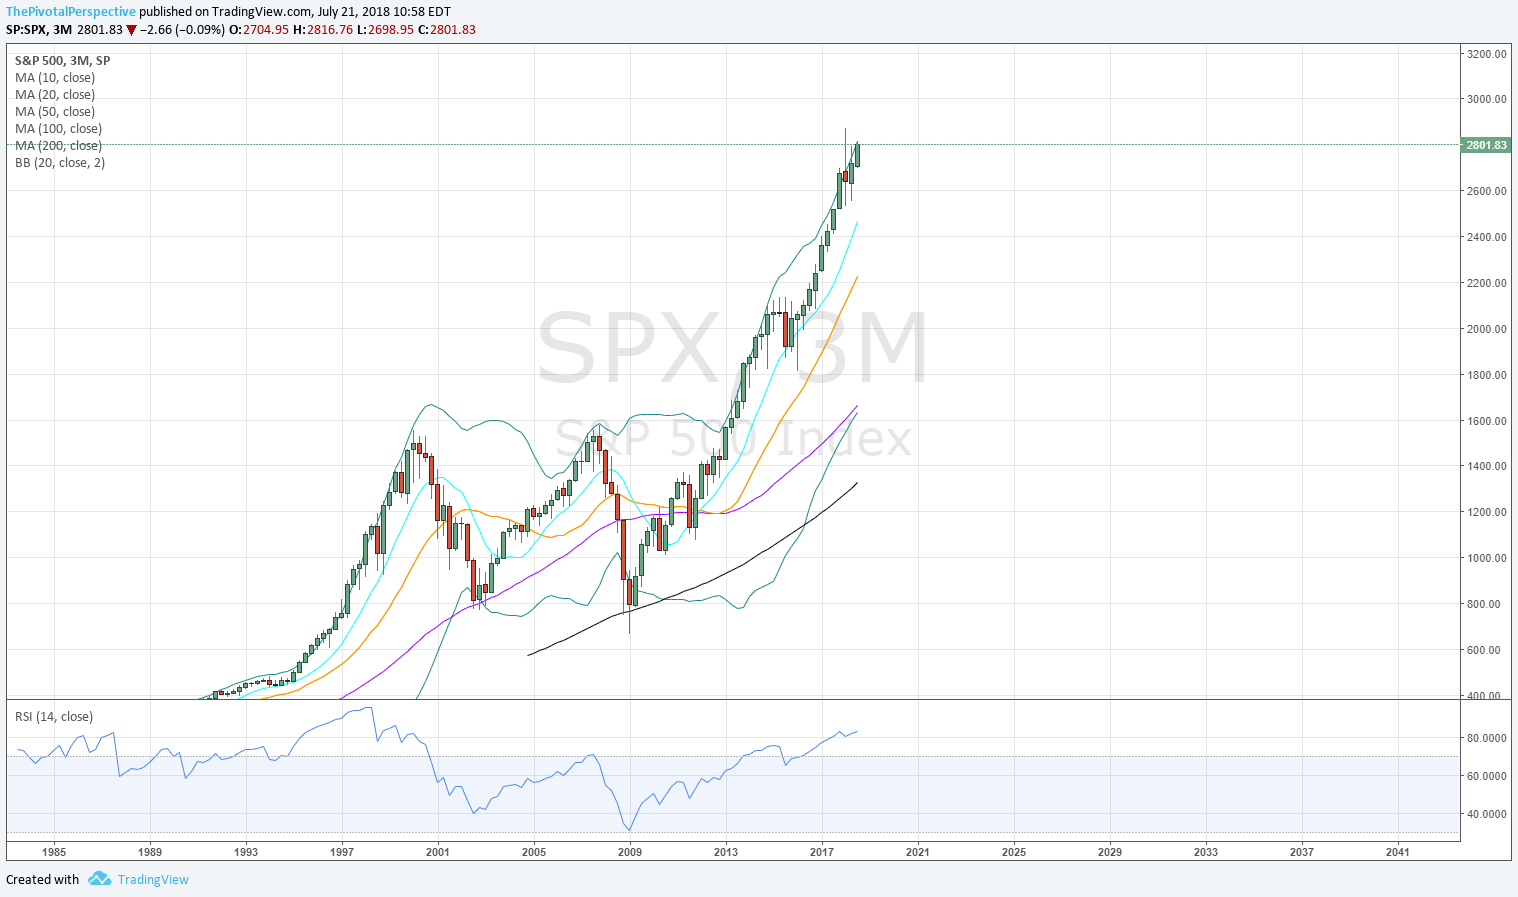
SPX Q: High on BB exact to the point so far. 
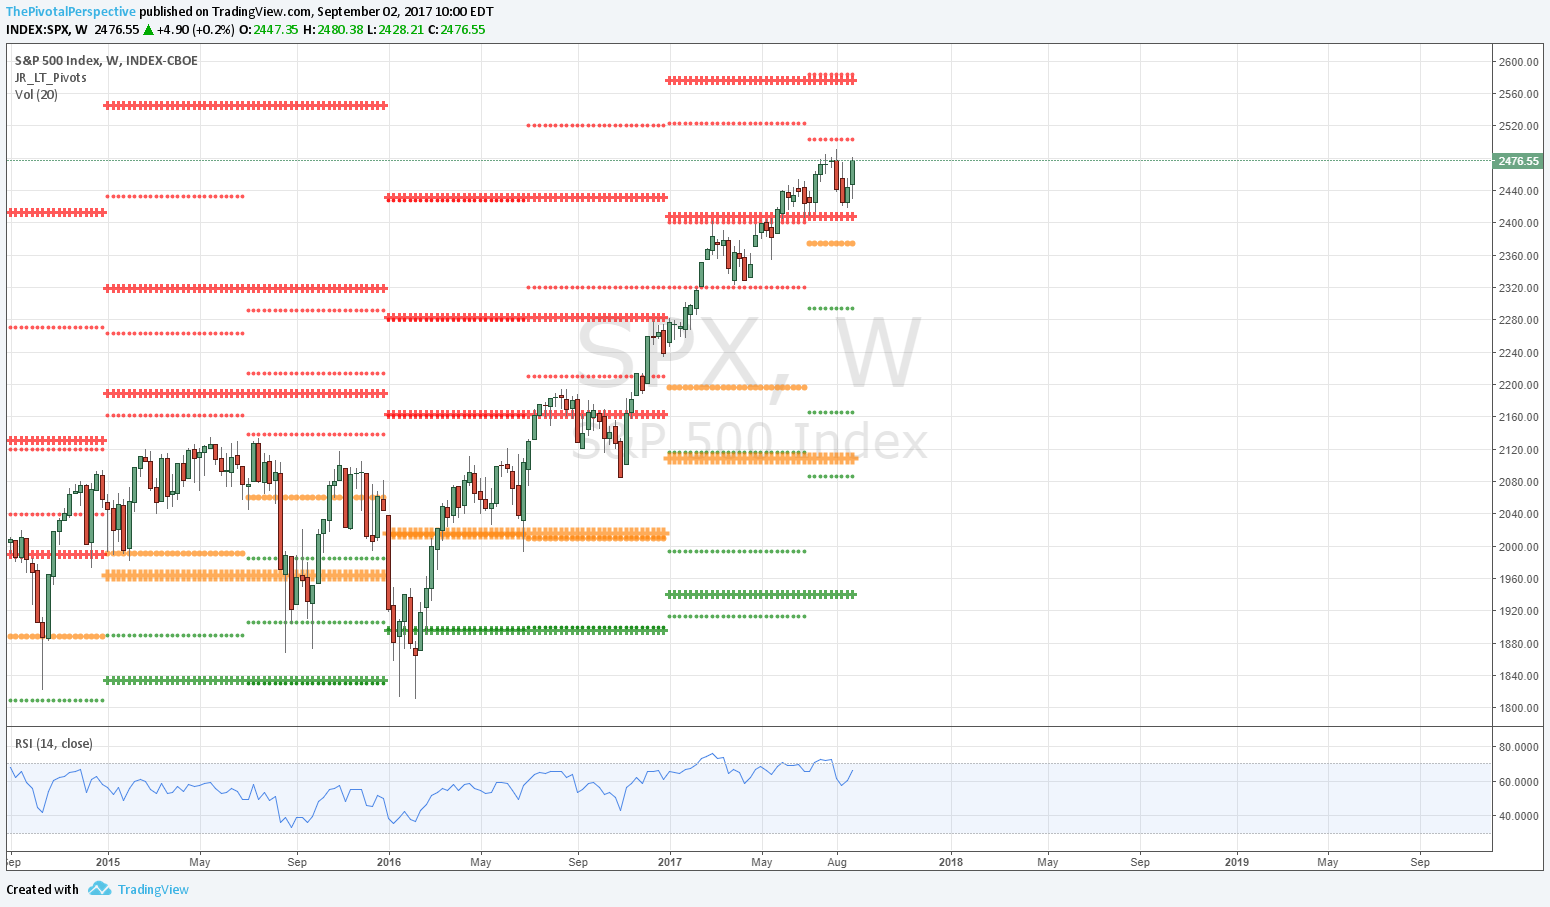
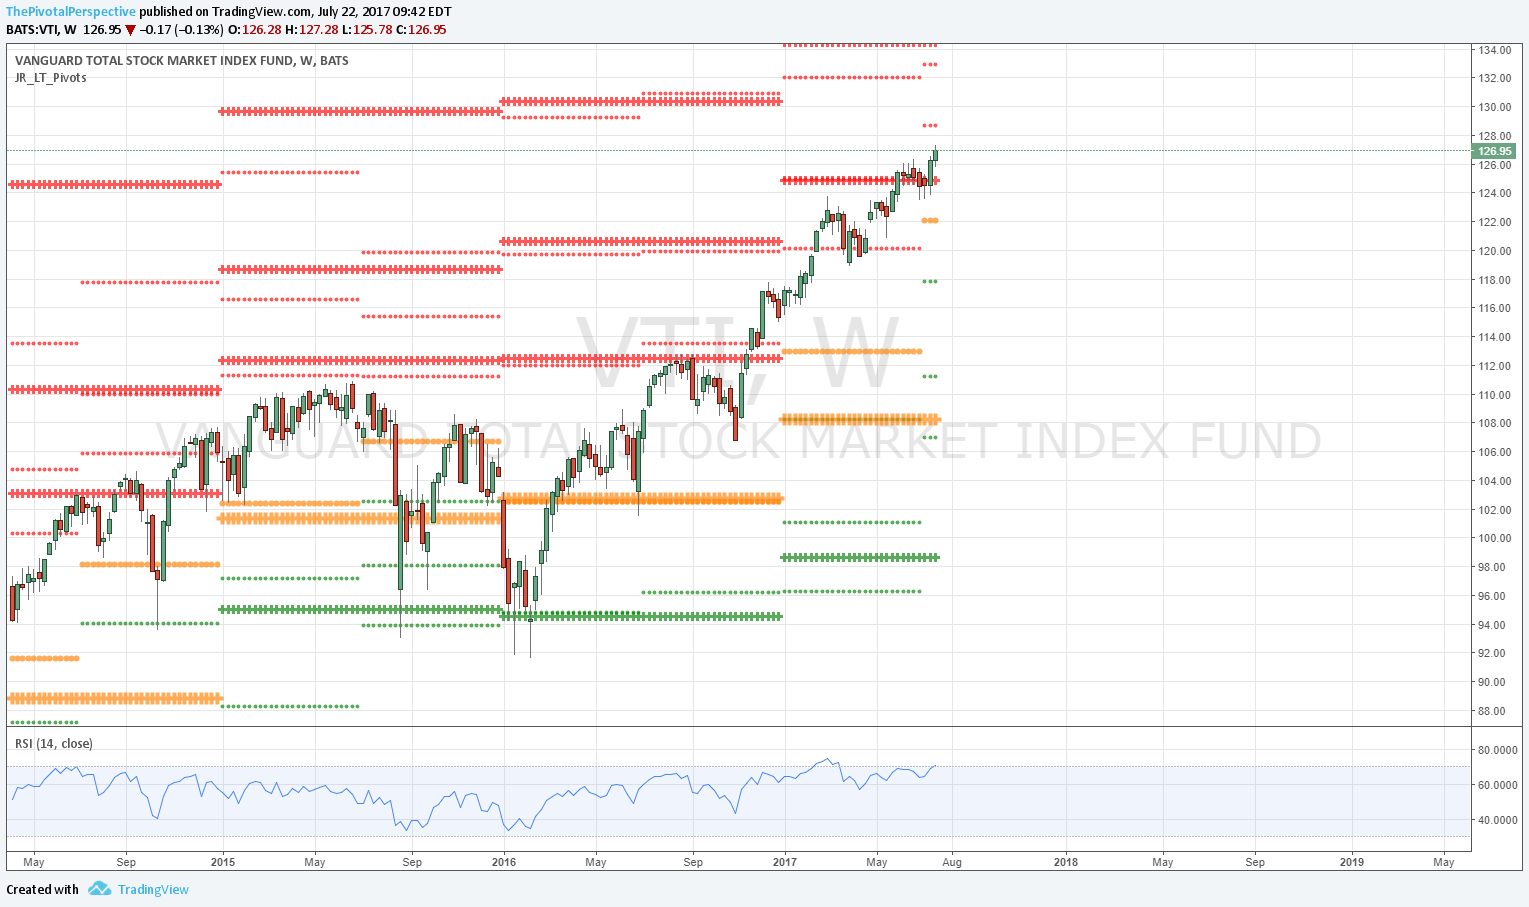
SPX W: YR1 near test.
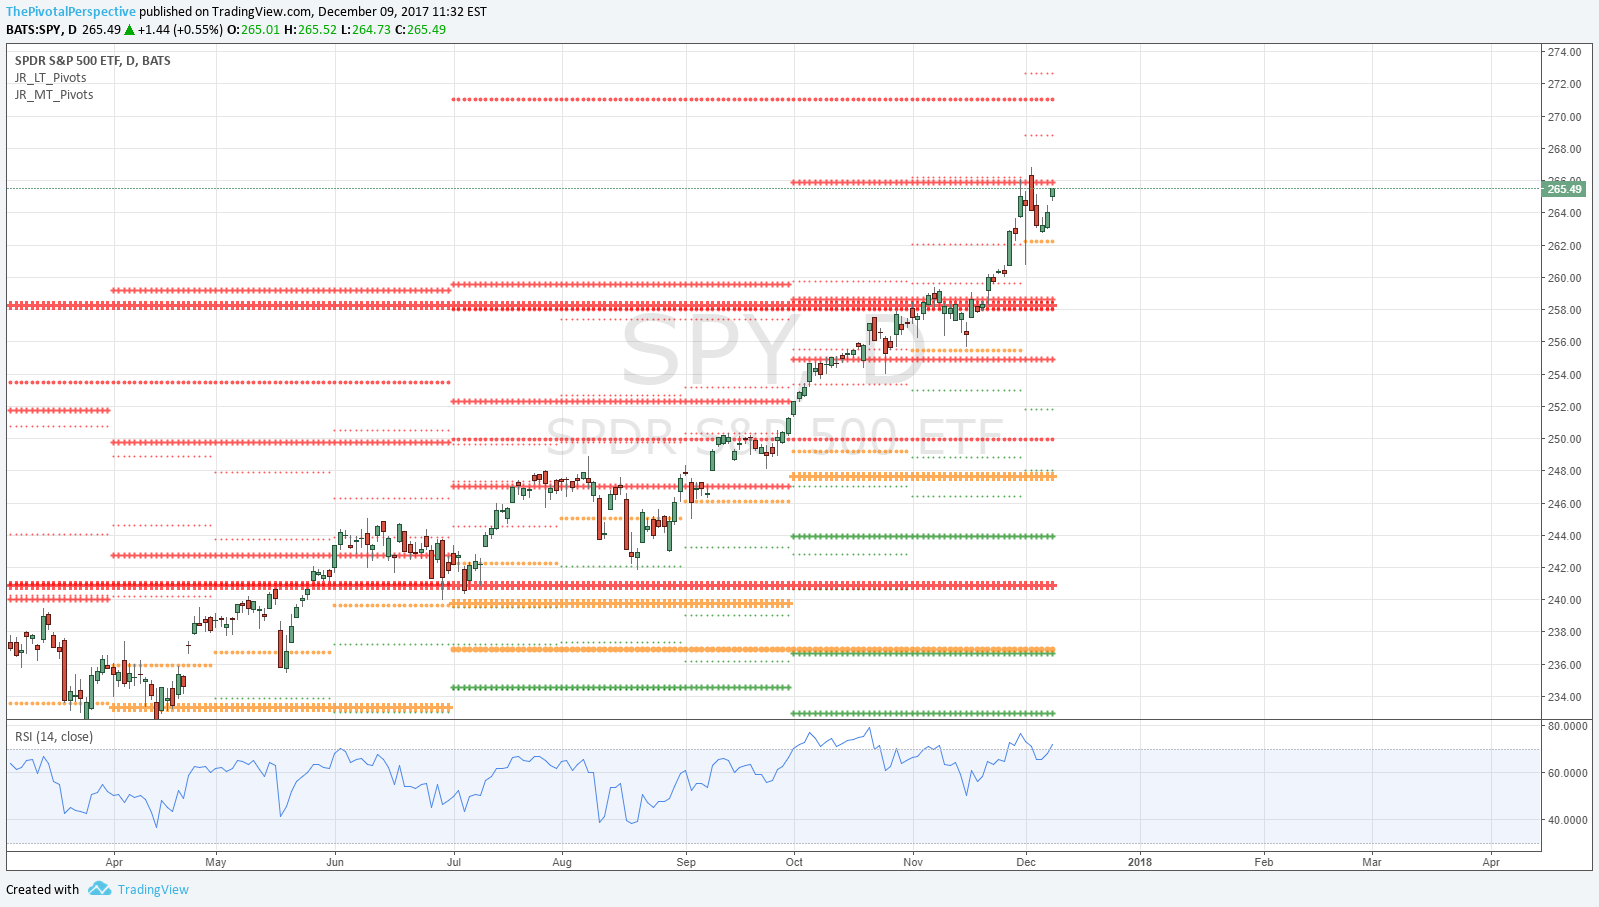
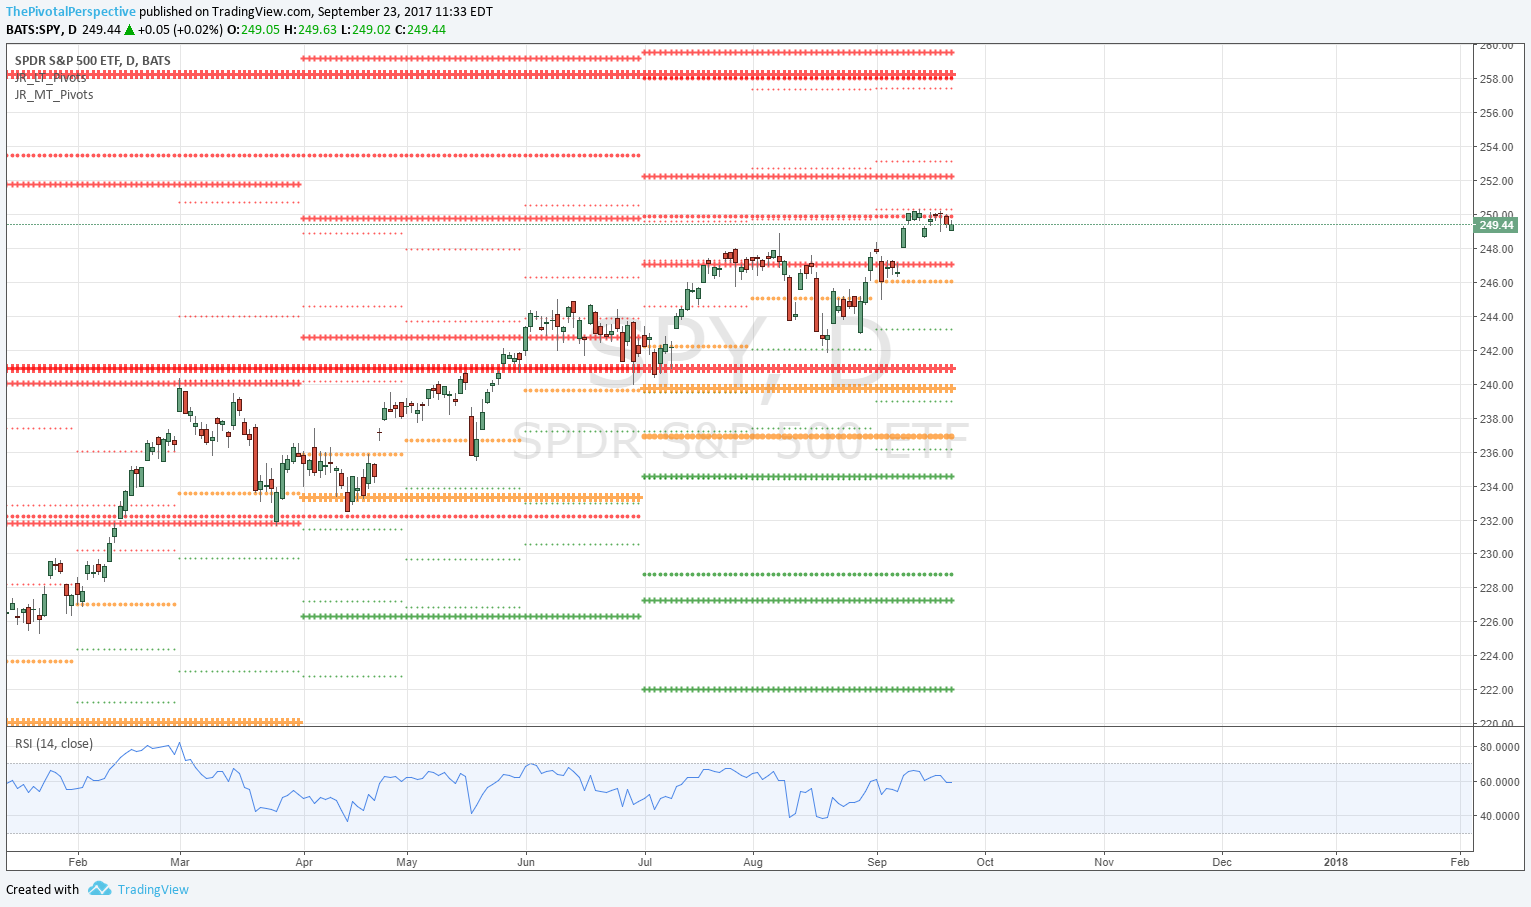
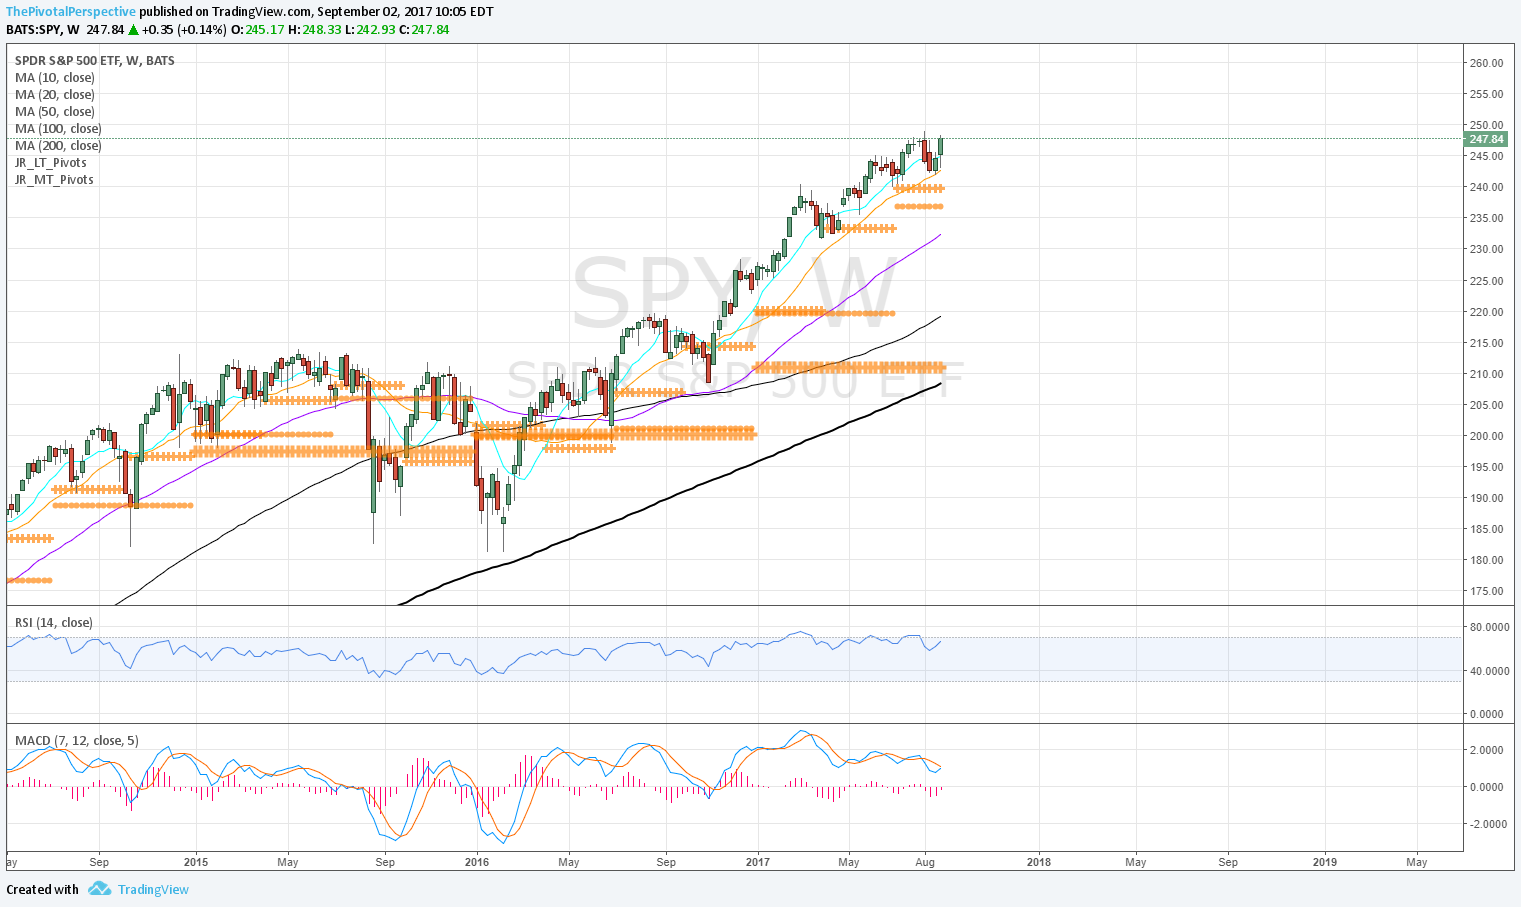
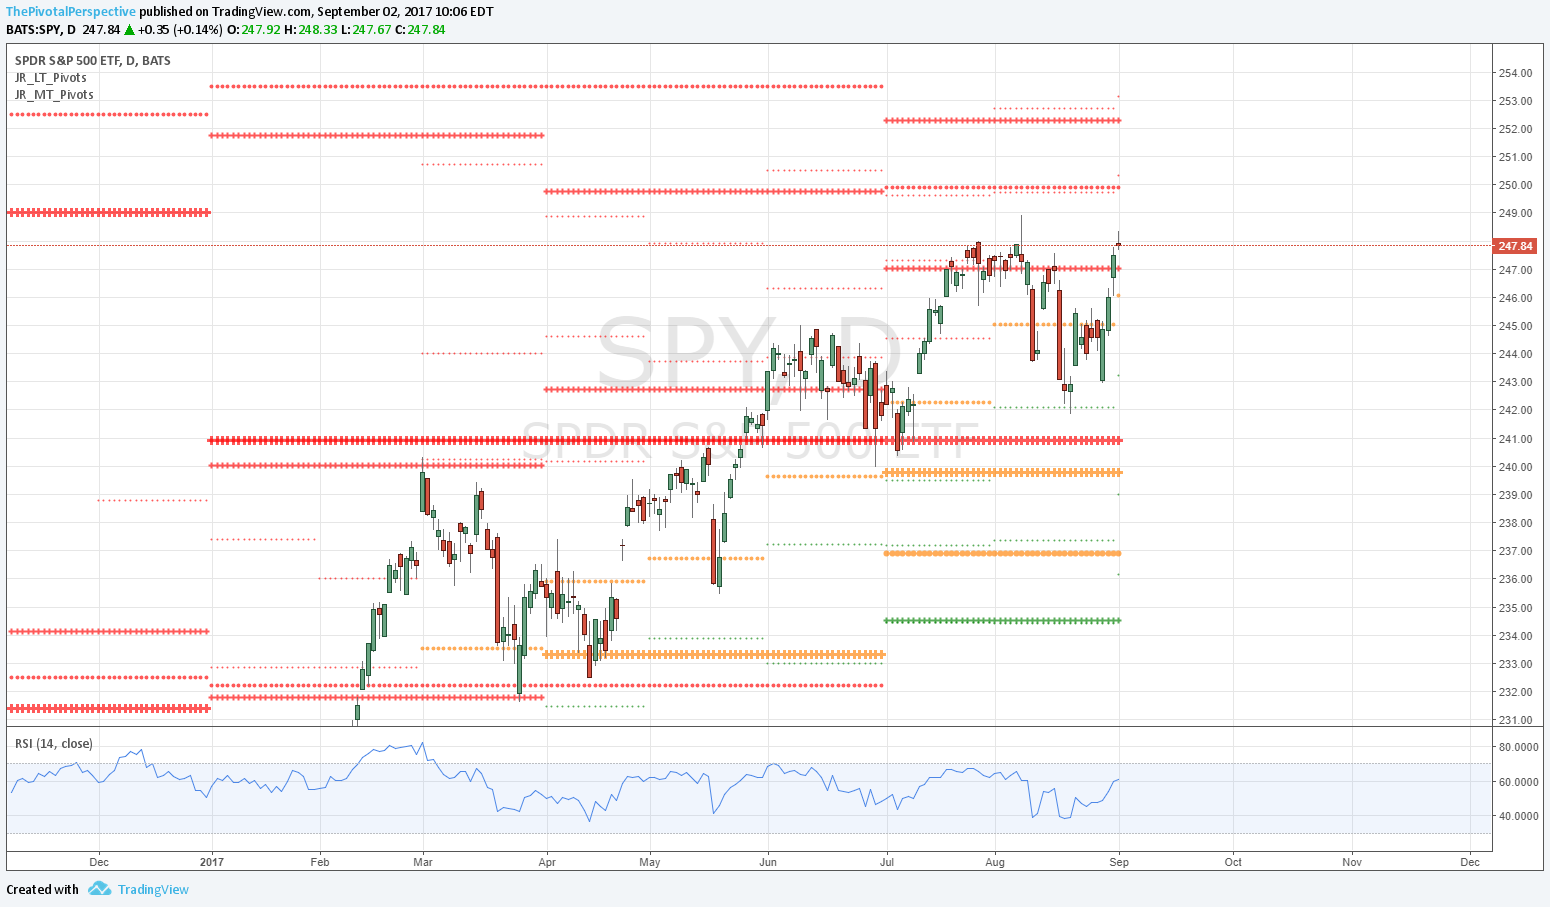
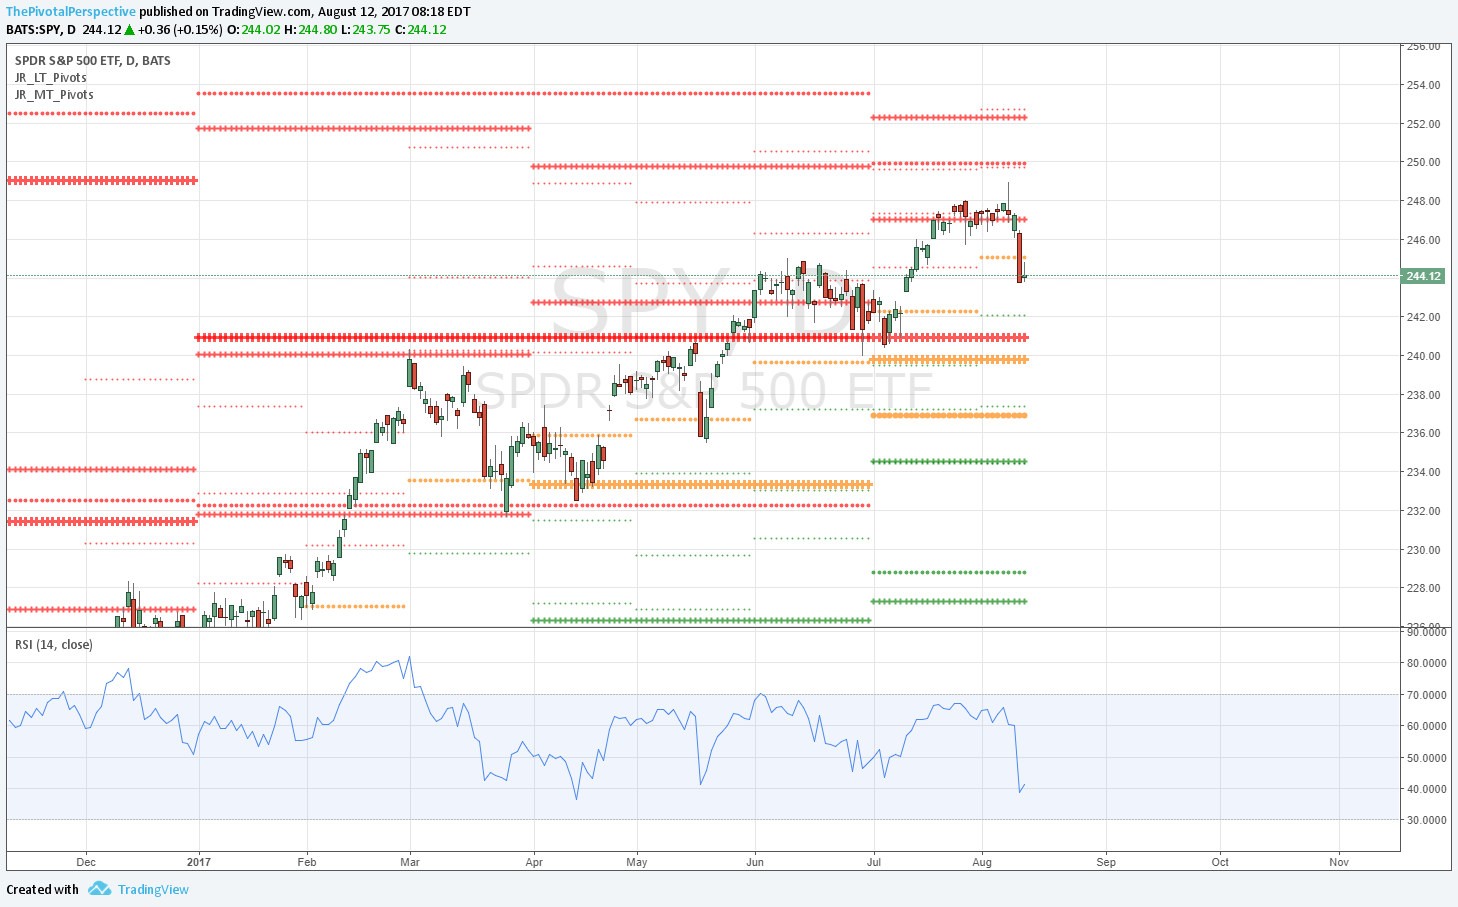
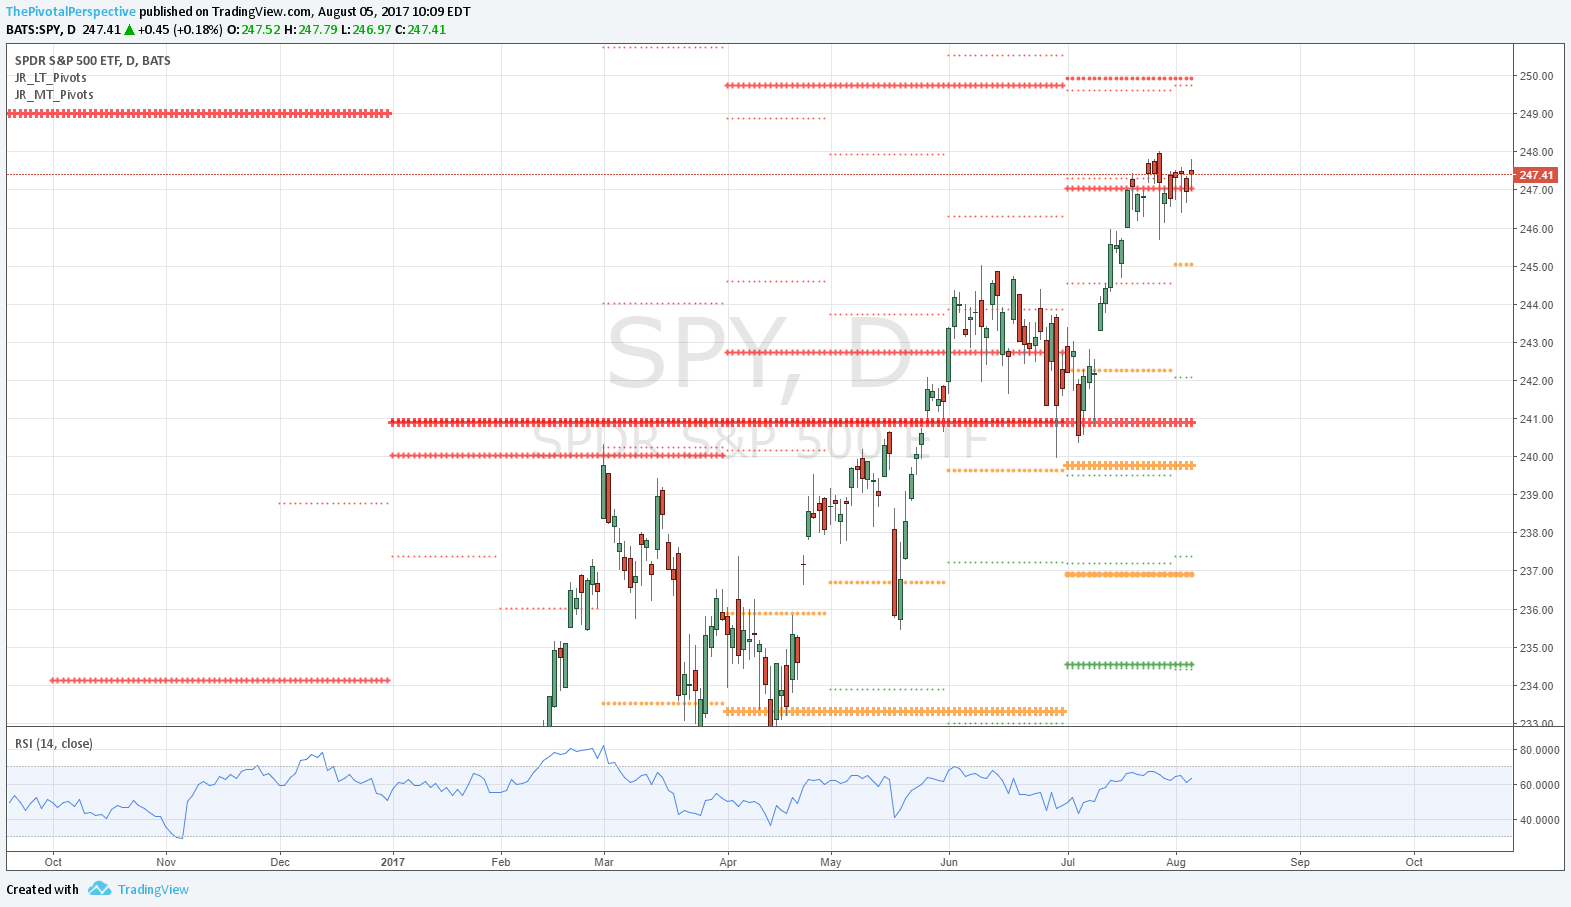
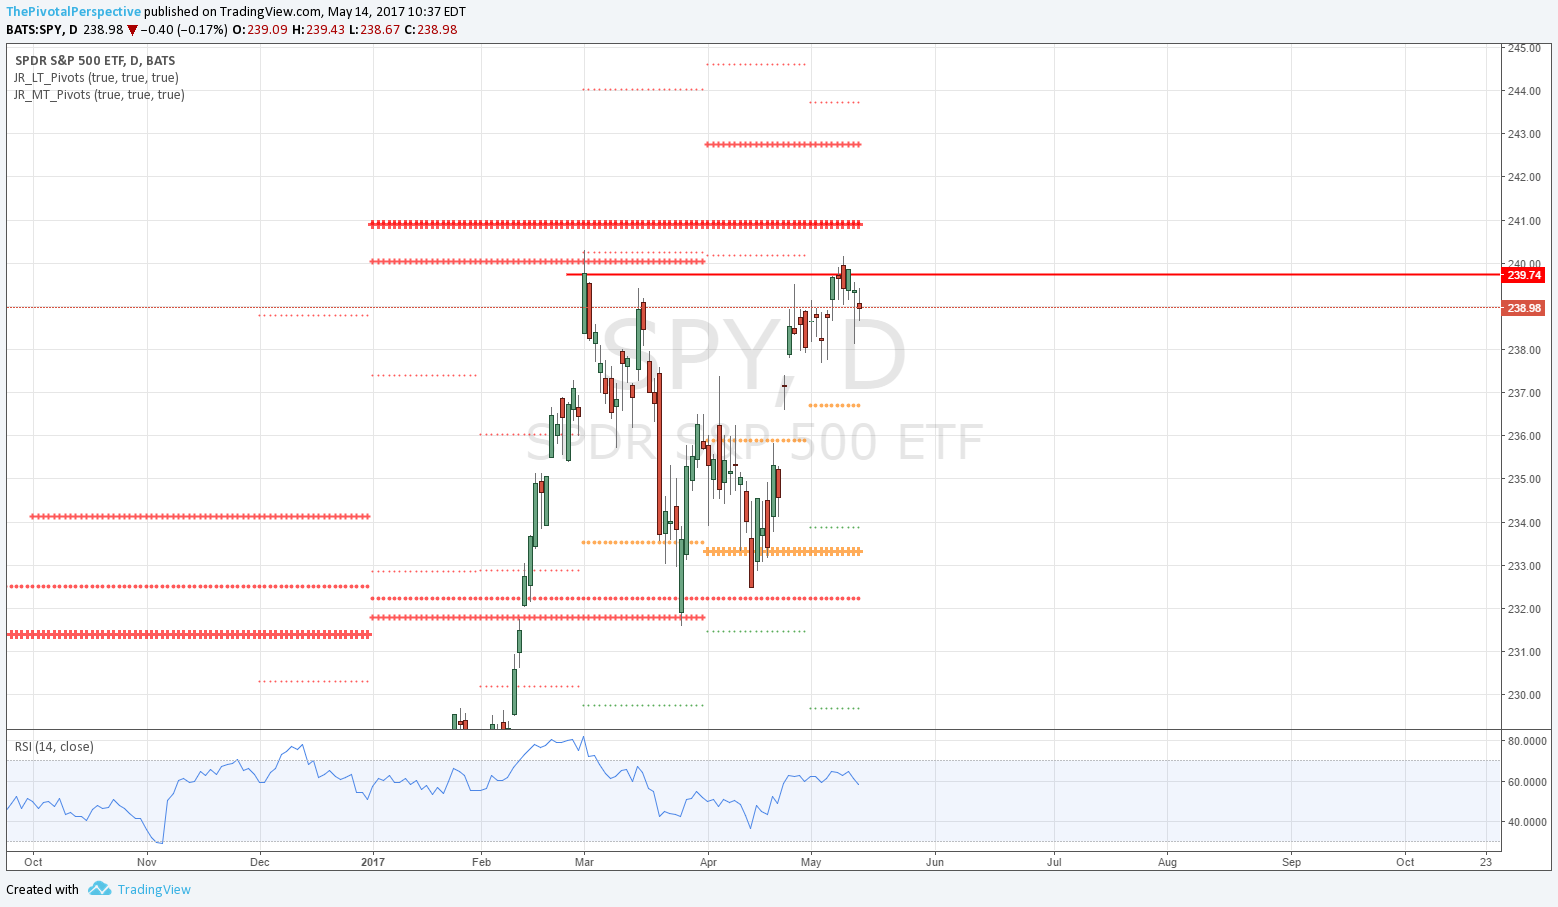
SPY D: YR1 & QR1 nearly same level for the ETF.
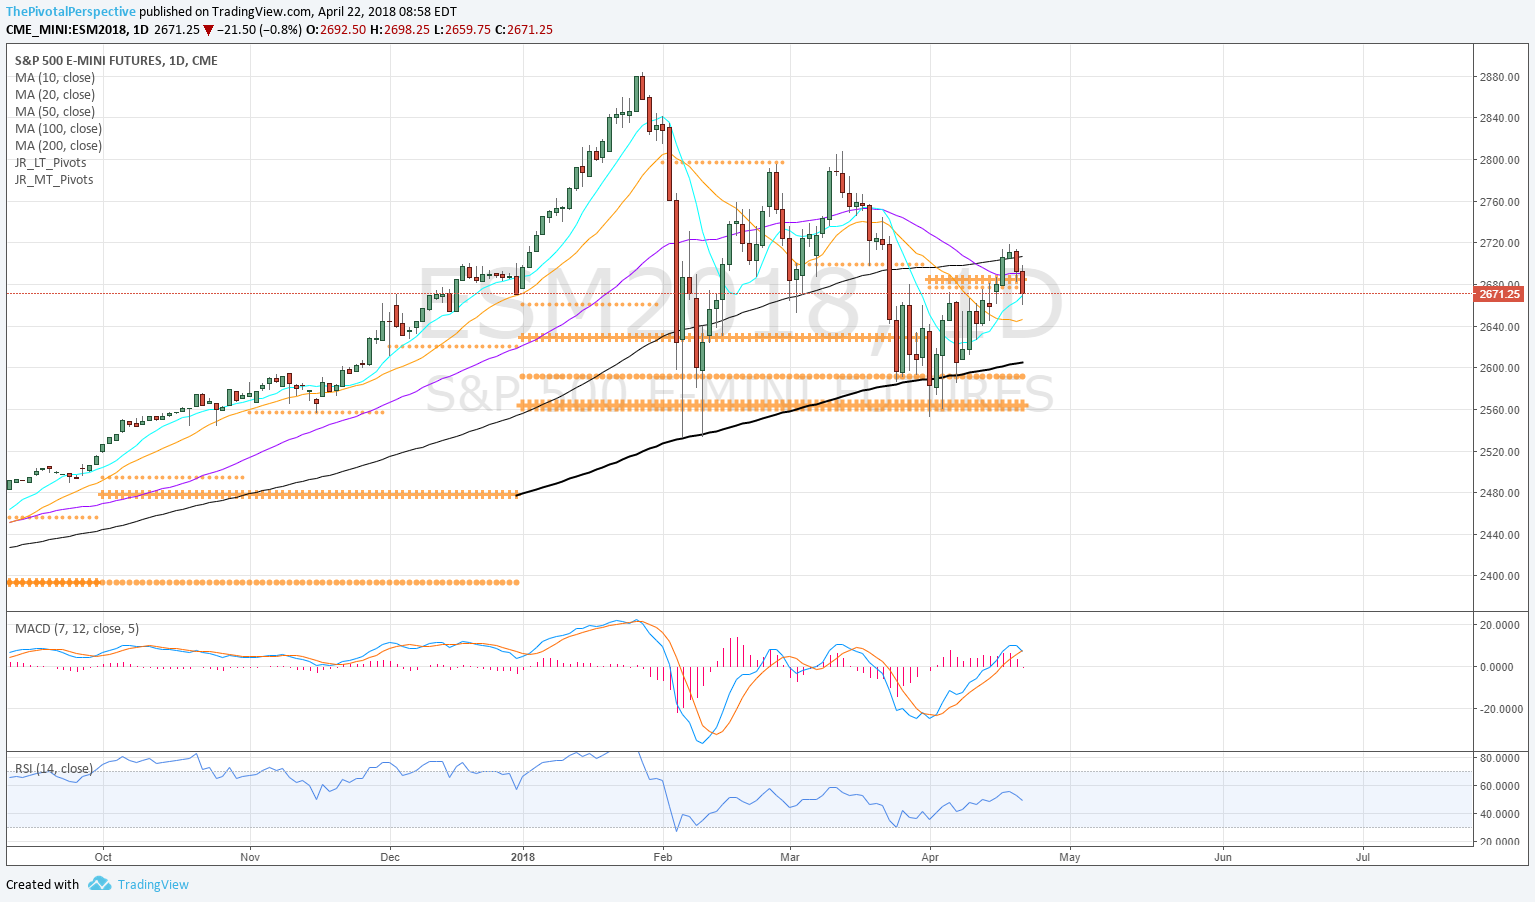
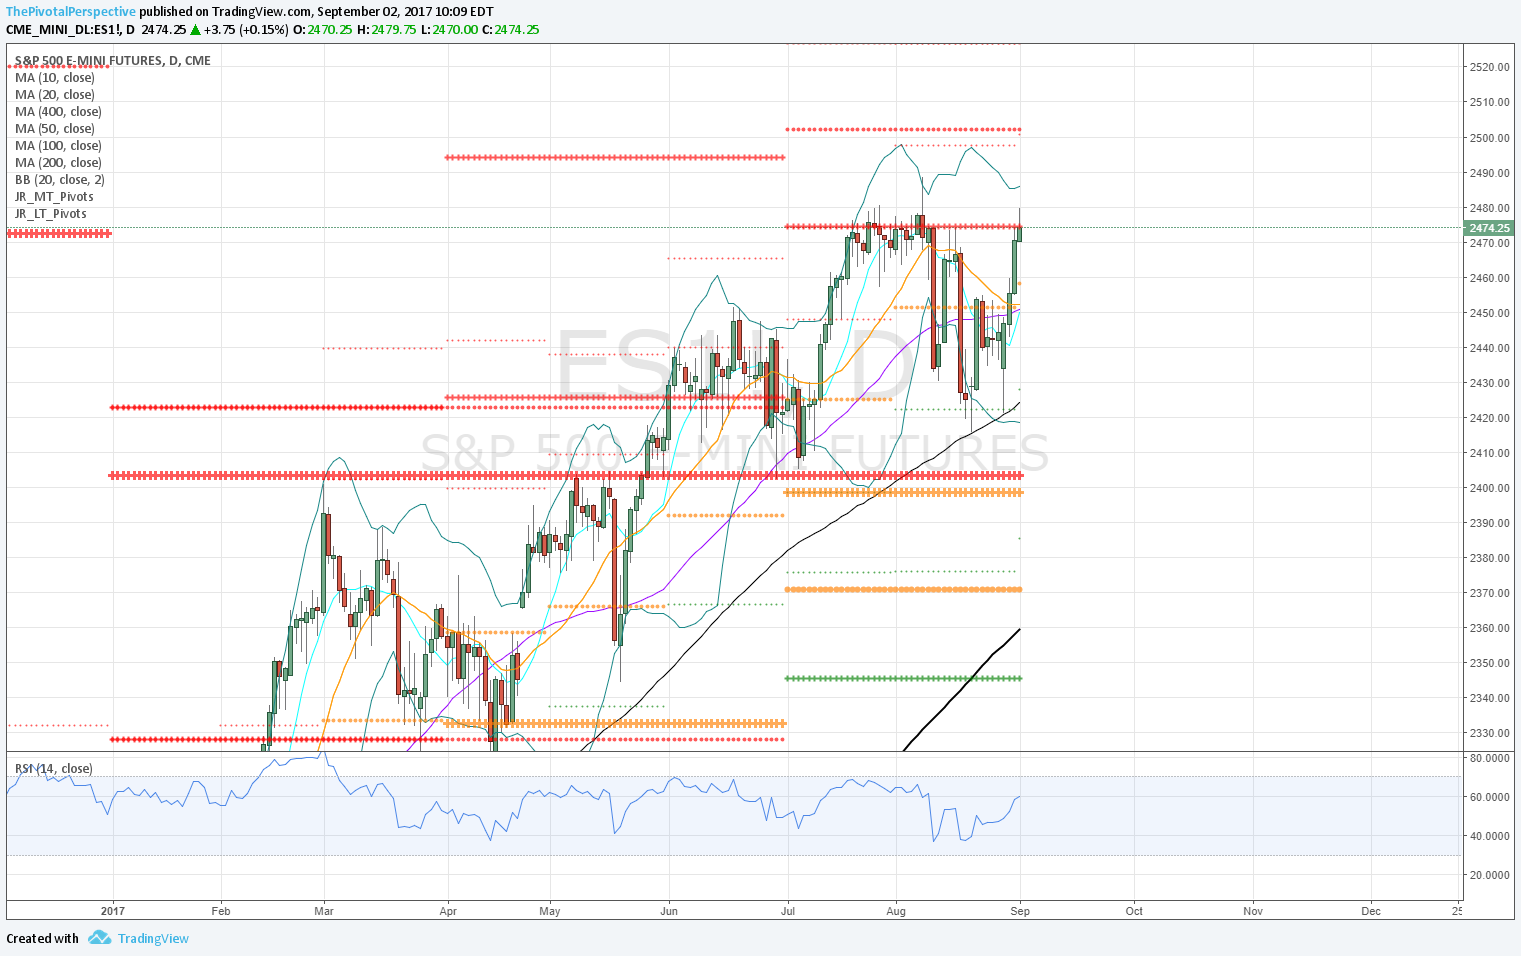
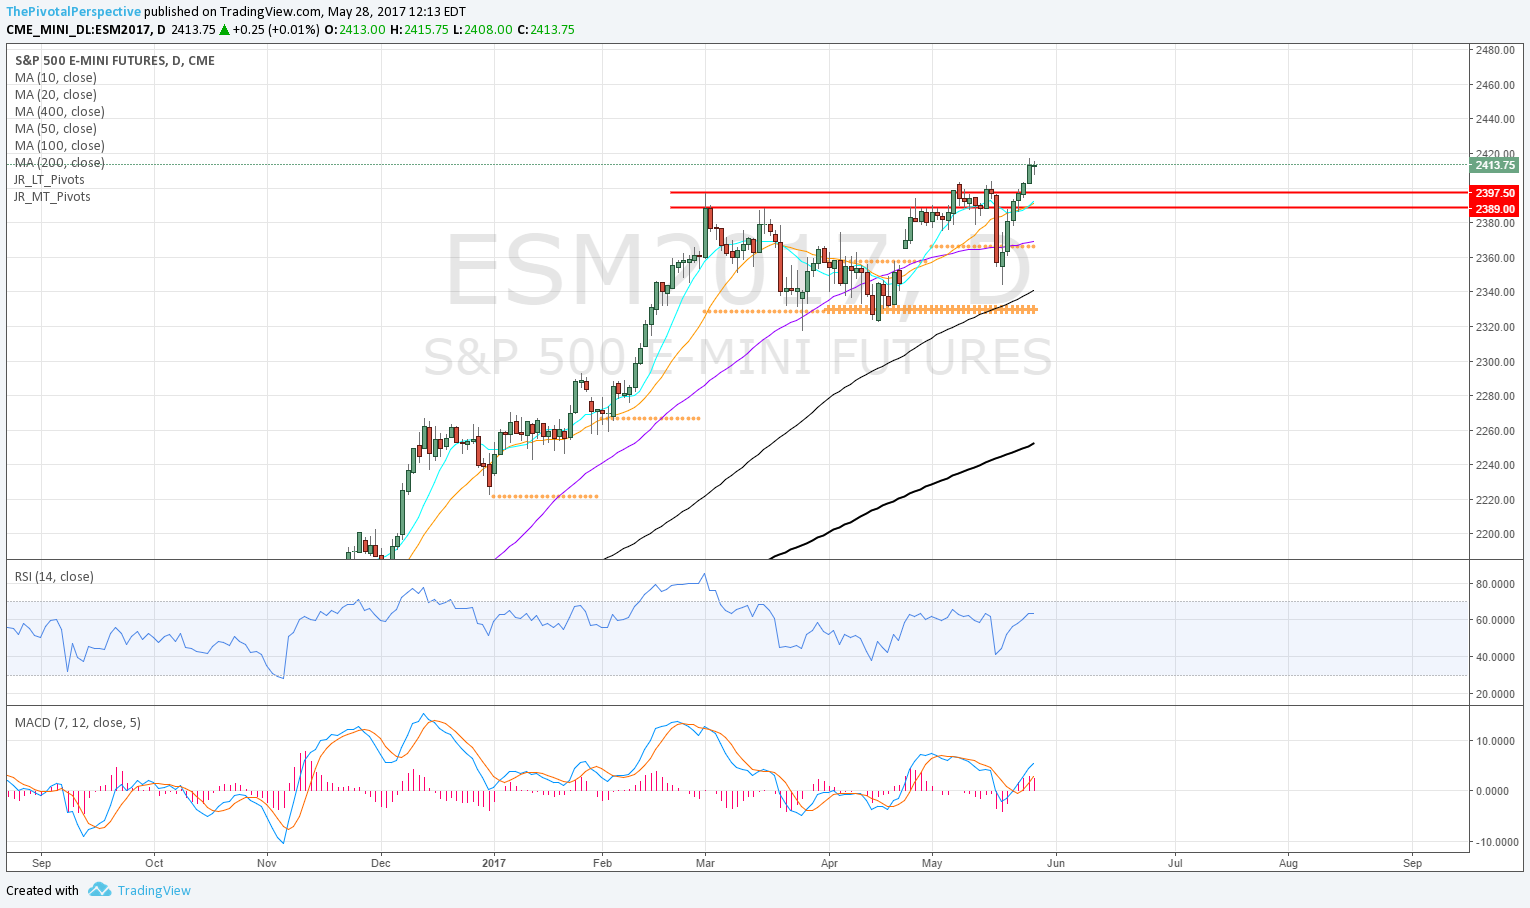
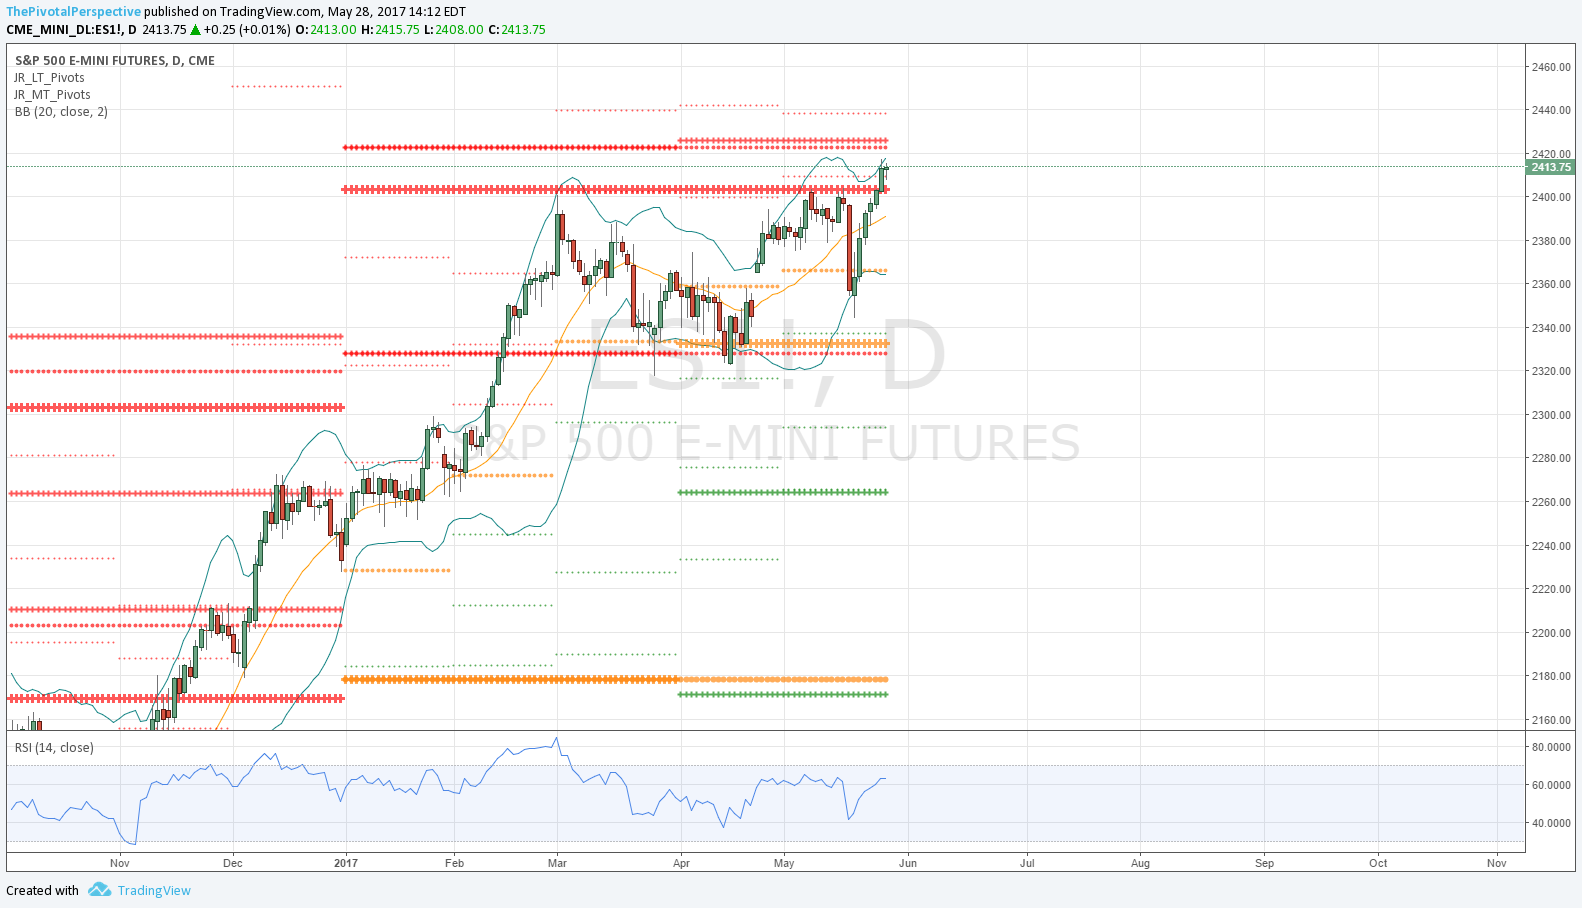
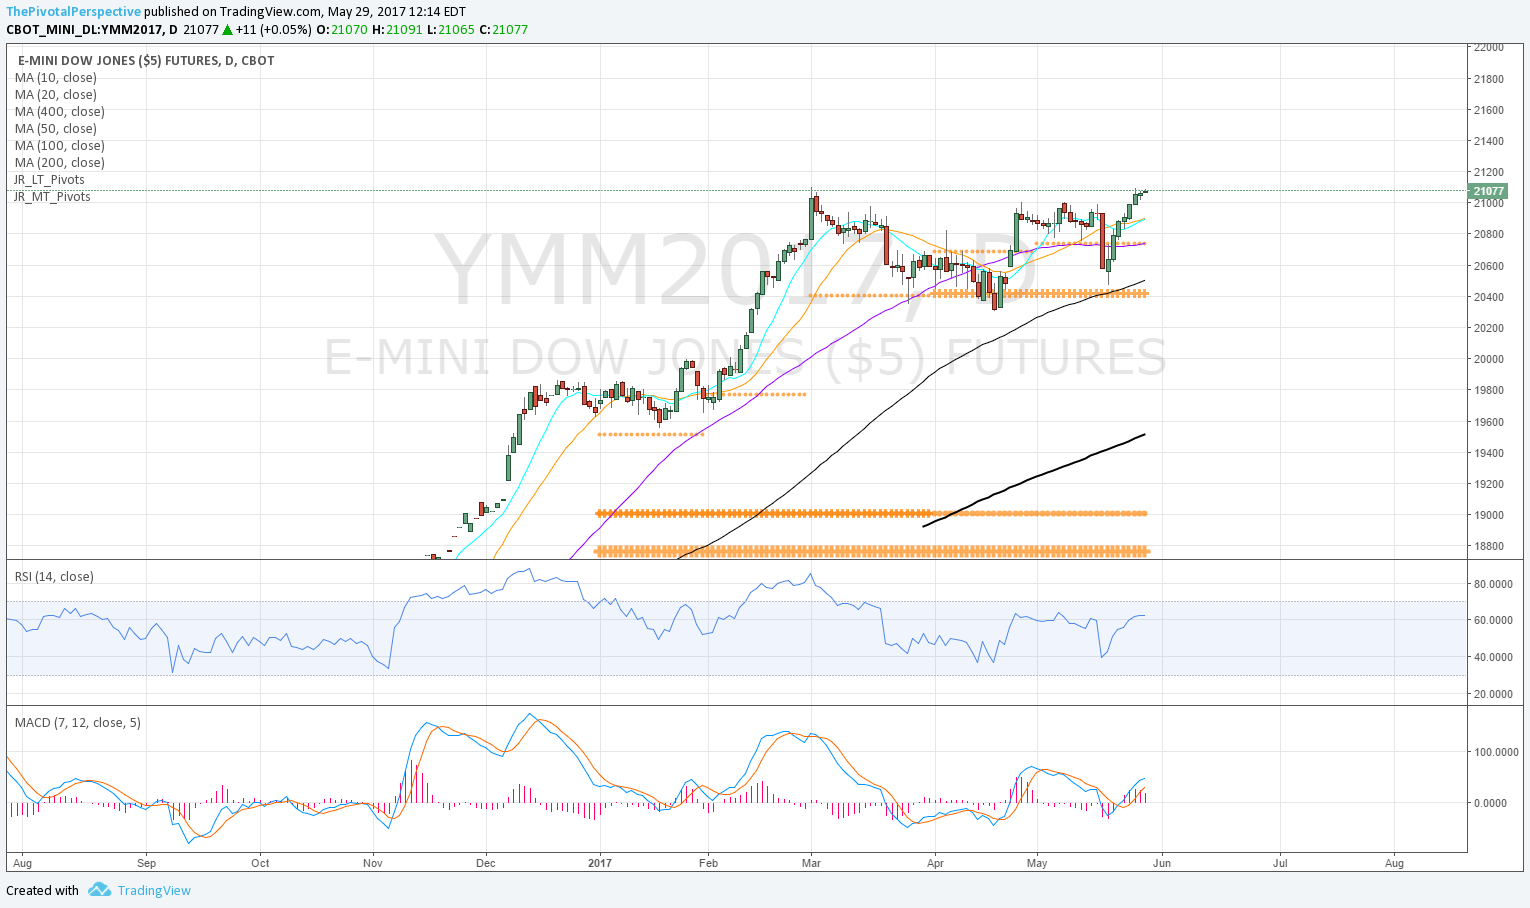
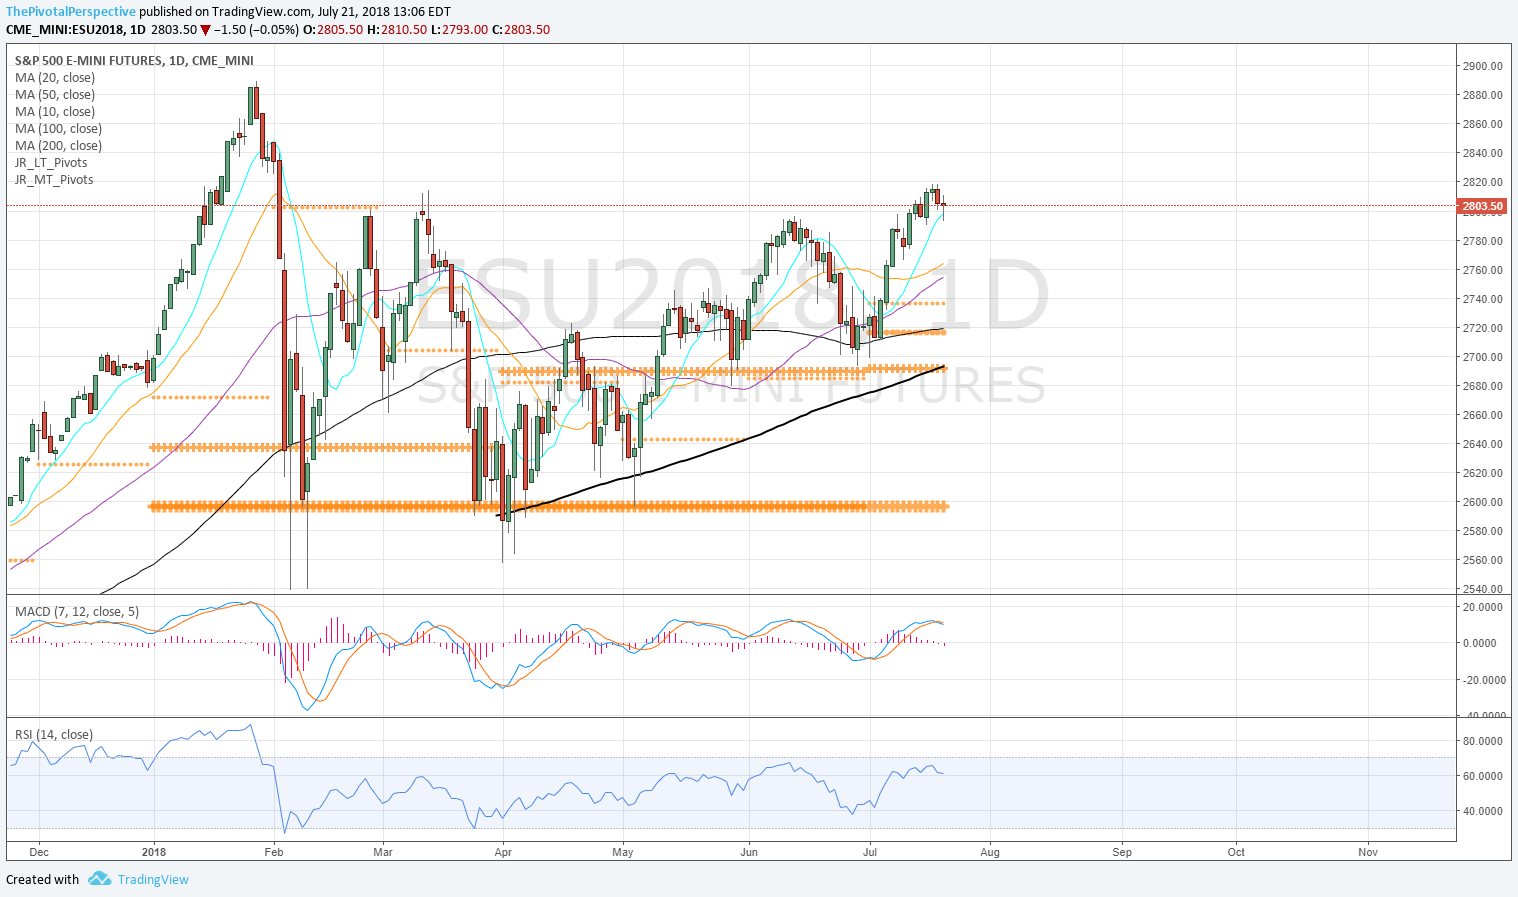
ES D: Last 2 days just a pullback to nicely rising 10MA.
SPY 2H: All above weekly pivots since 7/5, with the WP perfect buy last week. 
SPX sum: Pulling for SPX to reach QR1 - YR1 target at 2822-2830, but the question is whether 2816 was close enough. Q BB at 2816 exact adding to resistance in this area. Near term tells are the response from the daily 10MA and next weekly pivot. 
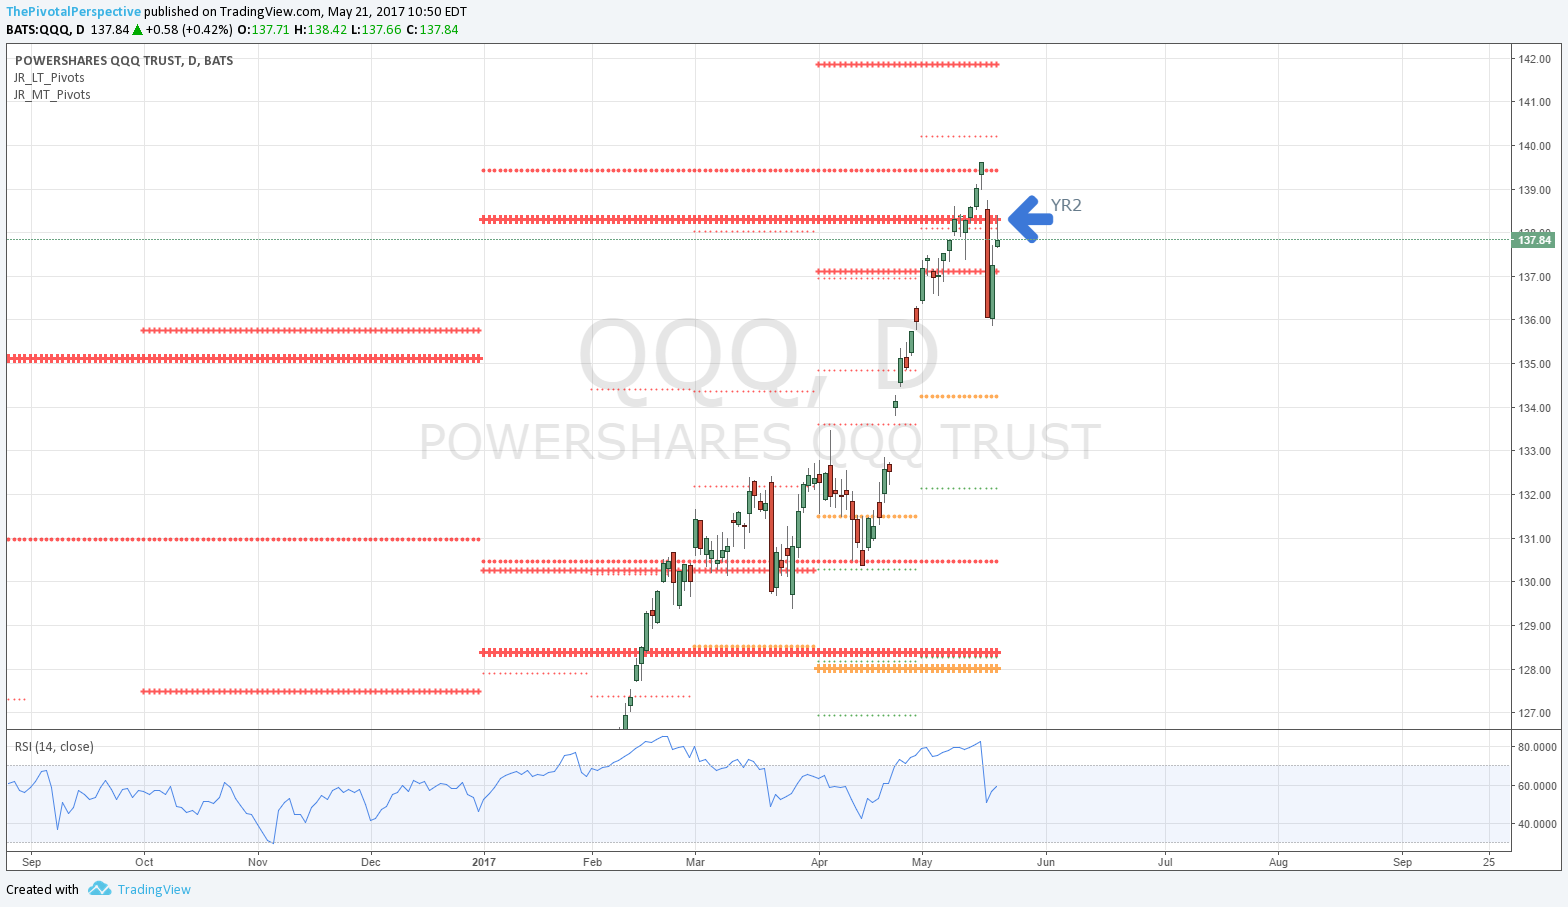
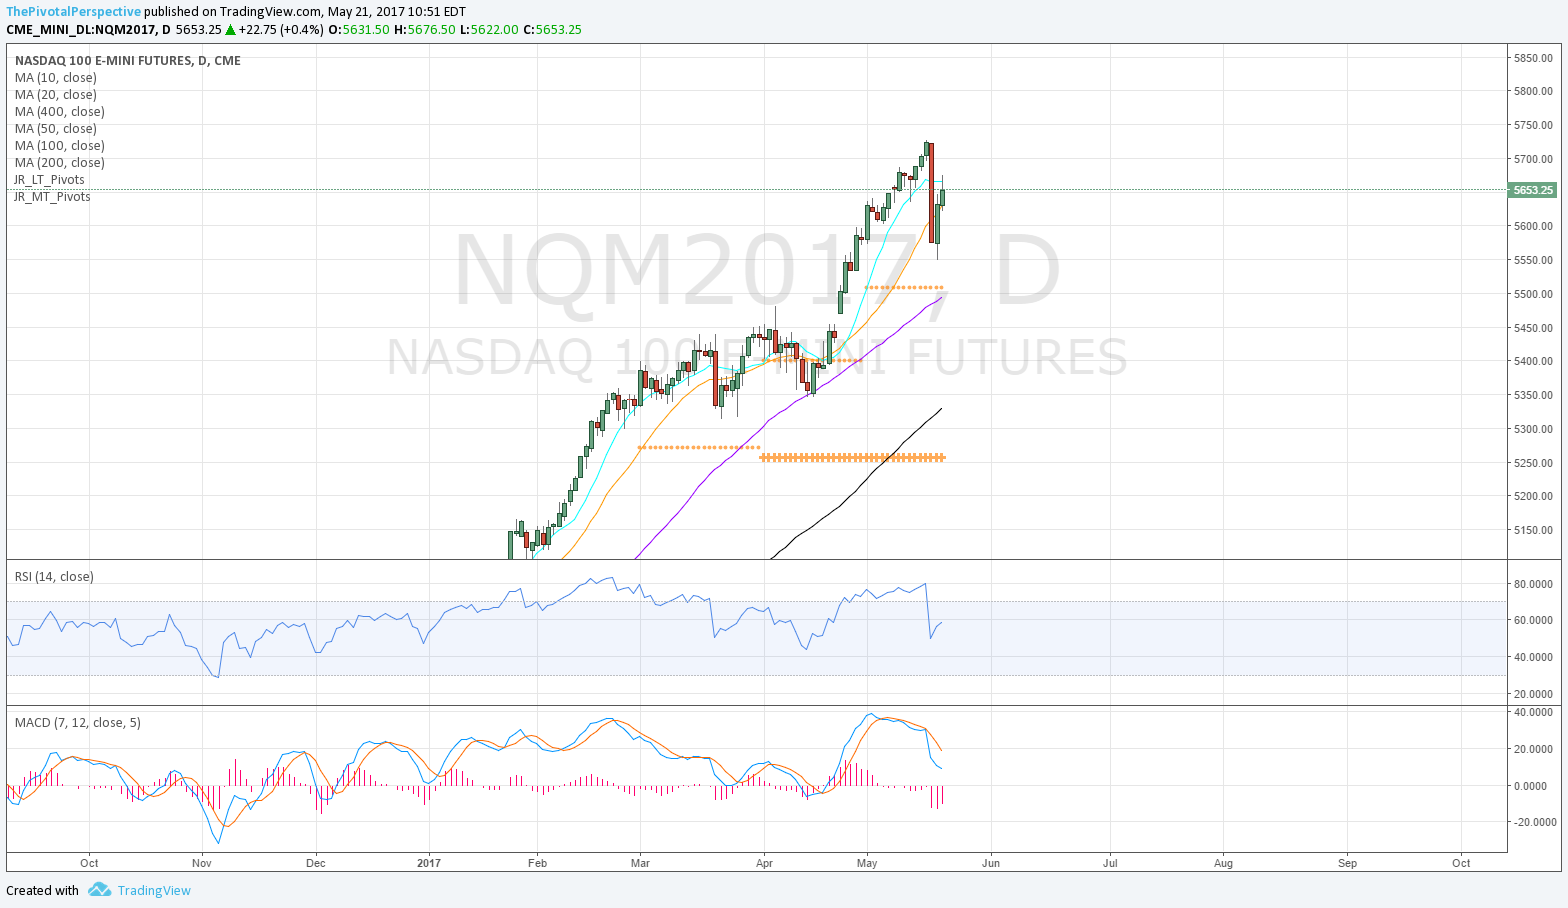
21 1 SPX Q.png
21 3 SPY D.png
21 5 ES D.png
21 4 SPY 2H.png

NDX QQQ
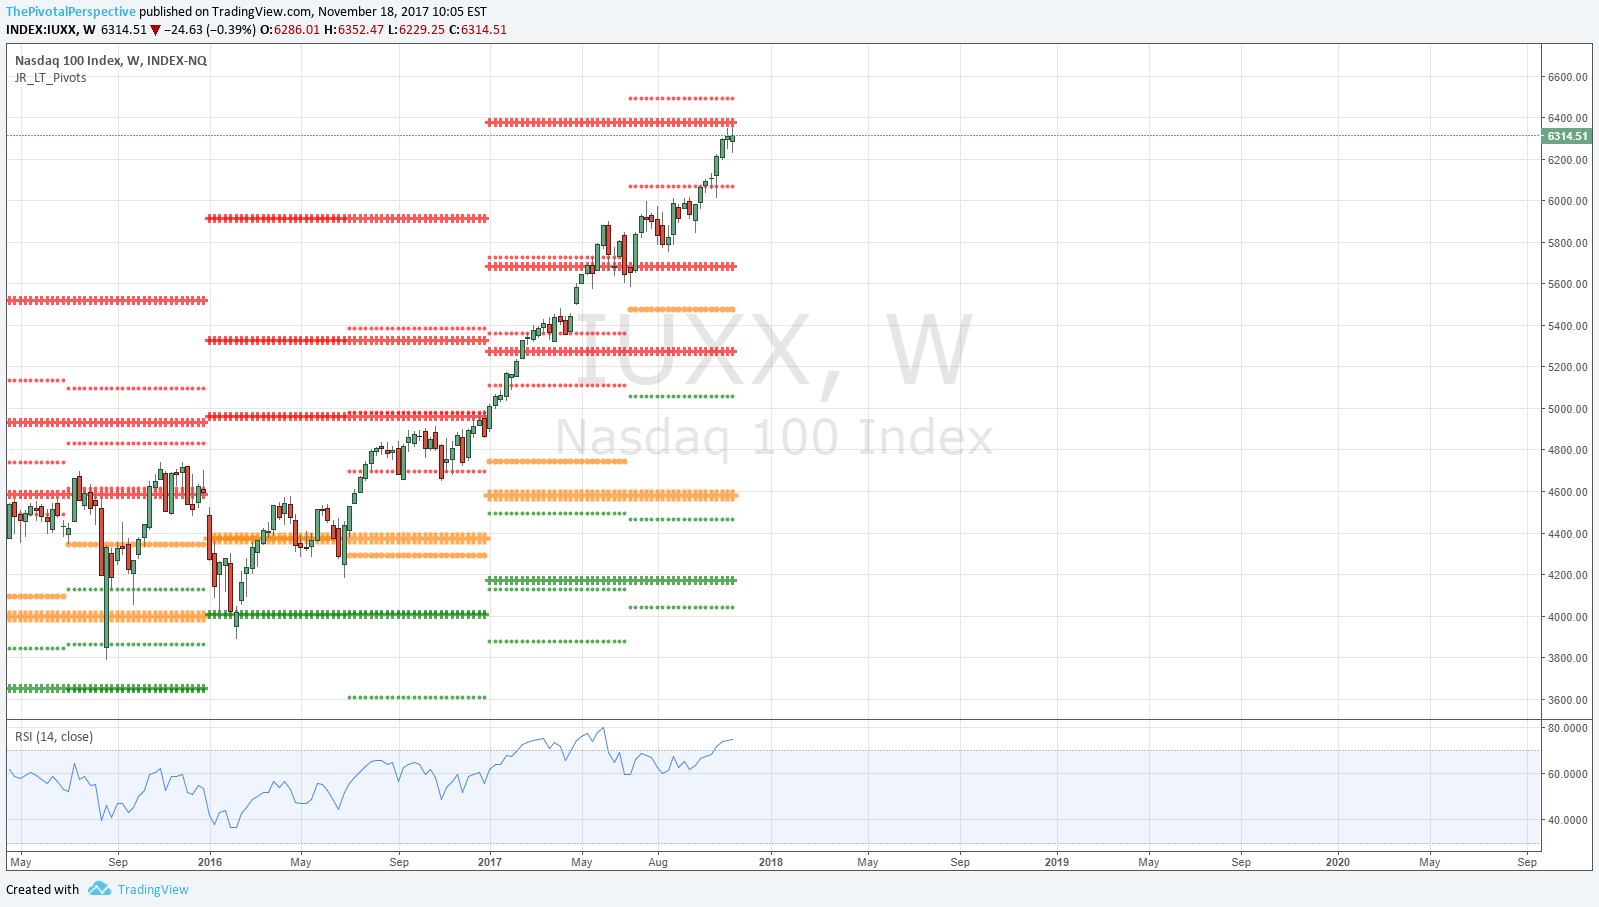
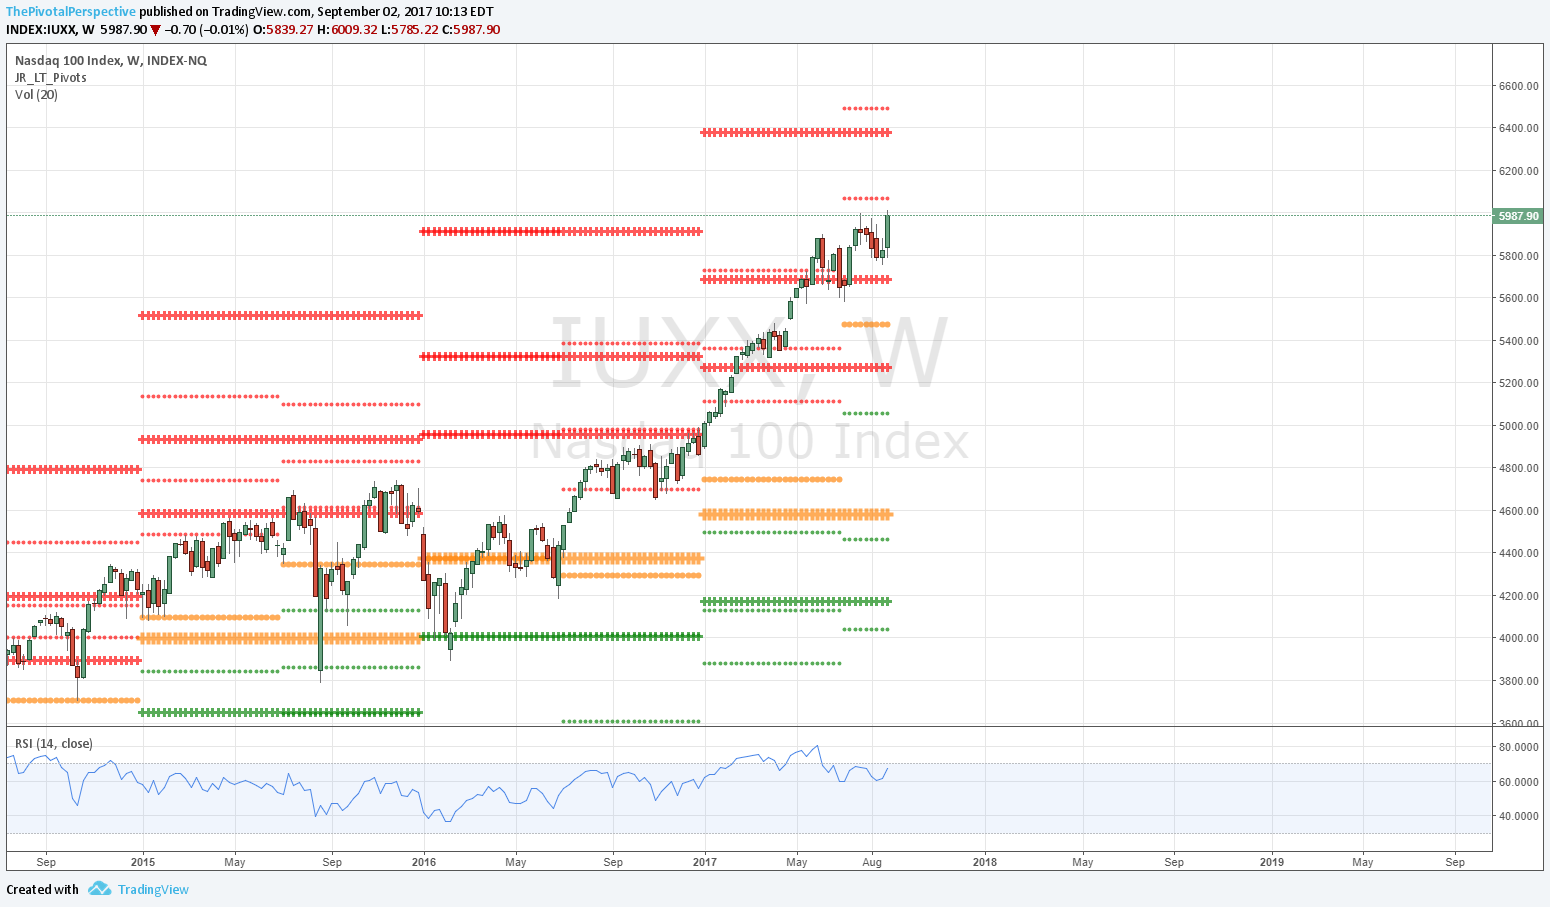
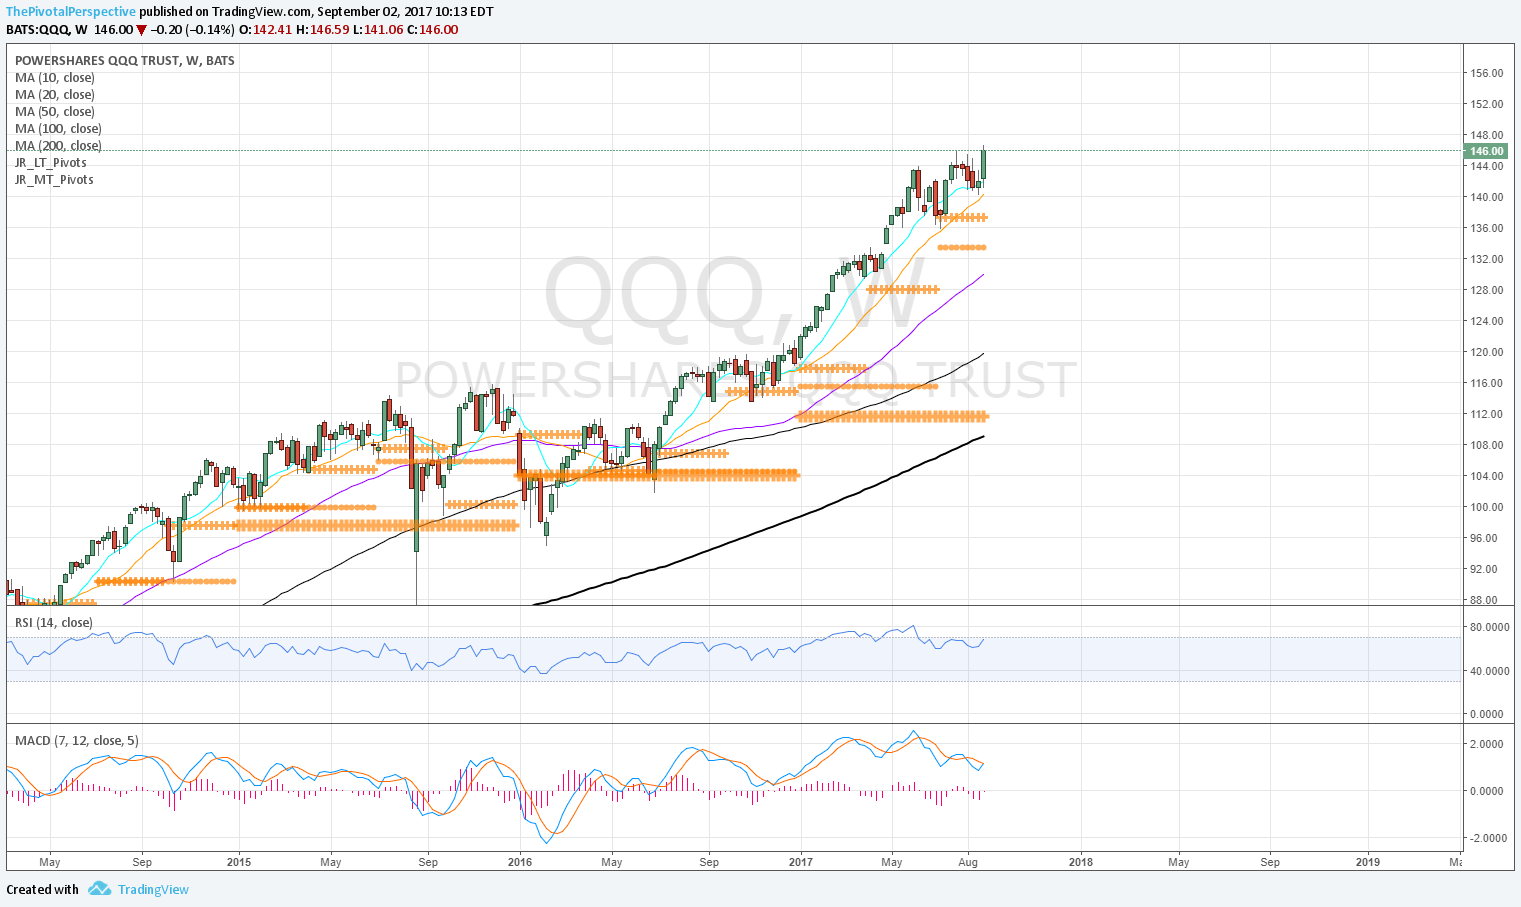
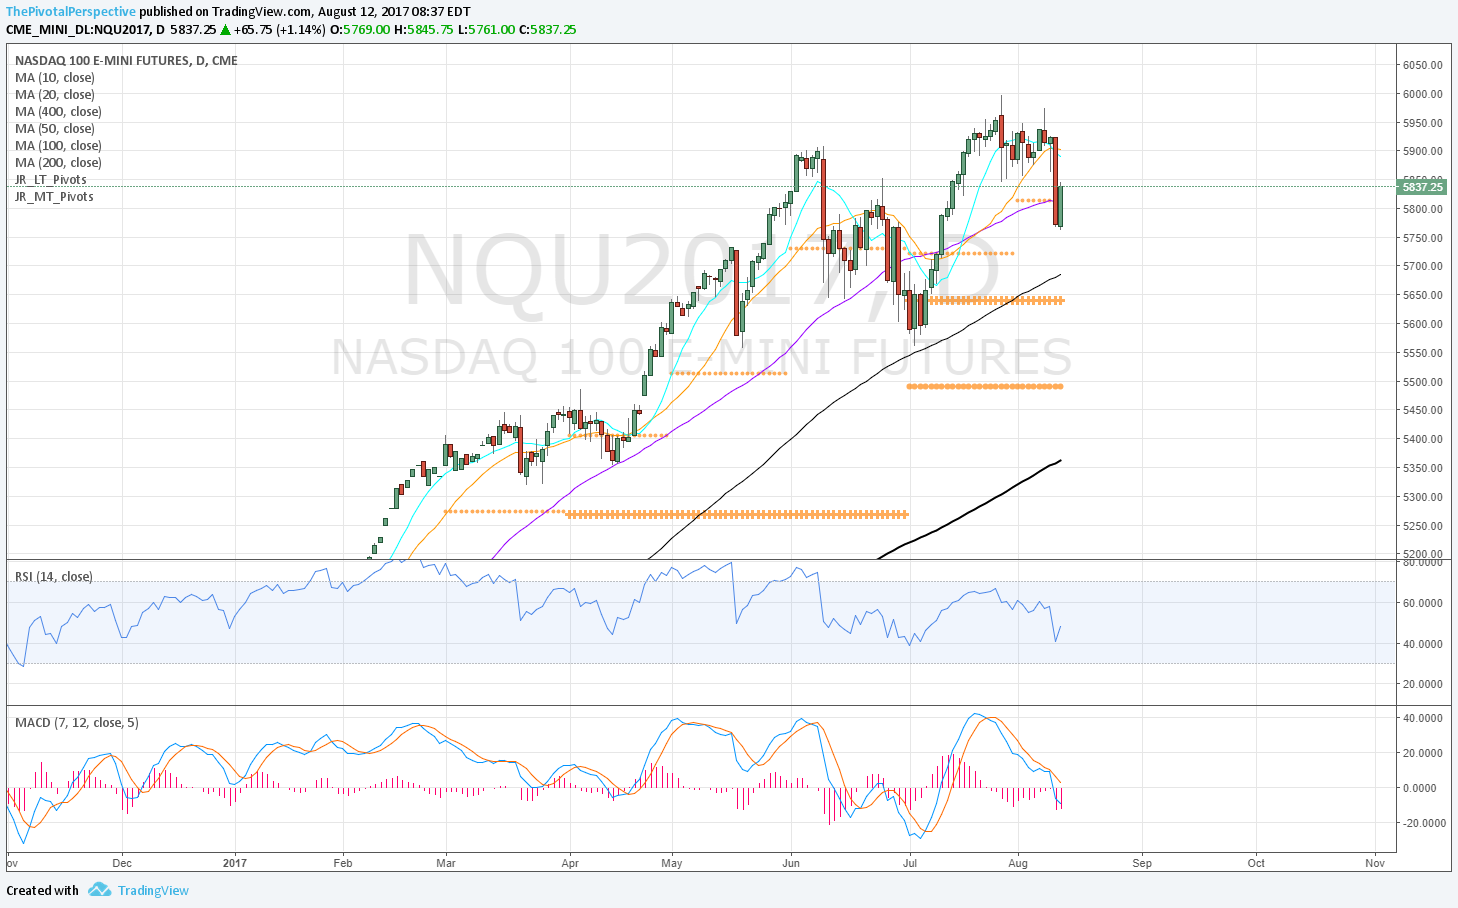
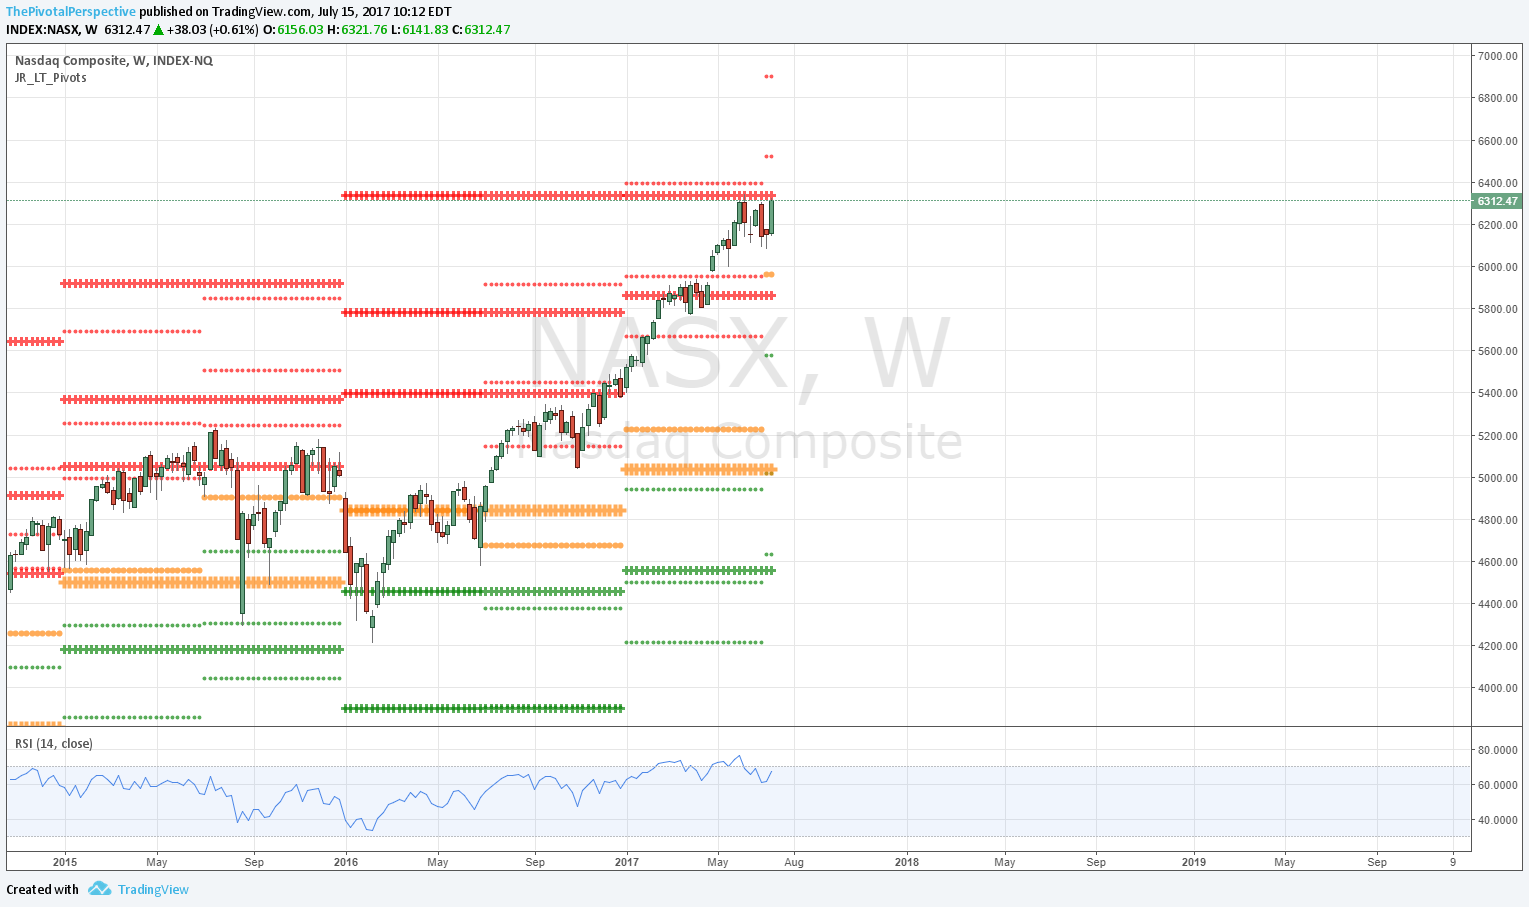
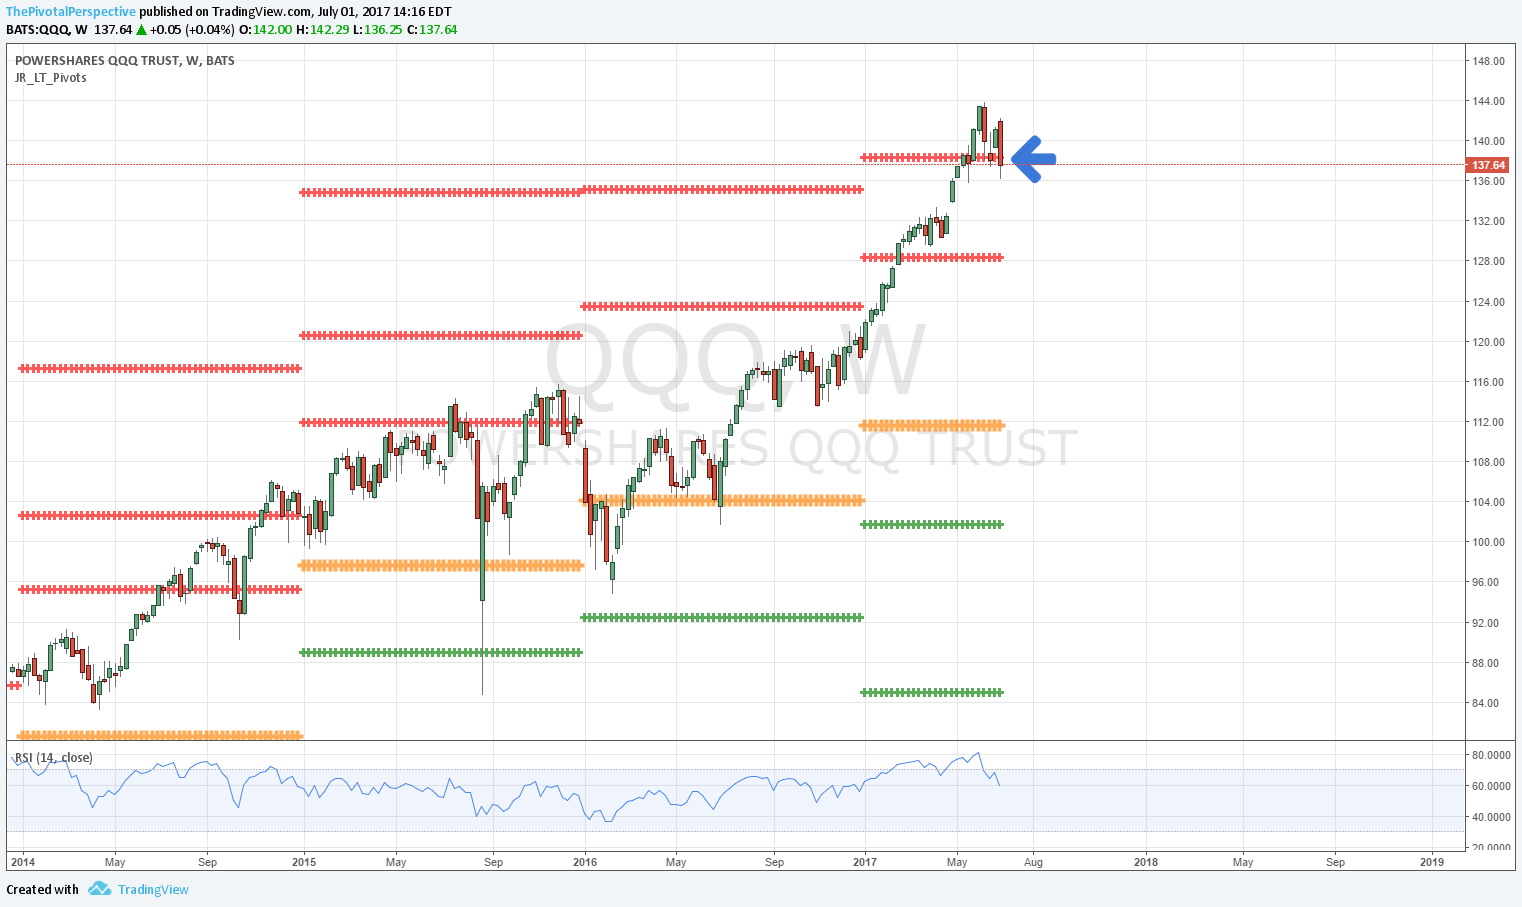
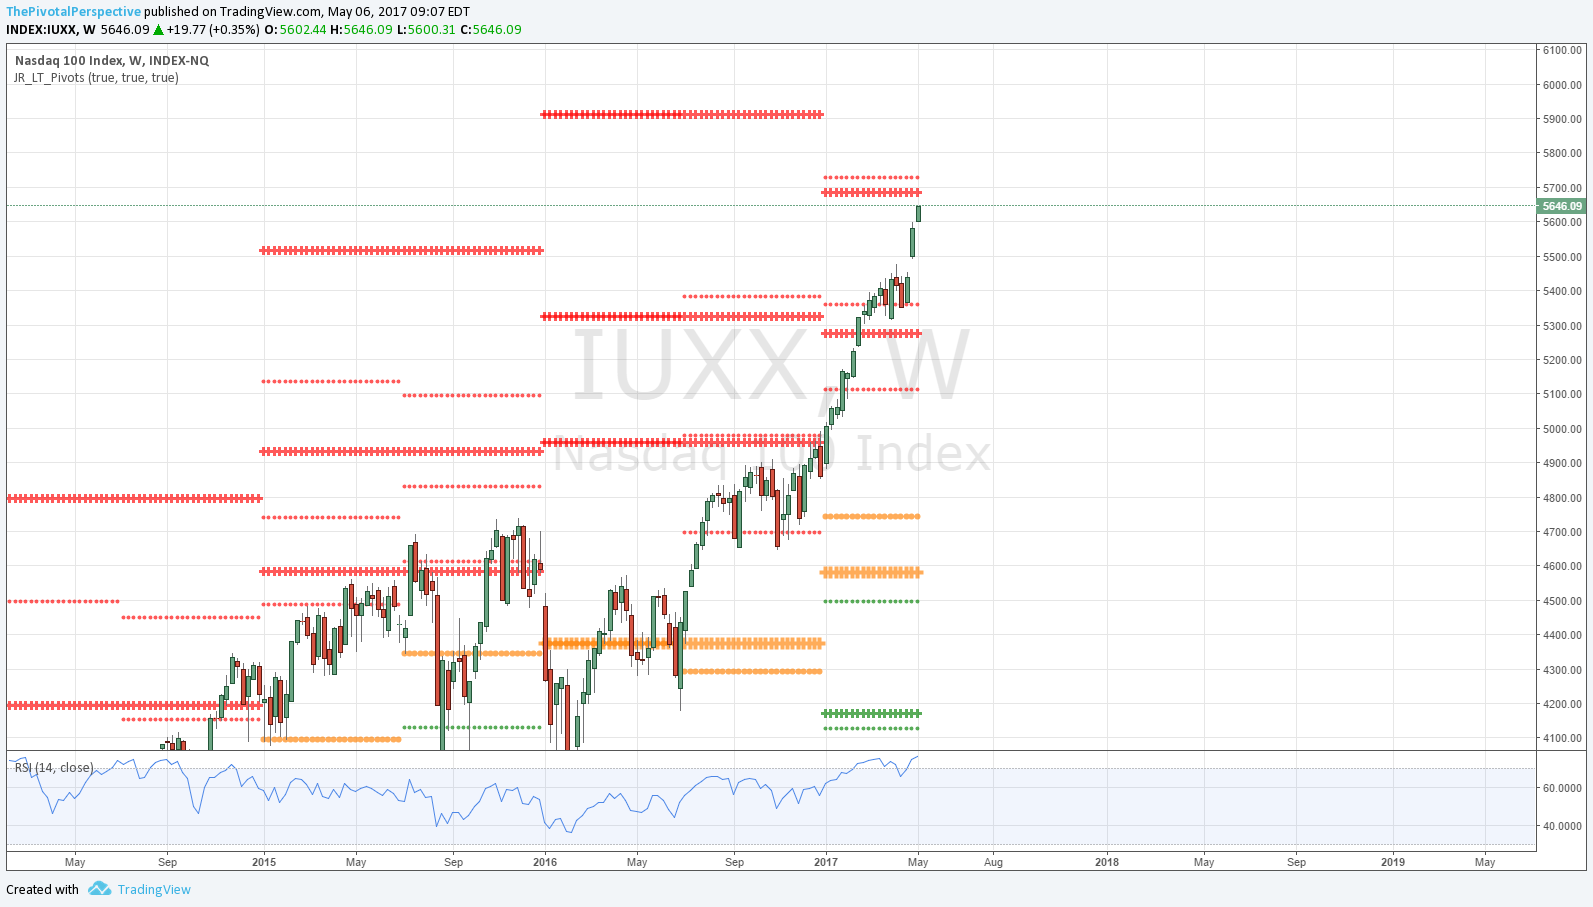
NDX Q: Q RSI 89.98 - pro selling at 90 area possible. 
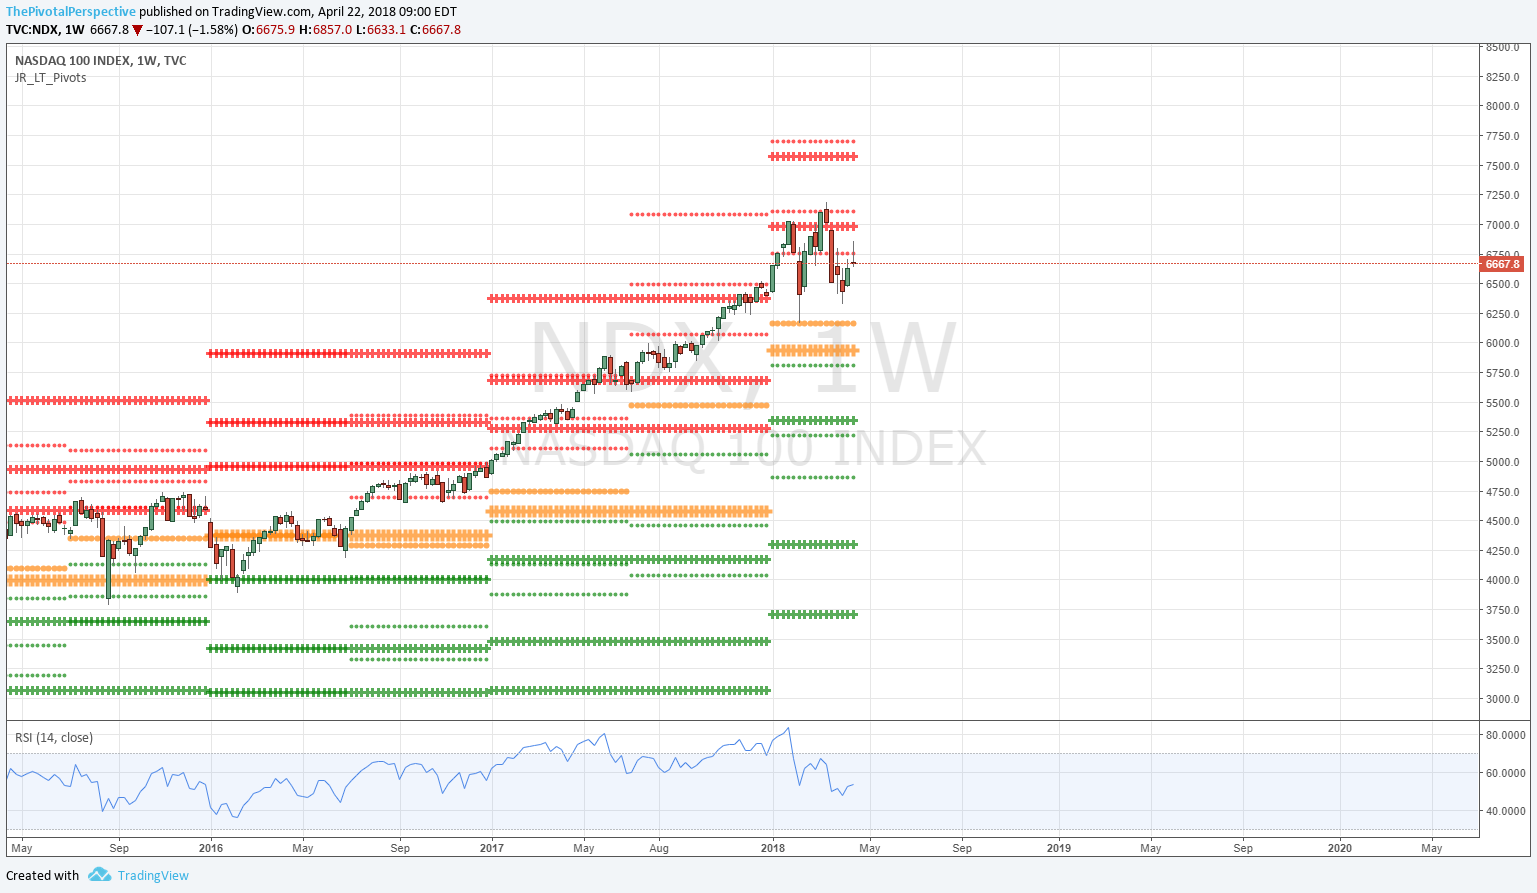
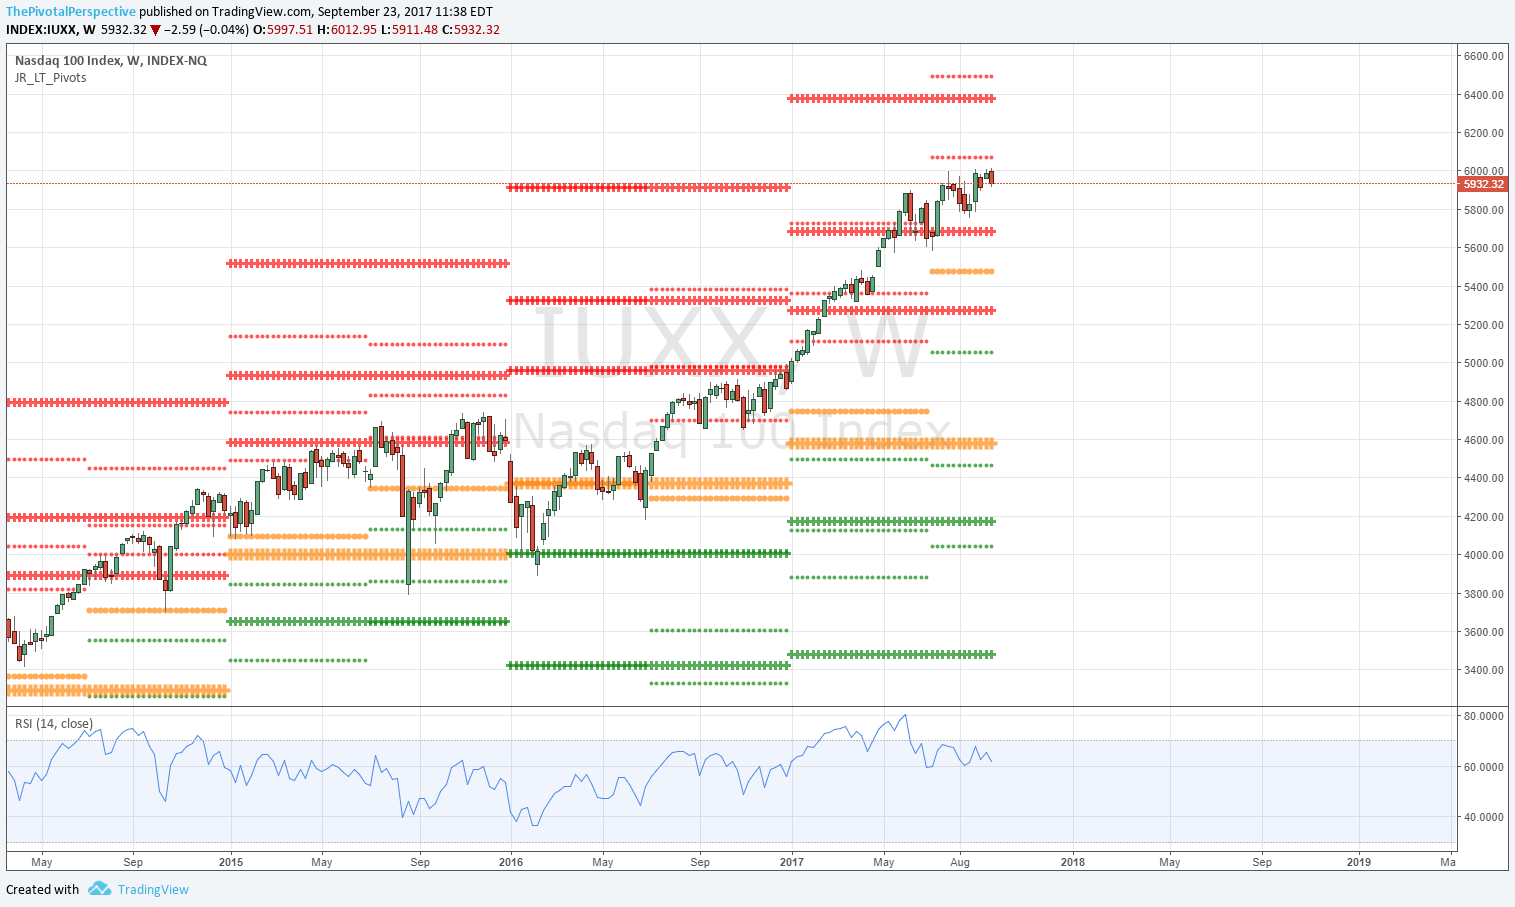
NDX W: Healthy lift above YR1 in the 2H so far - enough juice to reach HR1 near 7500?
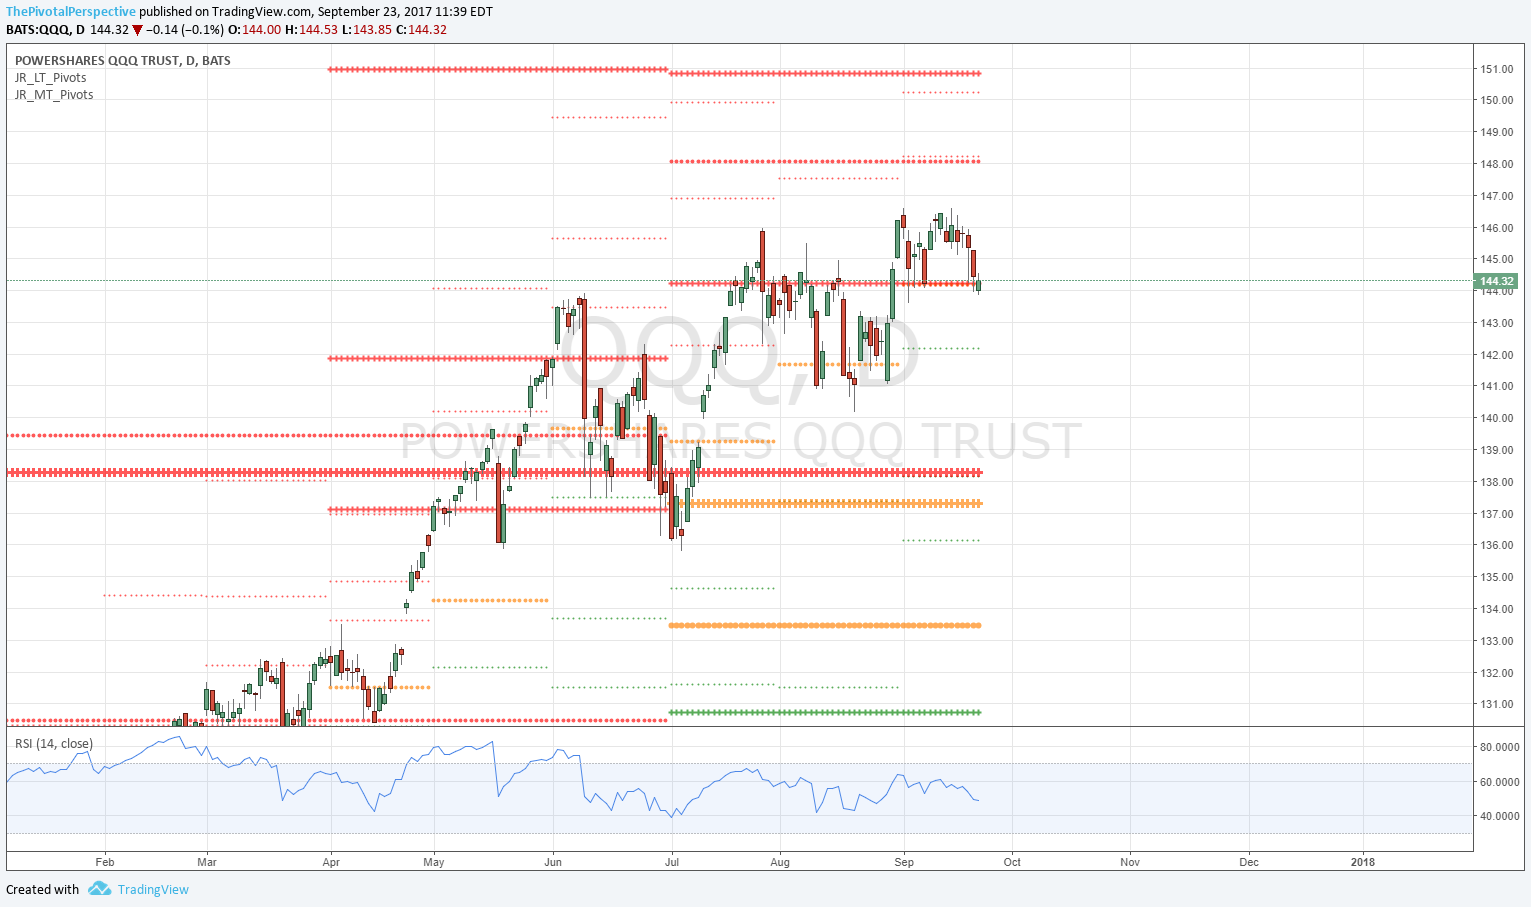
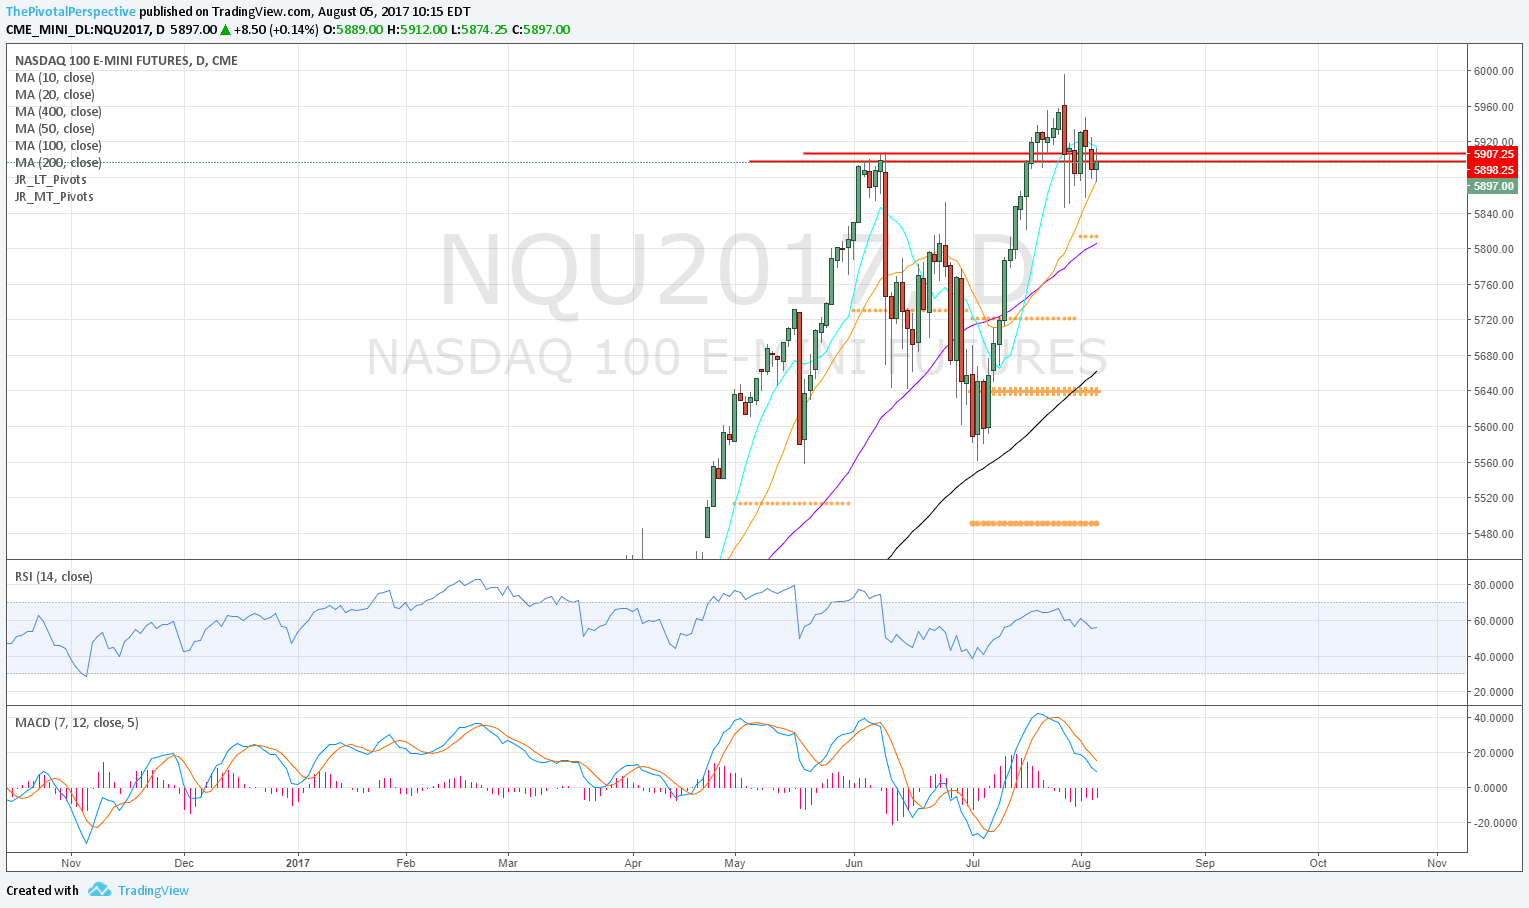
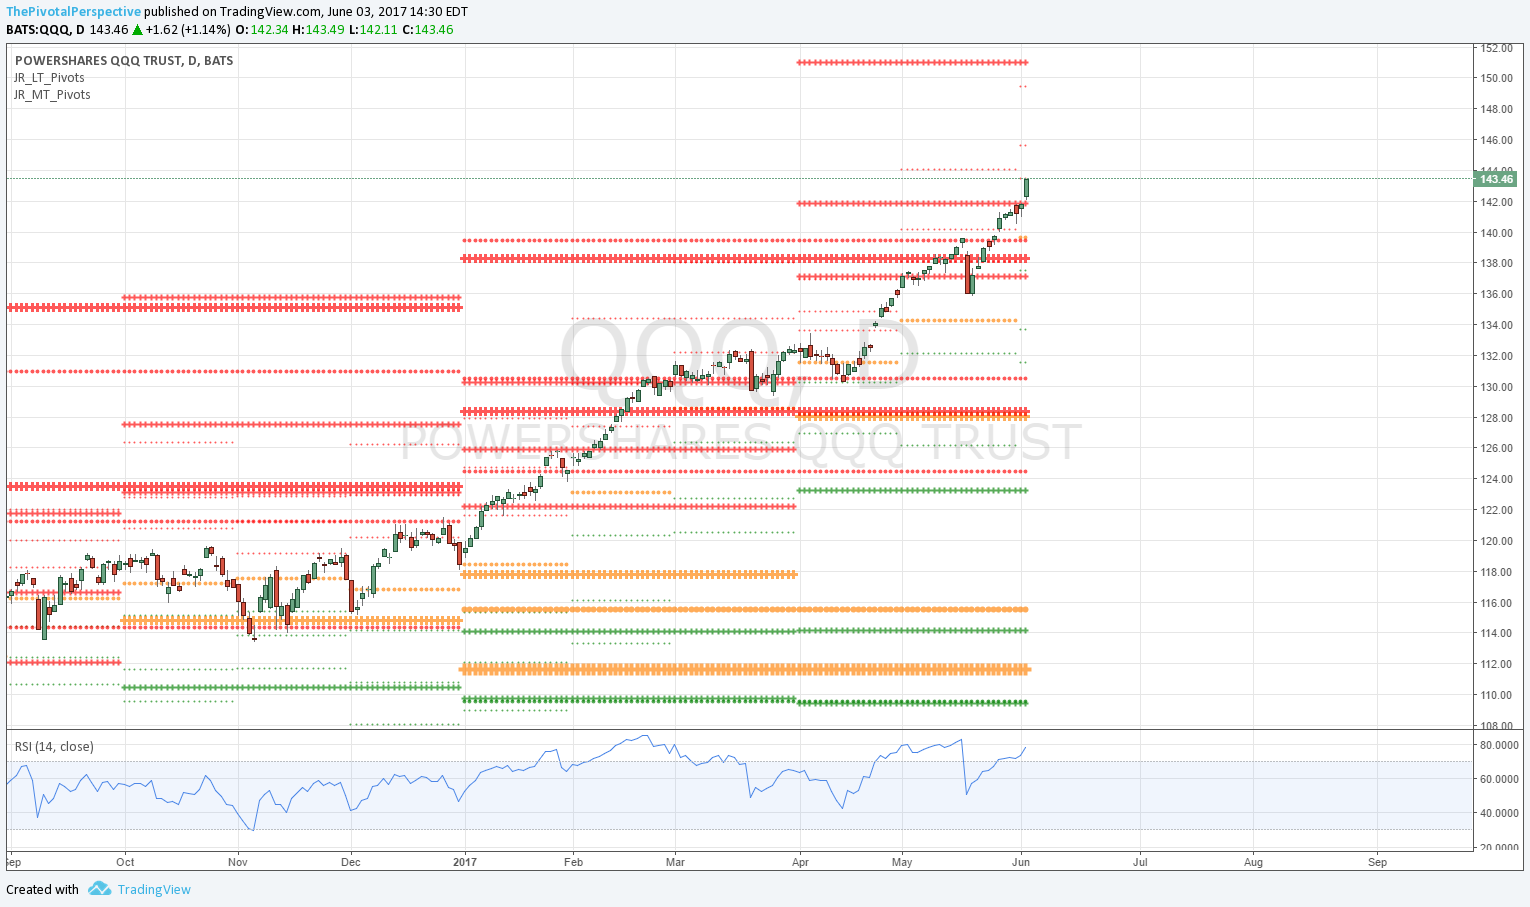
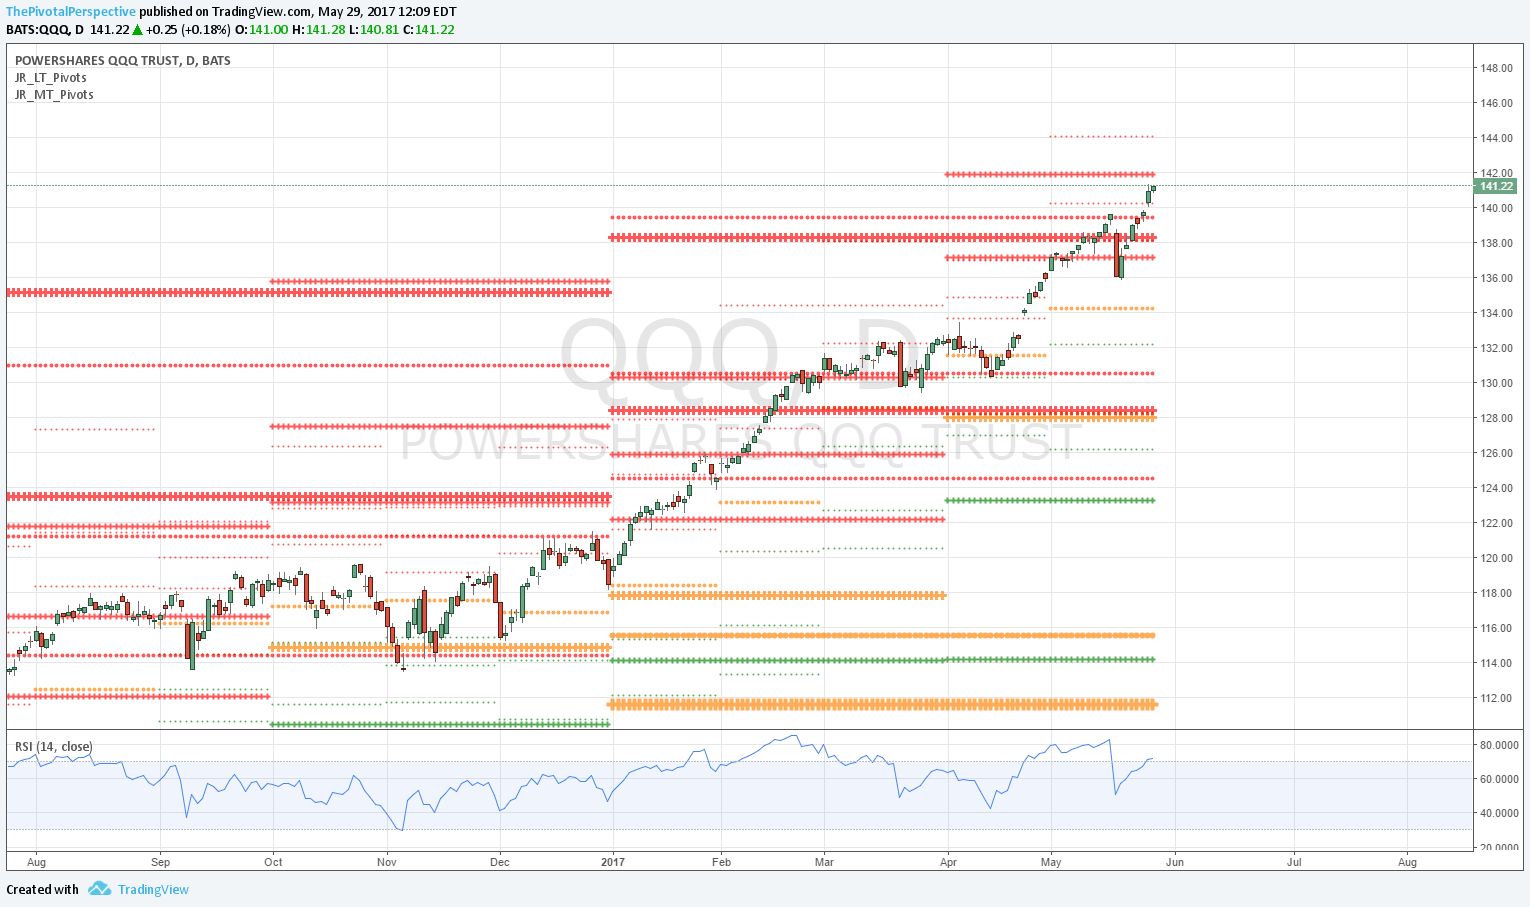
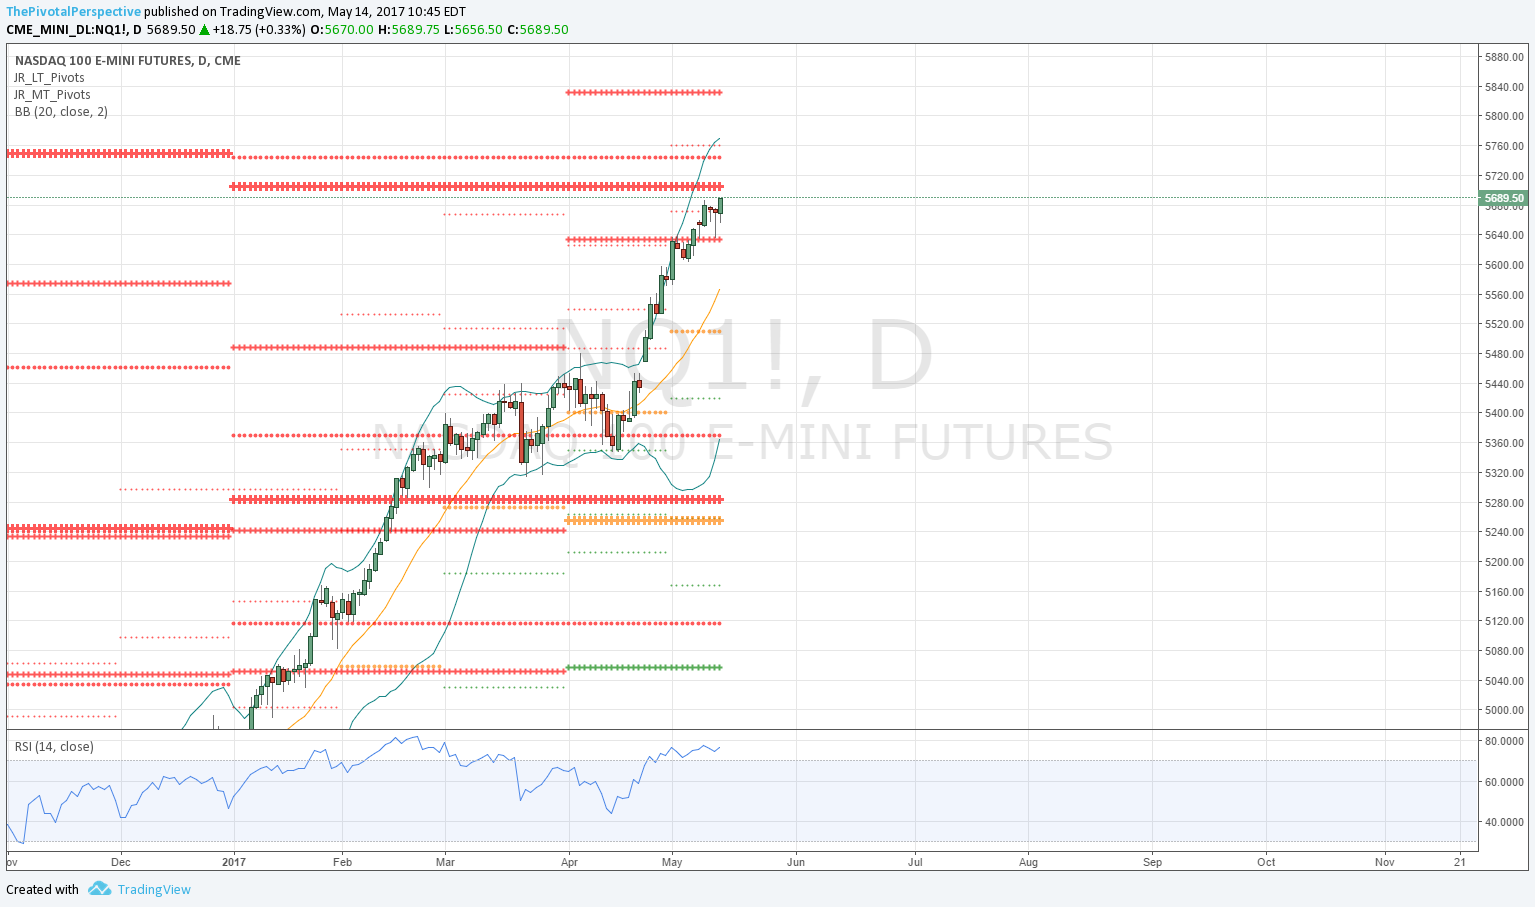
QQQ D: Resistance cluster QR1, HR1 and YR2 182-184.
QQQ 2H: All above WP from 7/5; dip below last week quickly recovered. 
NDX sum: Still expecting this to reach QR1 HR1 YR2 area 7460-7570 on NDX and 182-184 on NDX sum. Tech has been amazing but people who think it is going up forever with Q RSI at 90 area are delirious.

21 6 NDX Q.png
21 7 NDX W.png
21 8 QQQ D.png

DJI DIA
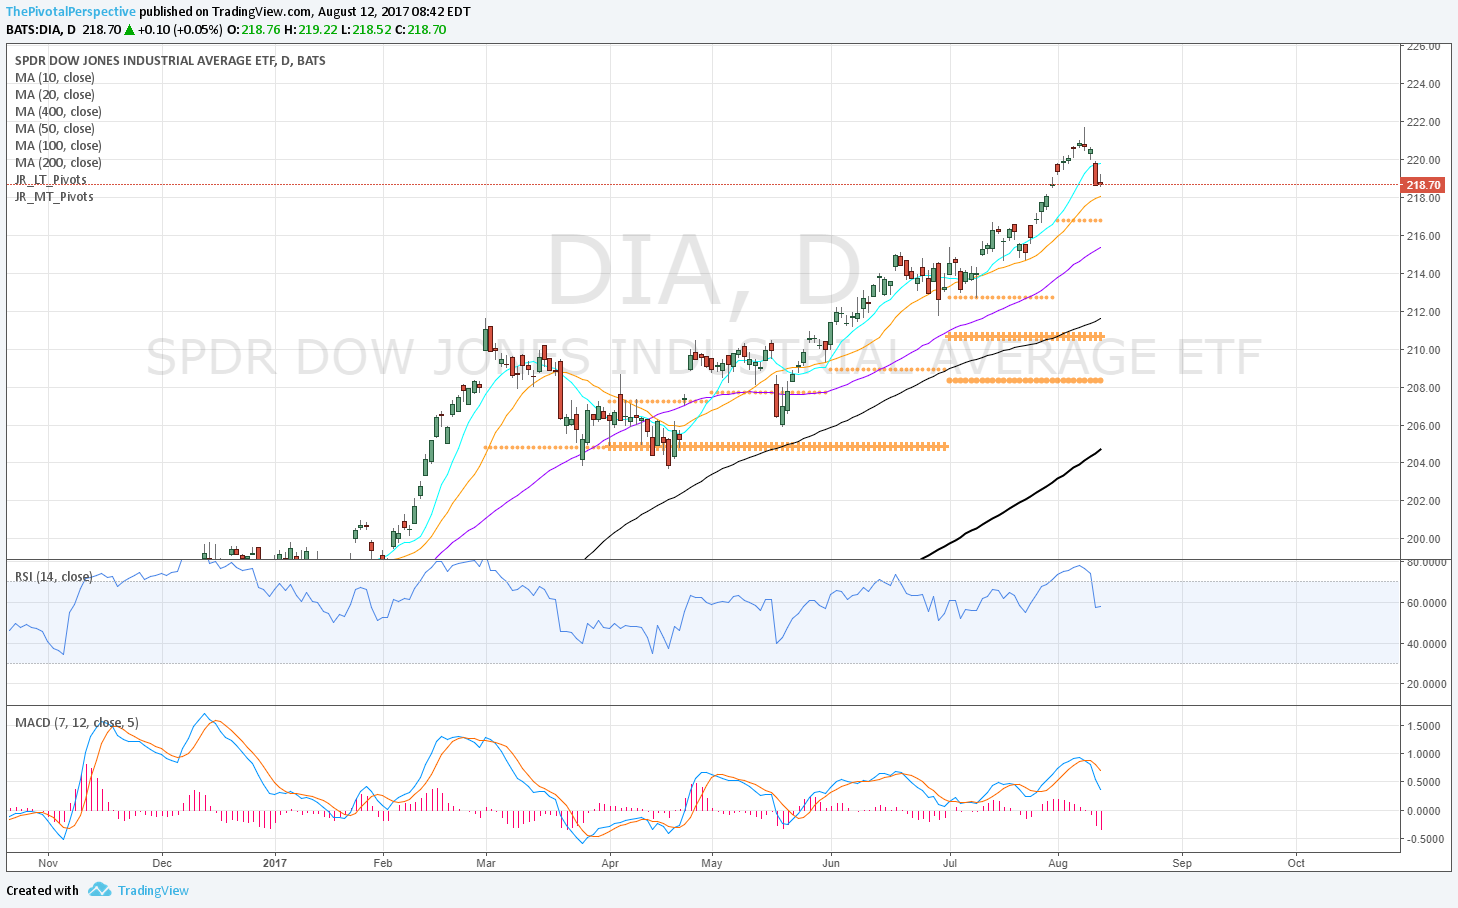
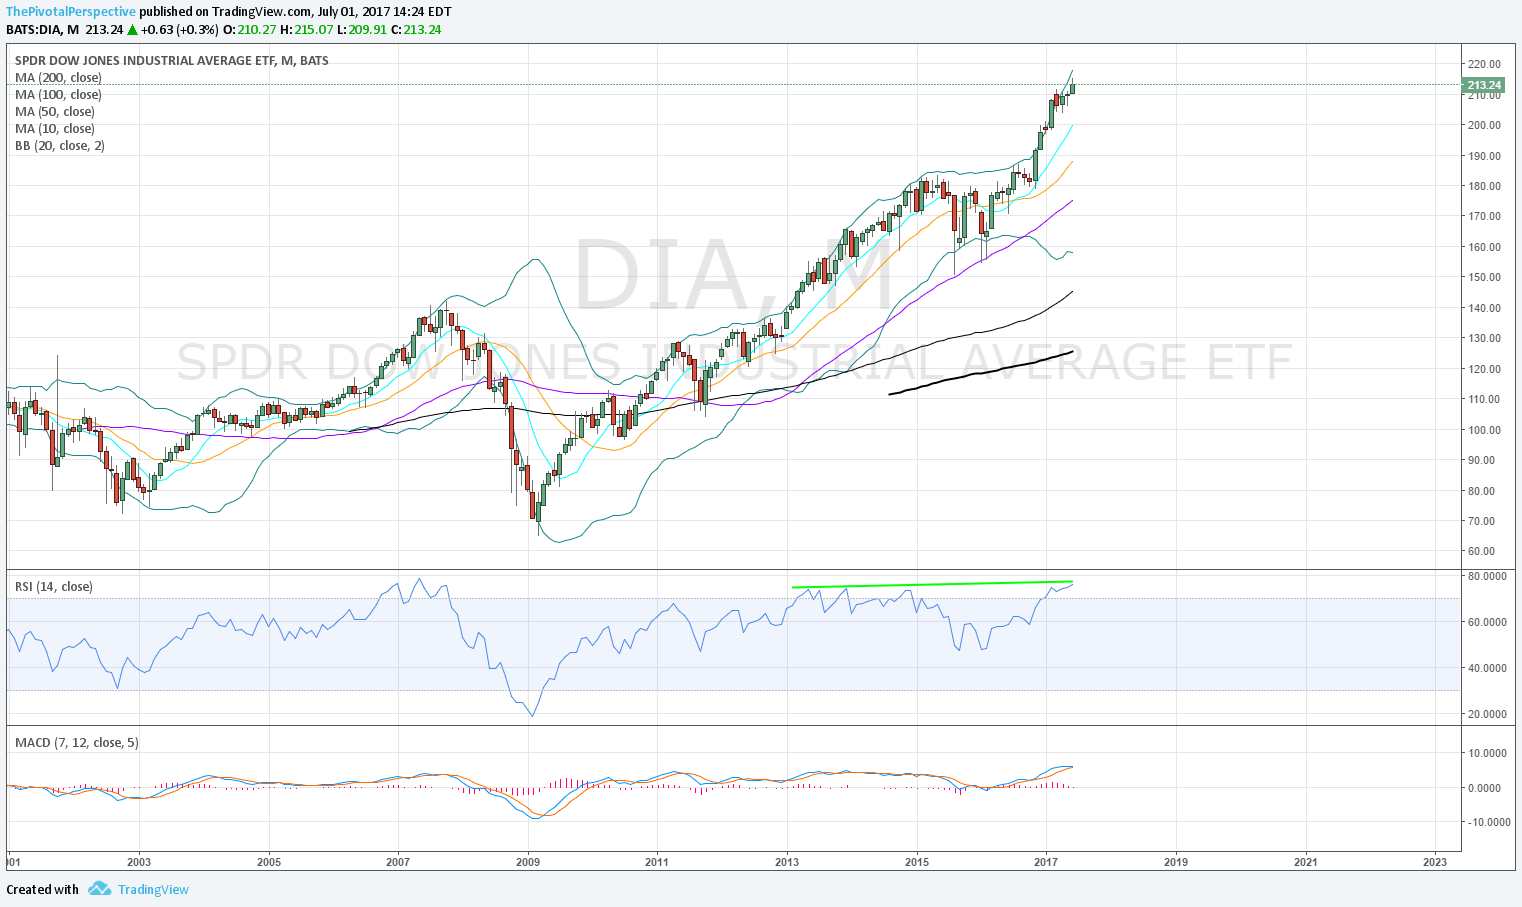
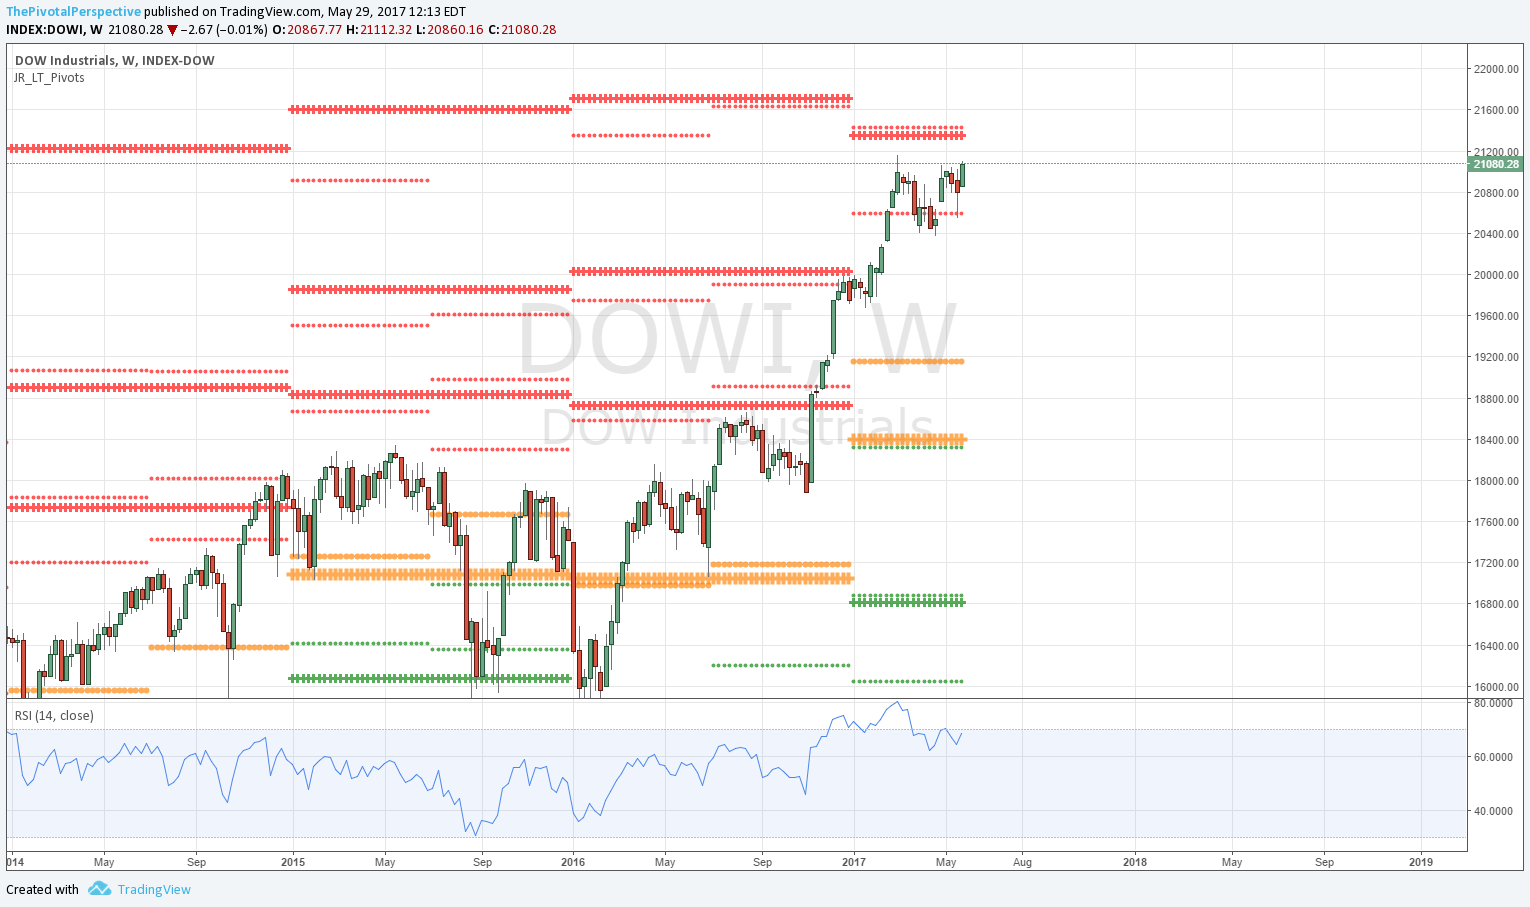
DJI W: Recovered above HP the 2nd week of the new half. 
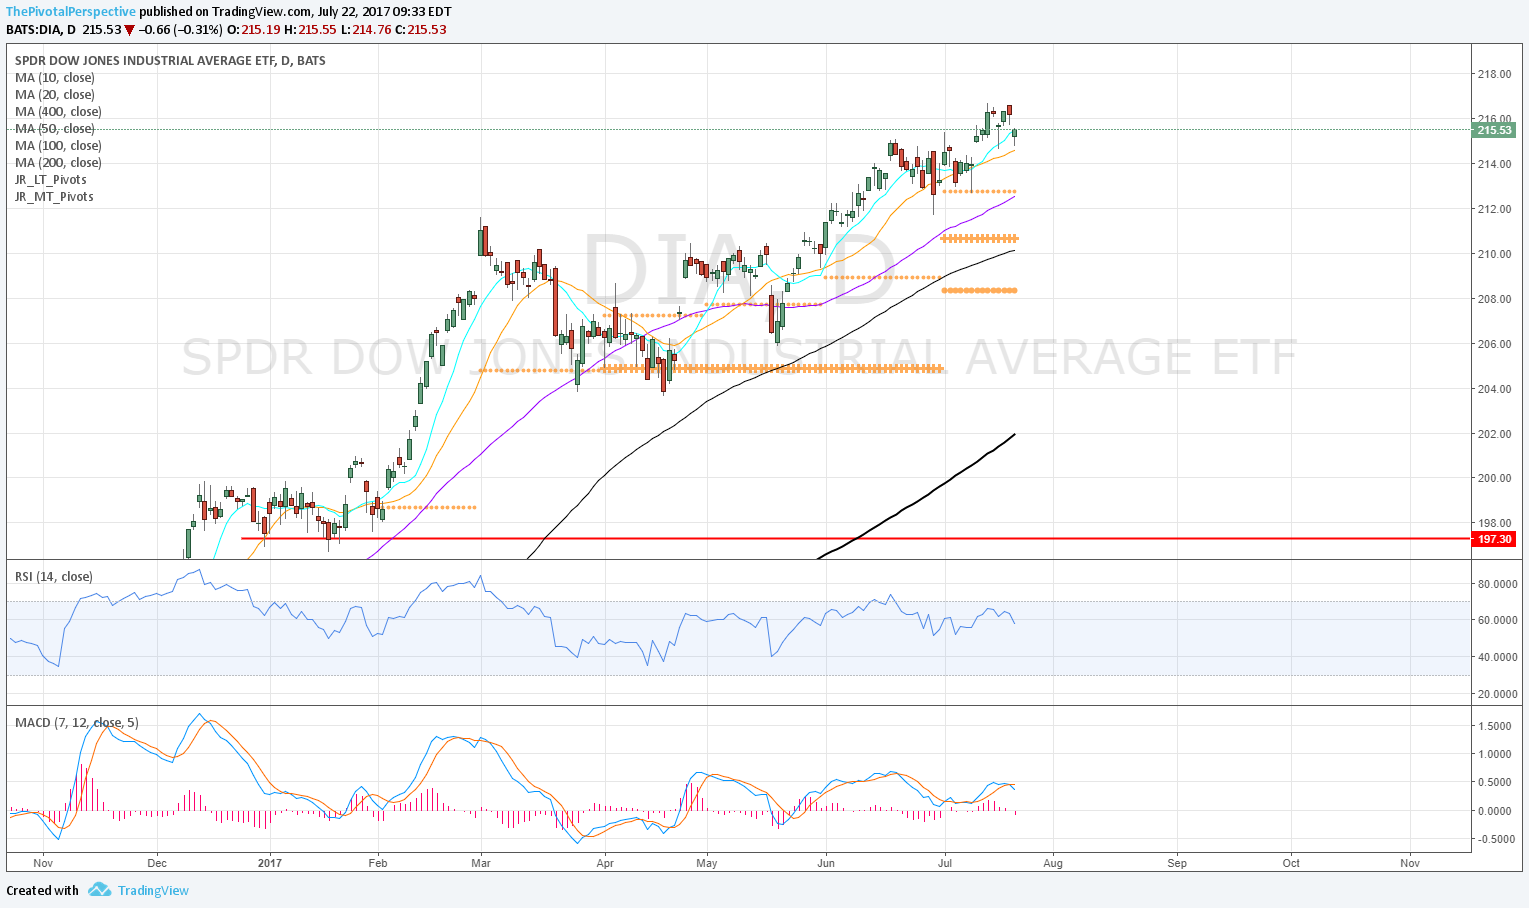
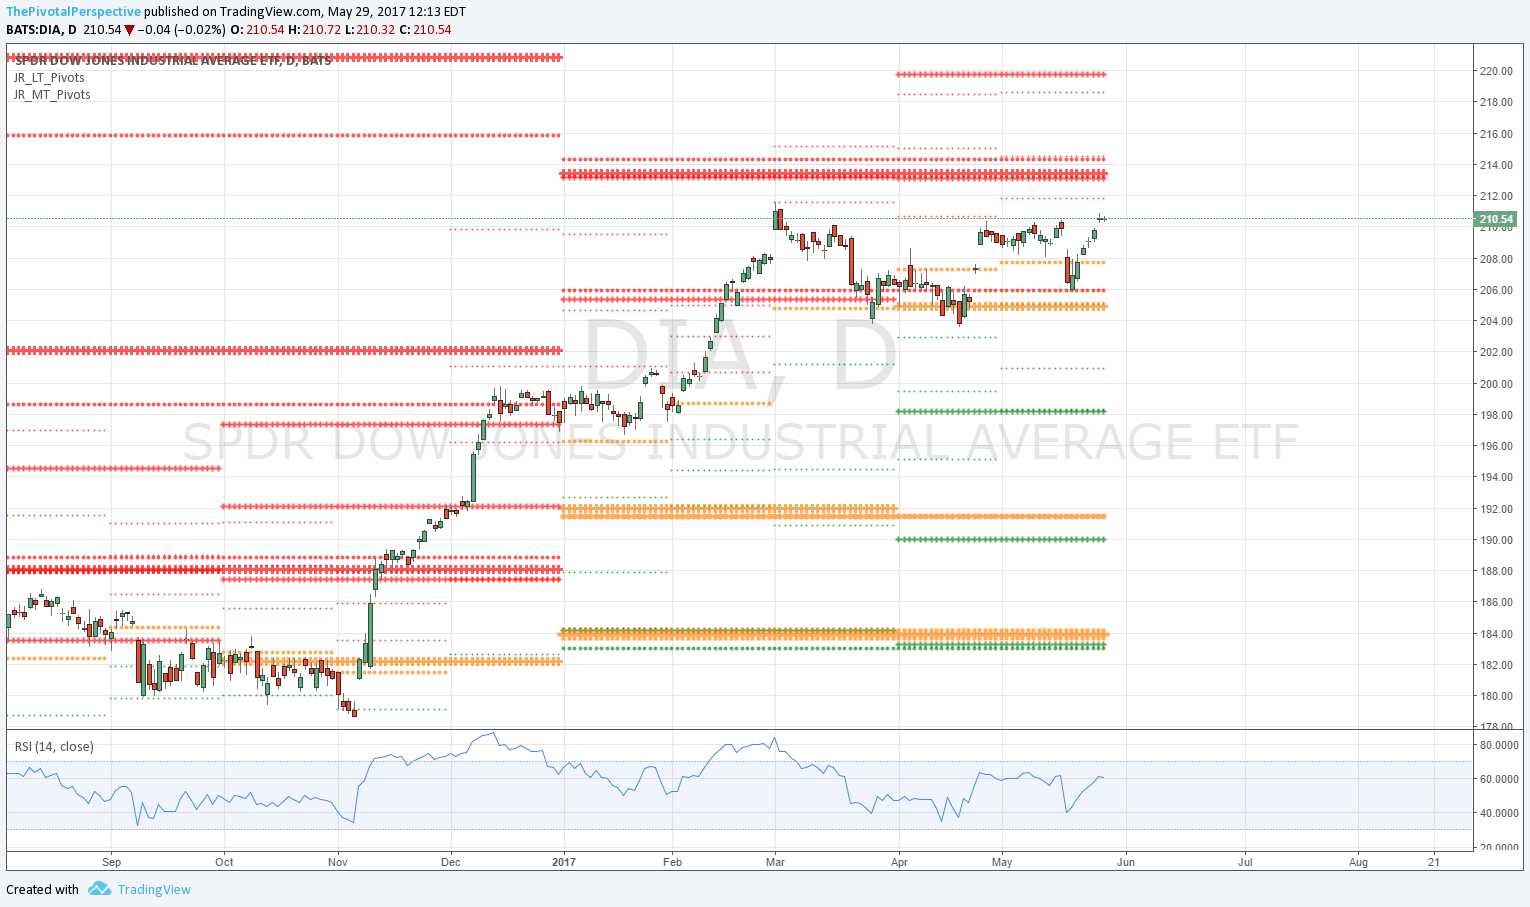
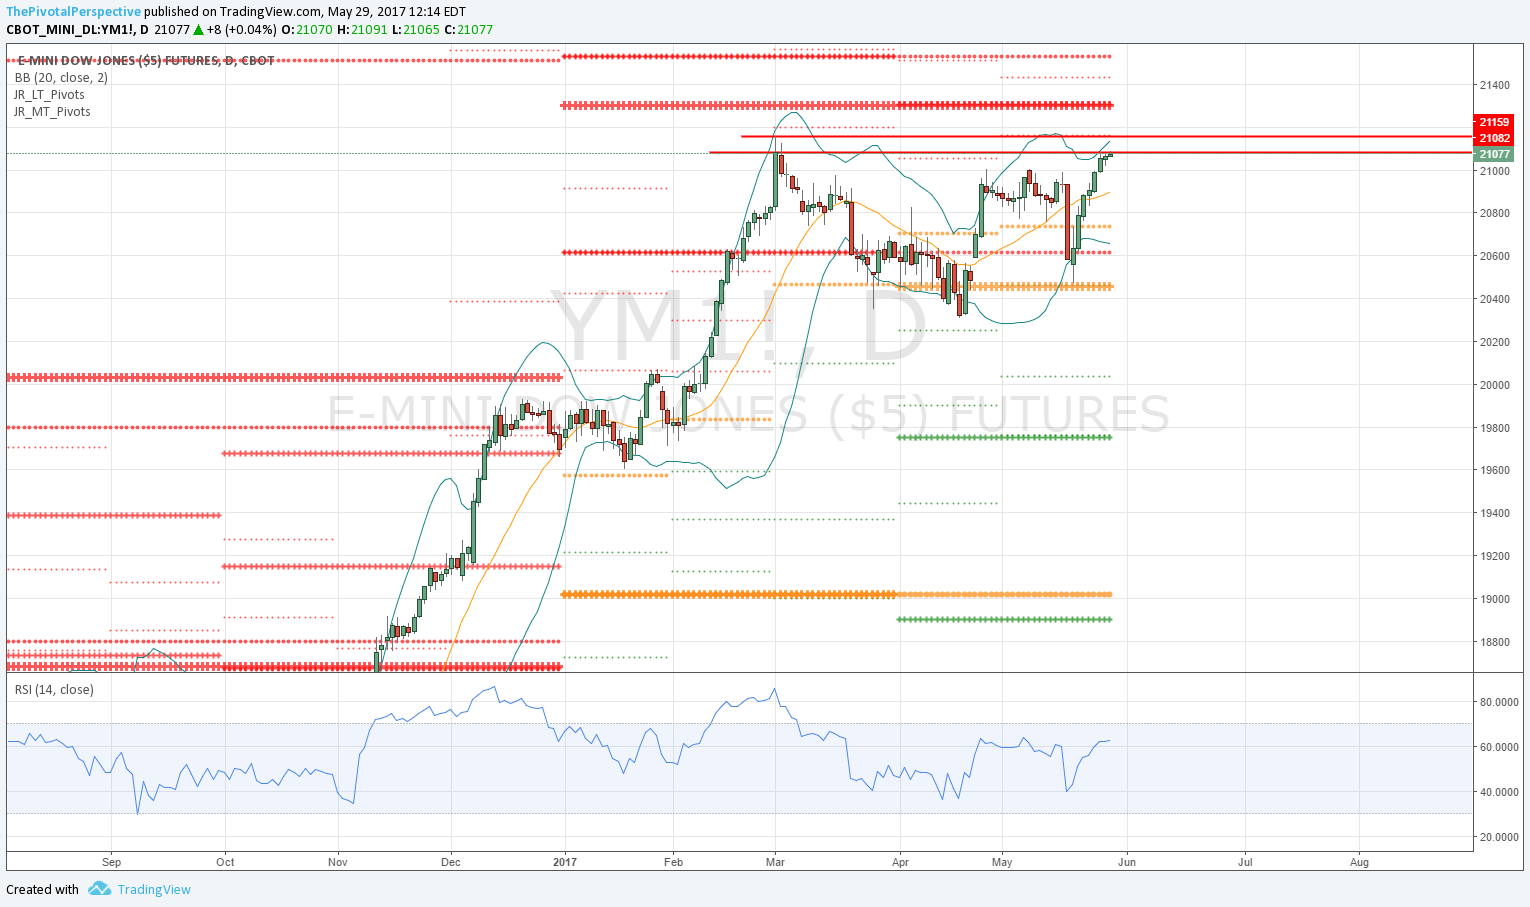
DIA D: 3 of last 4 days resistance at JulR1. If above that QR1 likely strong resistance. 
DJI sum: Weakest main index; below JulR1 can consider short hedge; if down will be first to have any long term weakness. 

21 11 DJI W.png
21 12 DIA D.png

RUT IWM
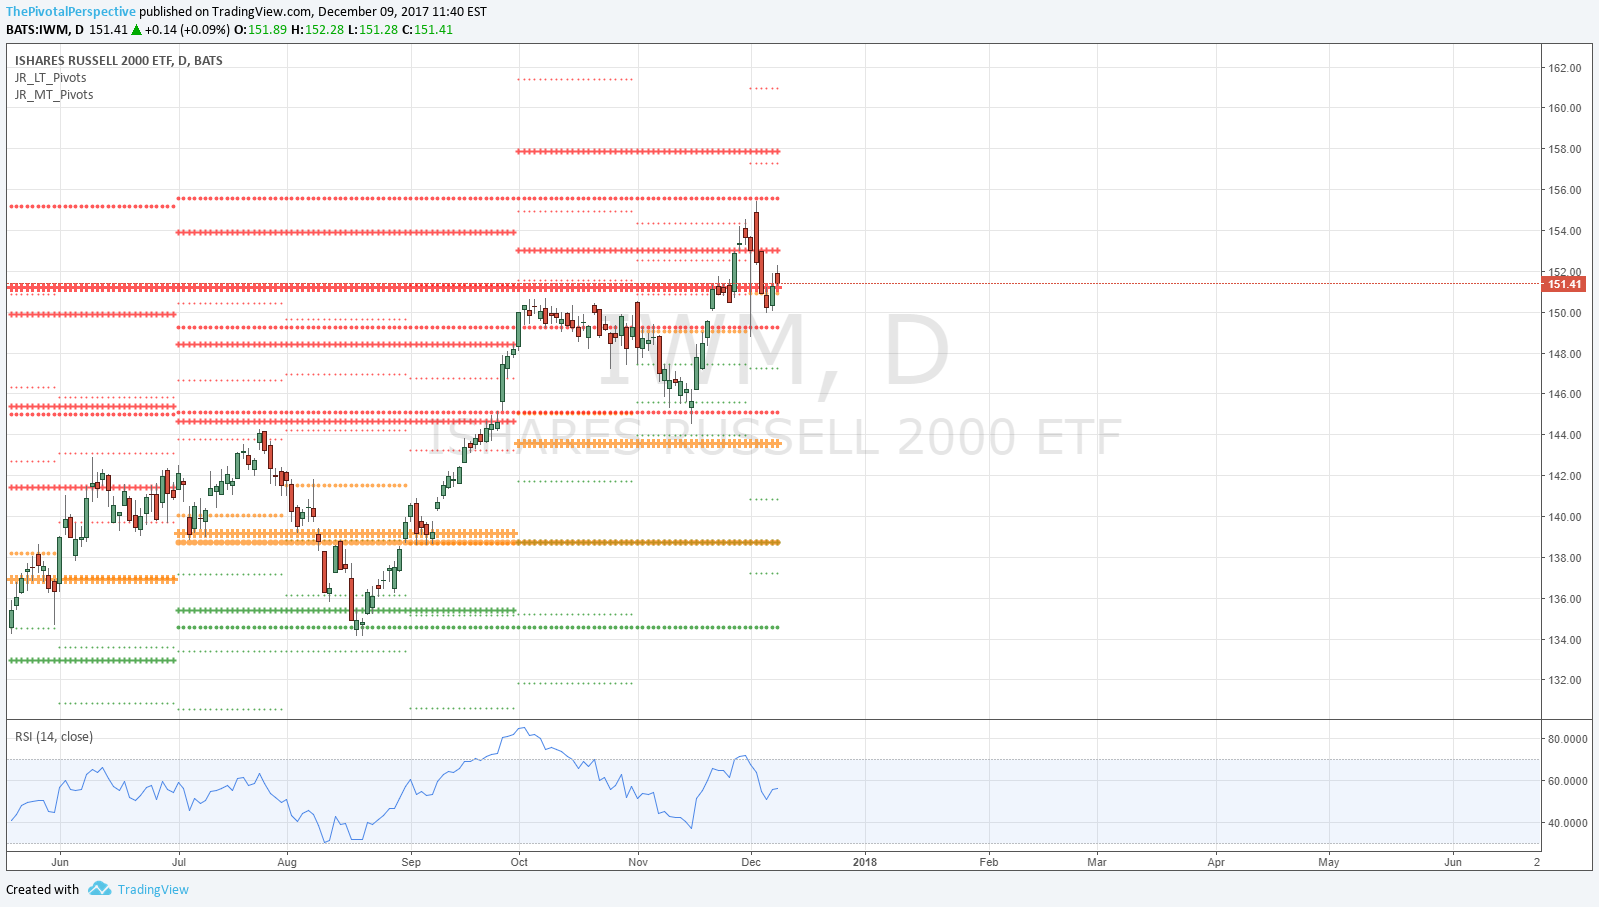
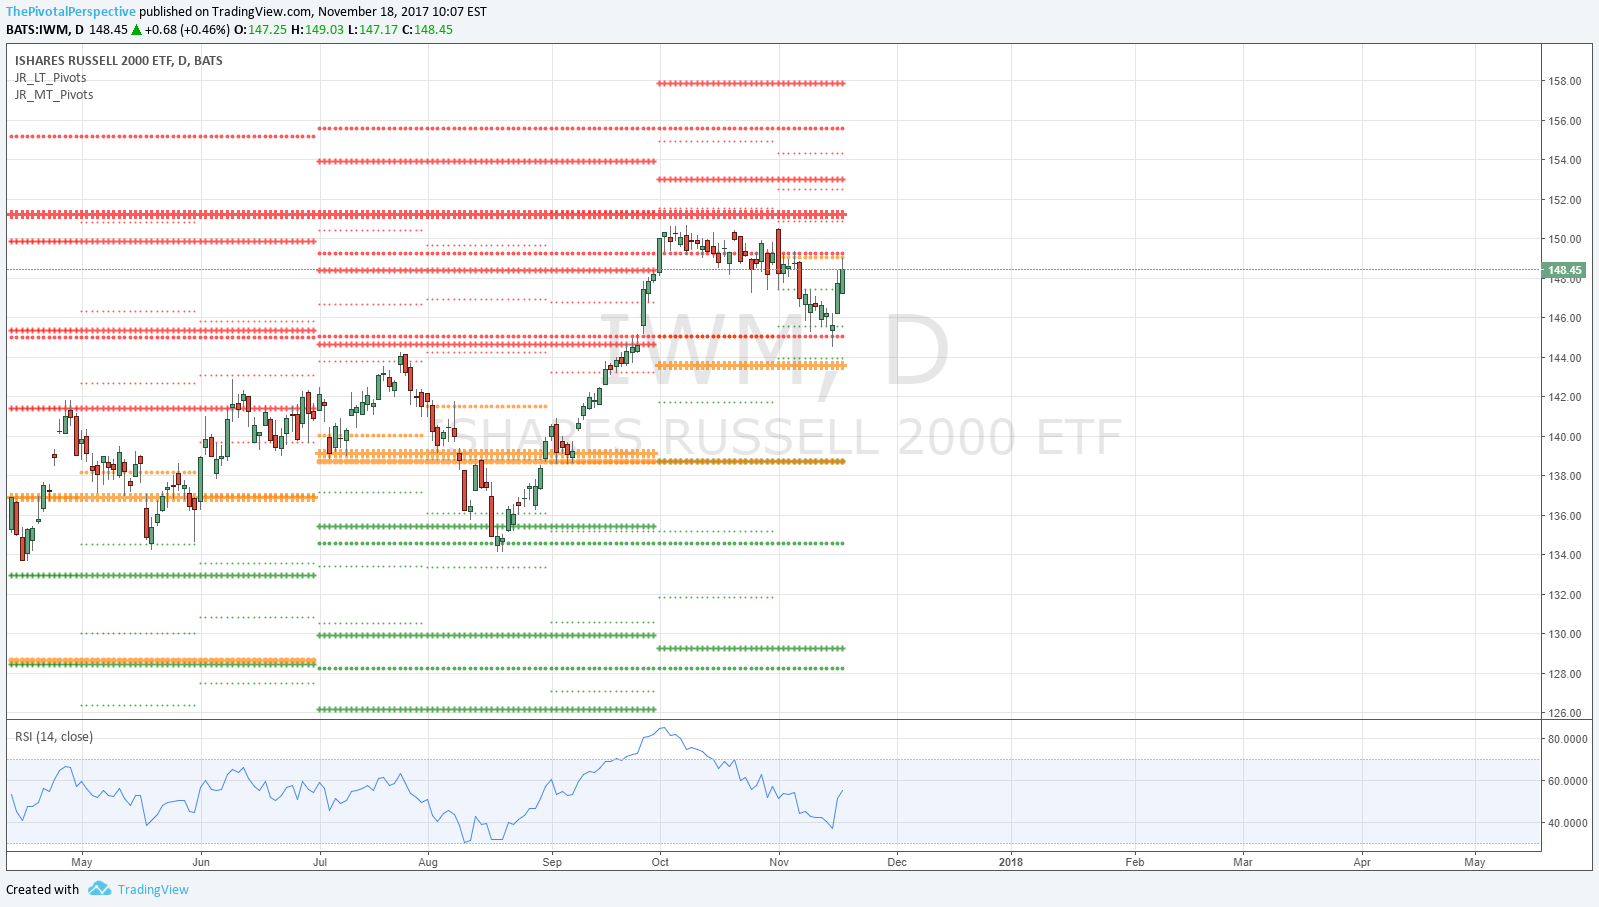
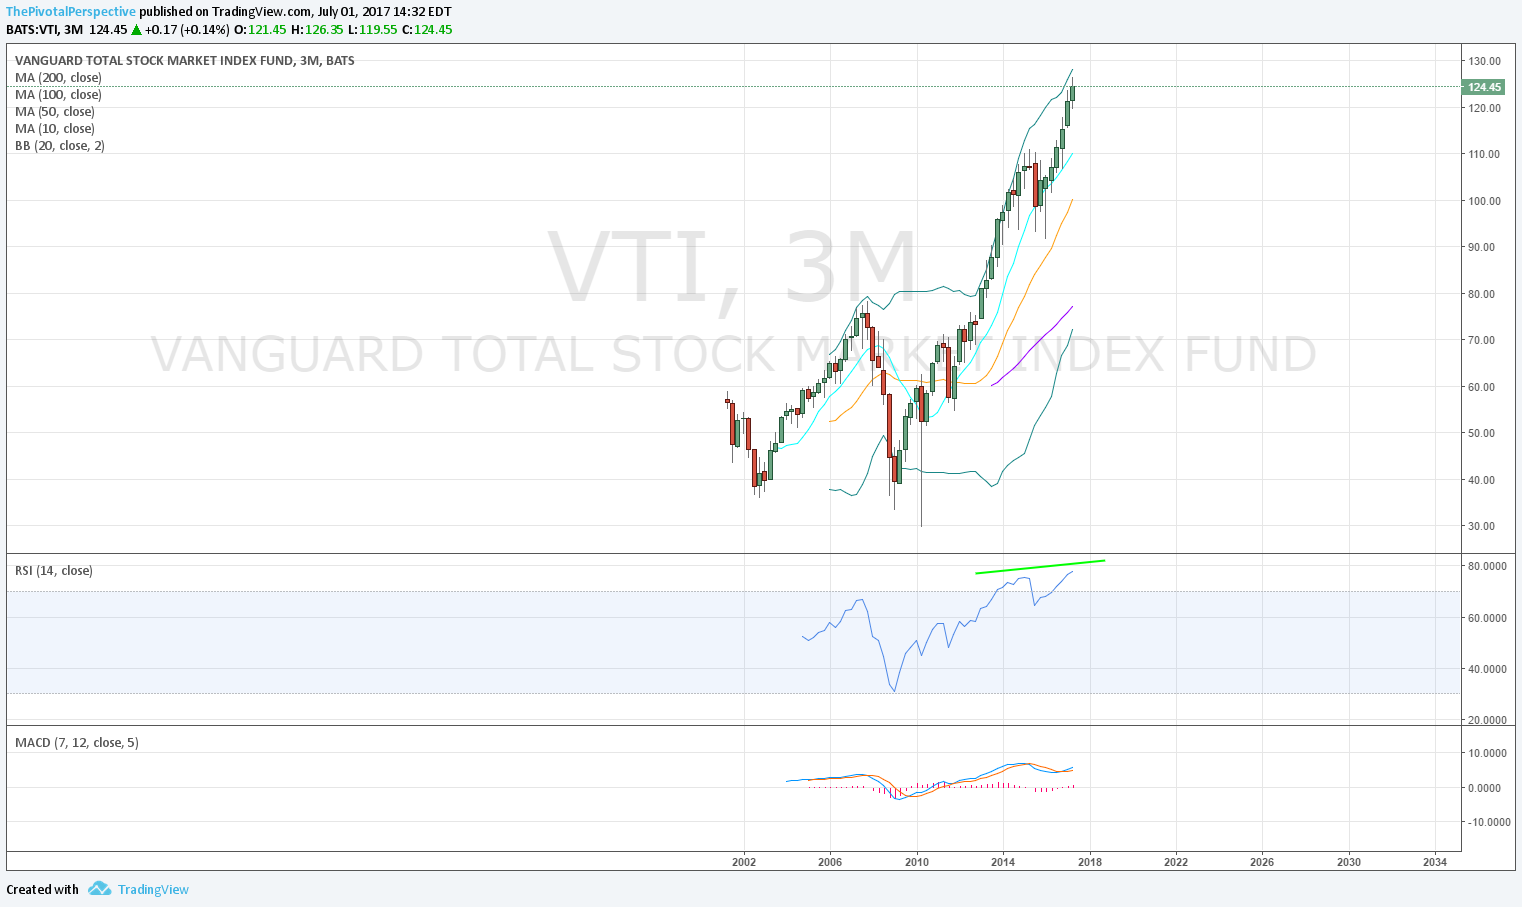
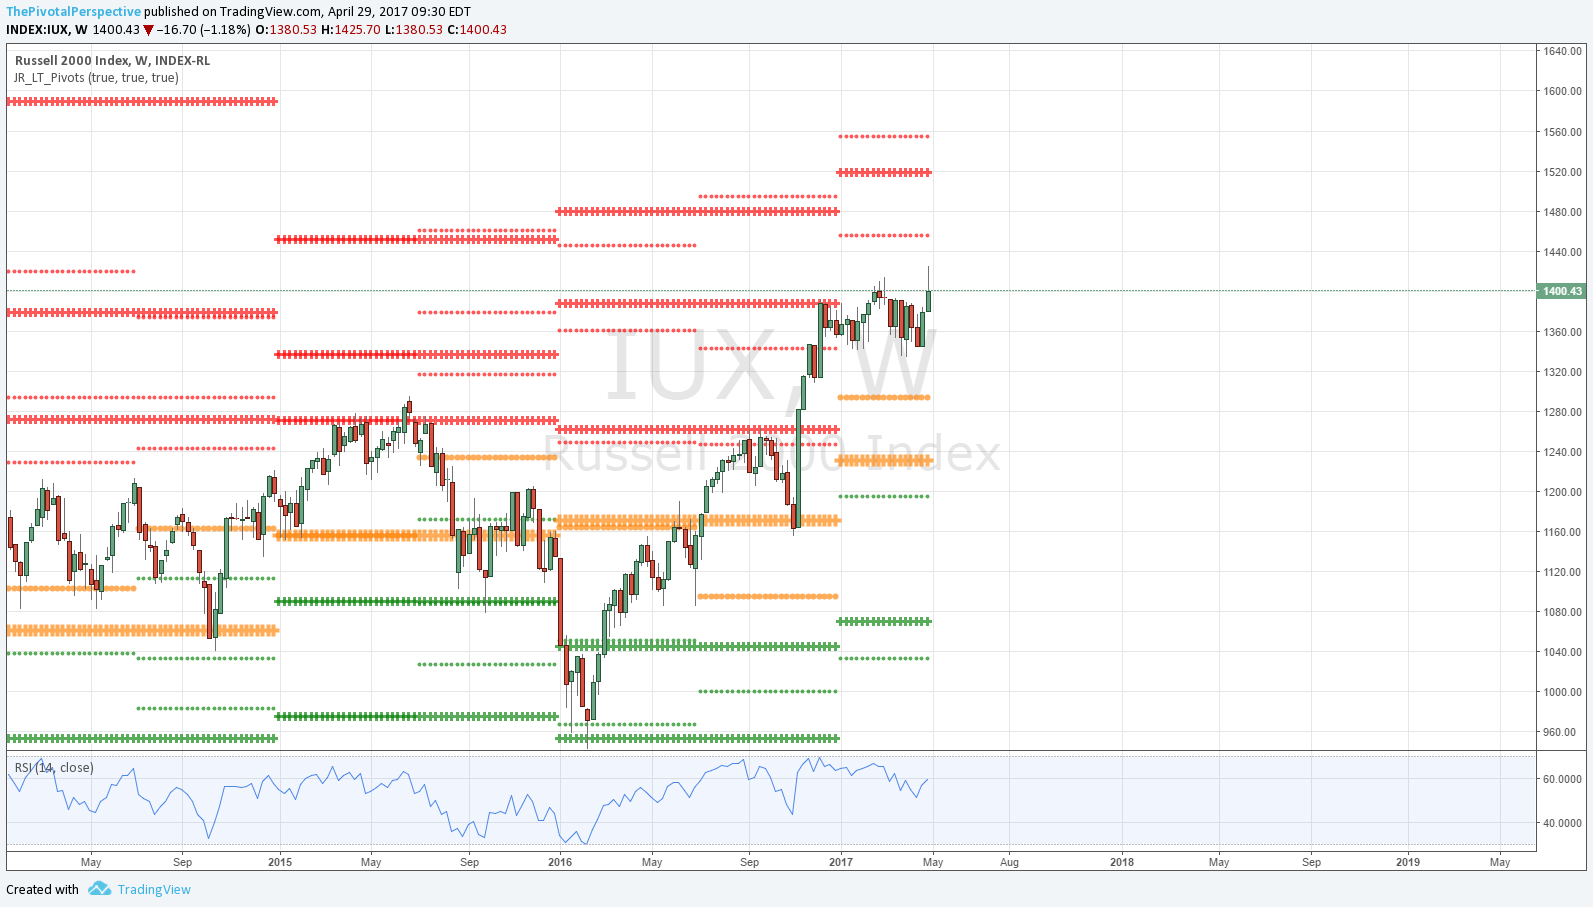
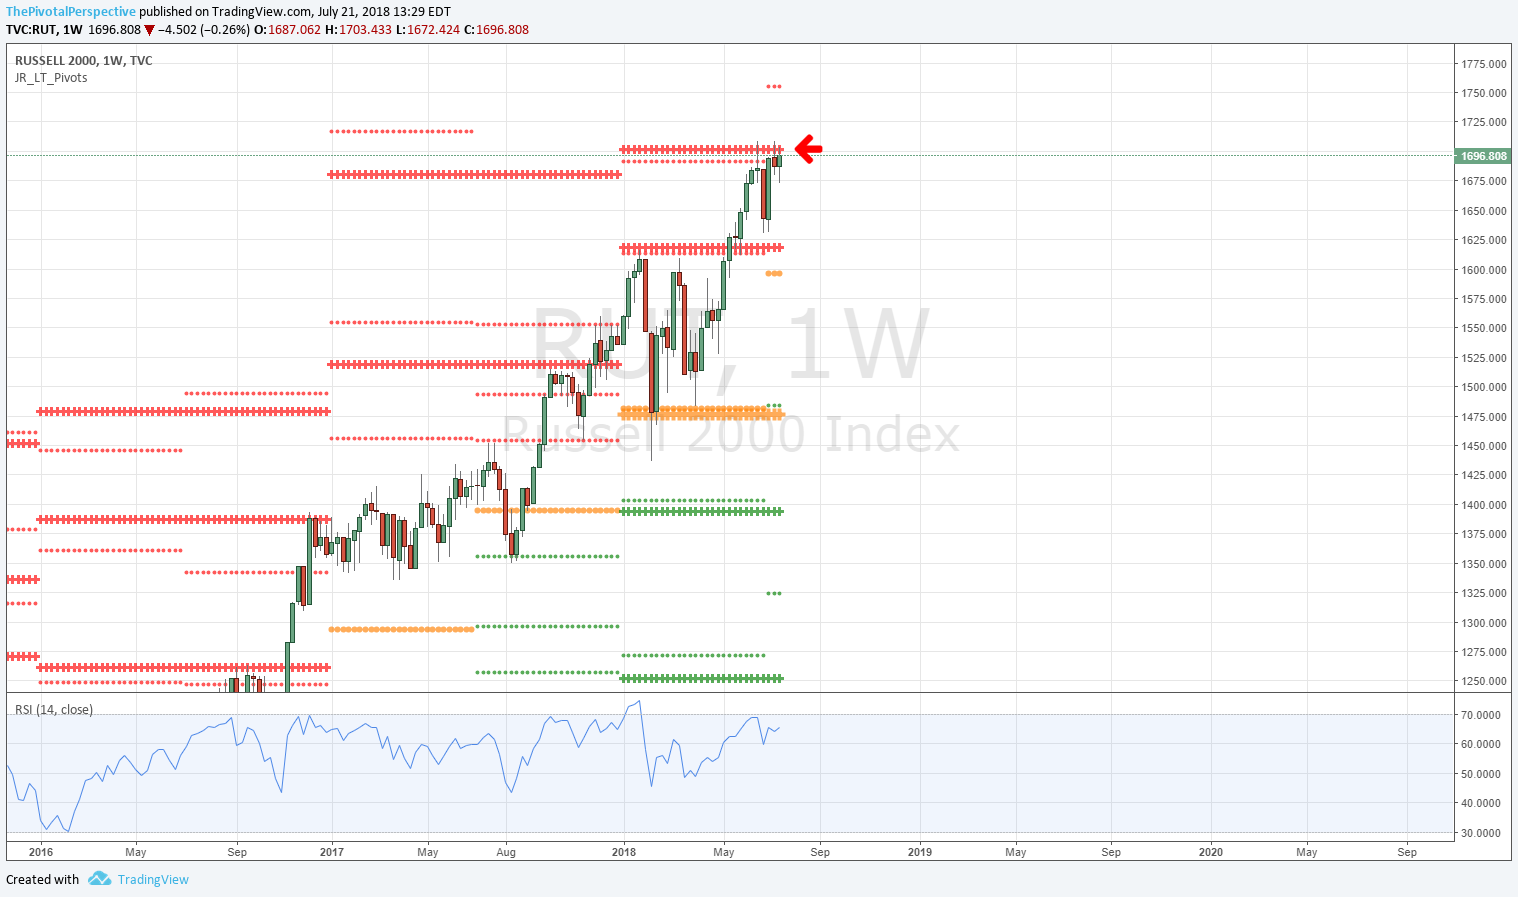
RUT W: Testing YR2 4 of last 5 weekly bars. Last week seemed to give chance to clear but still under the level. 
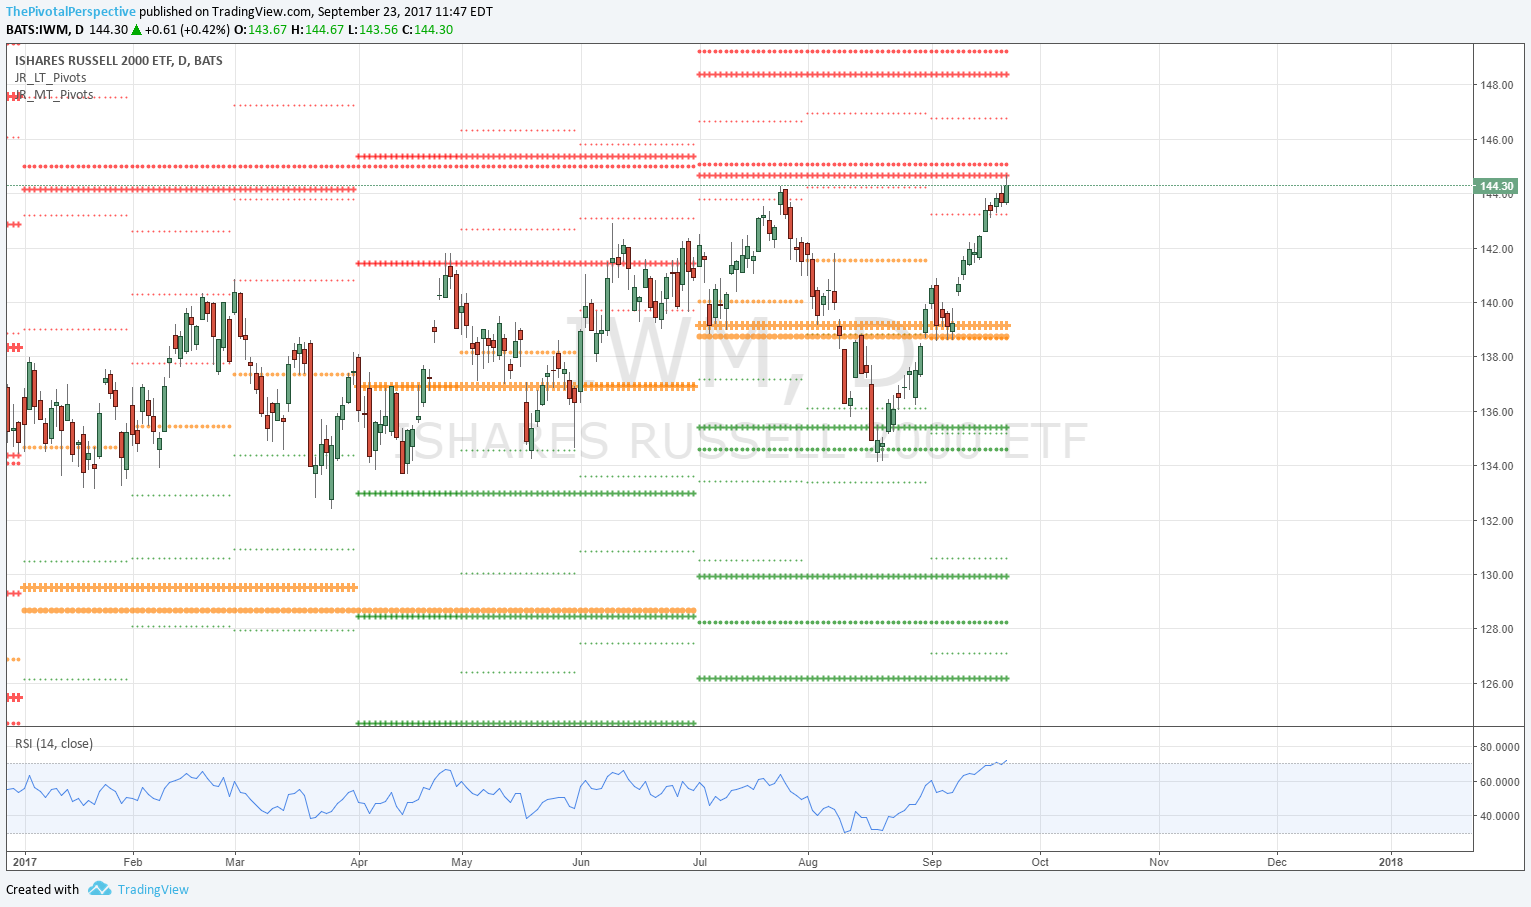
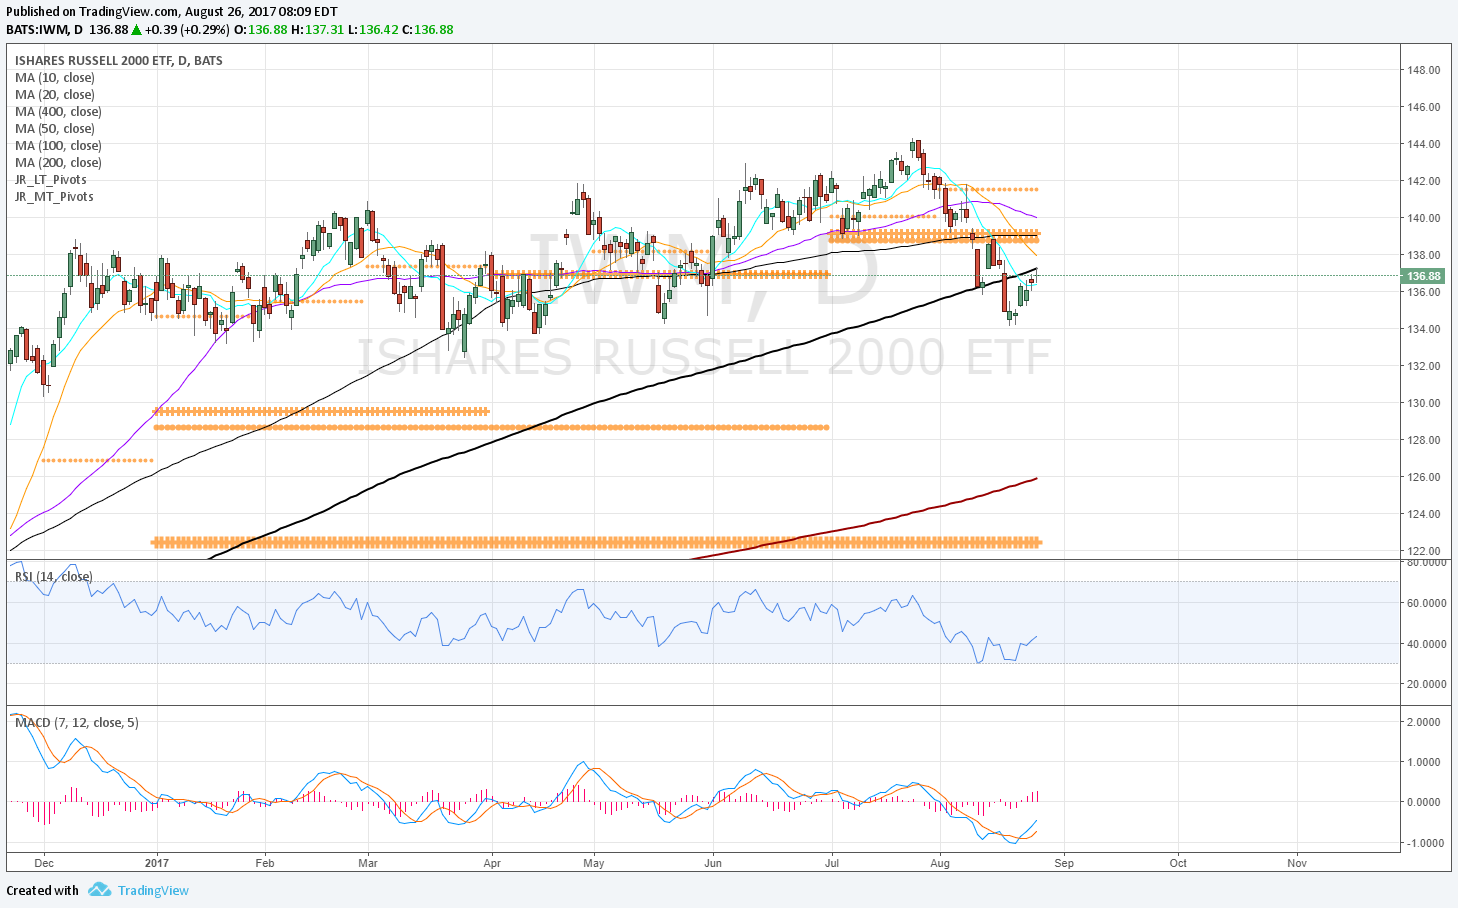
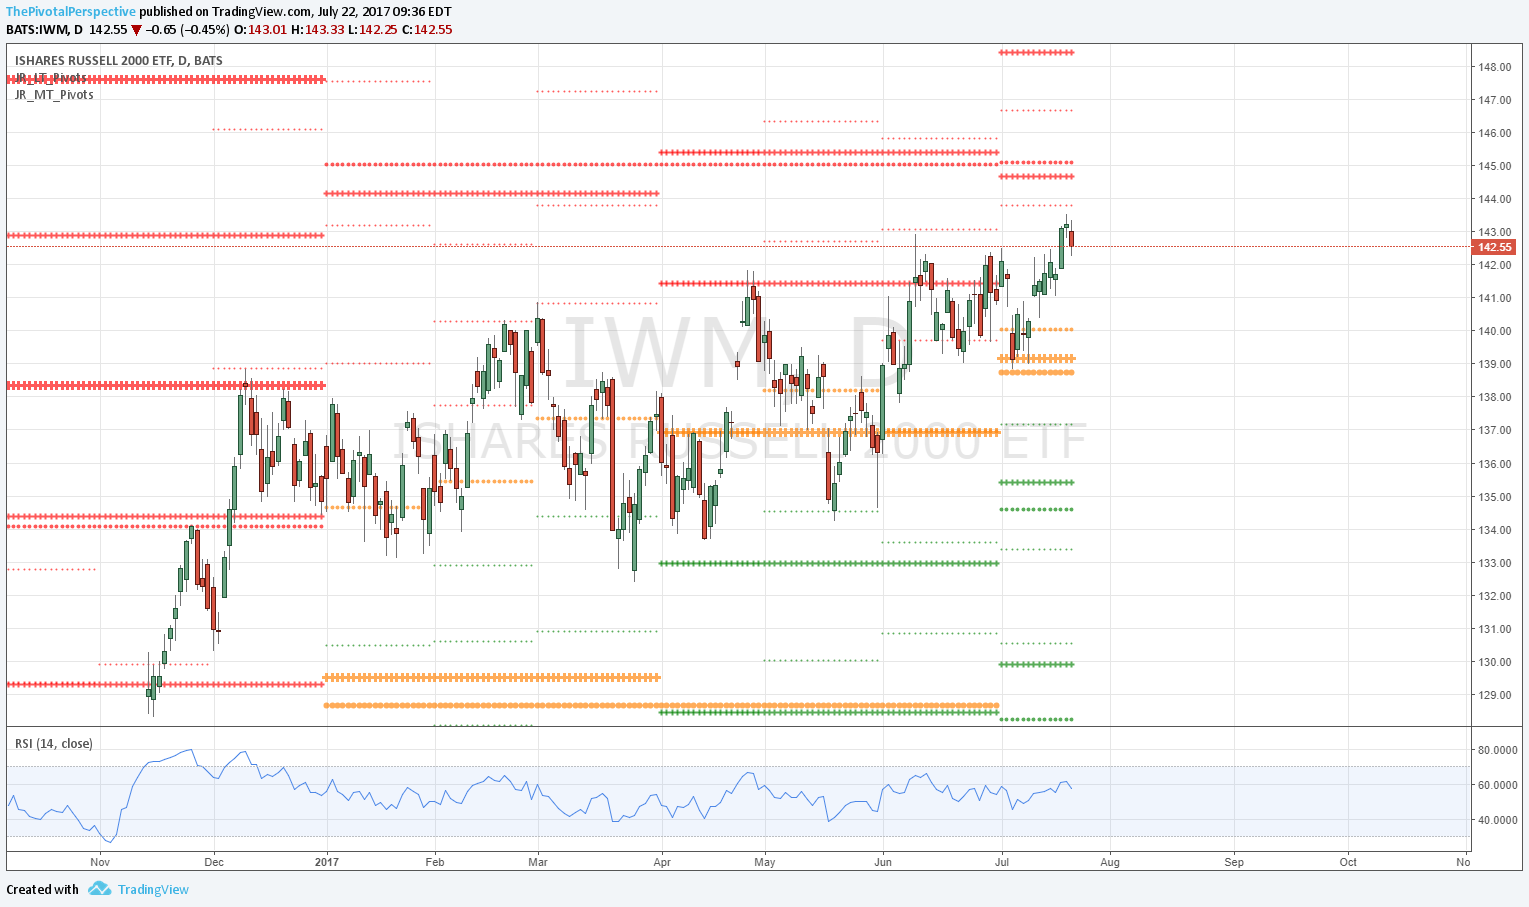
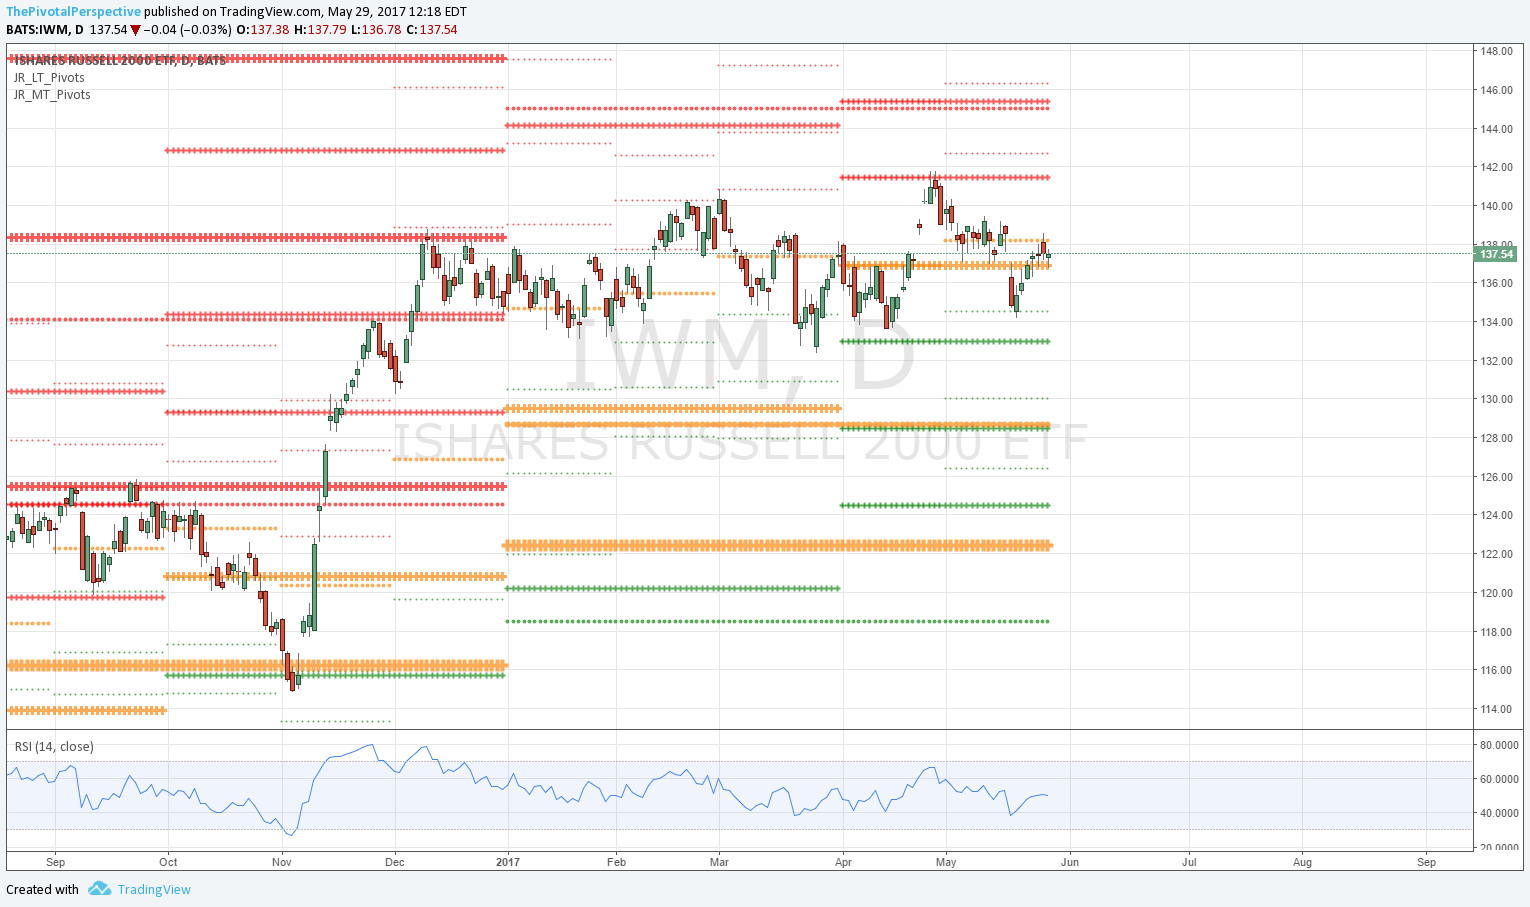
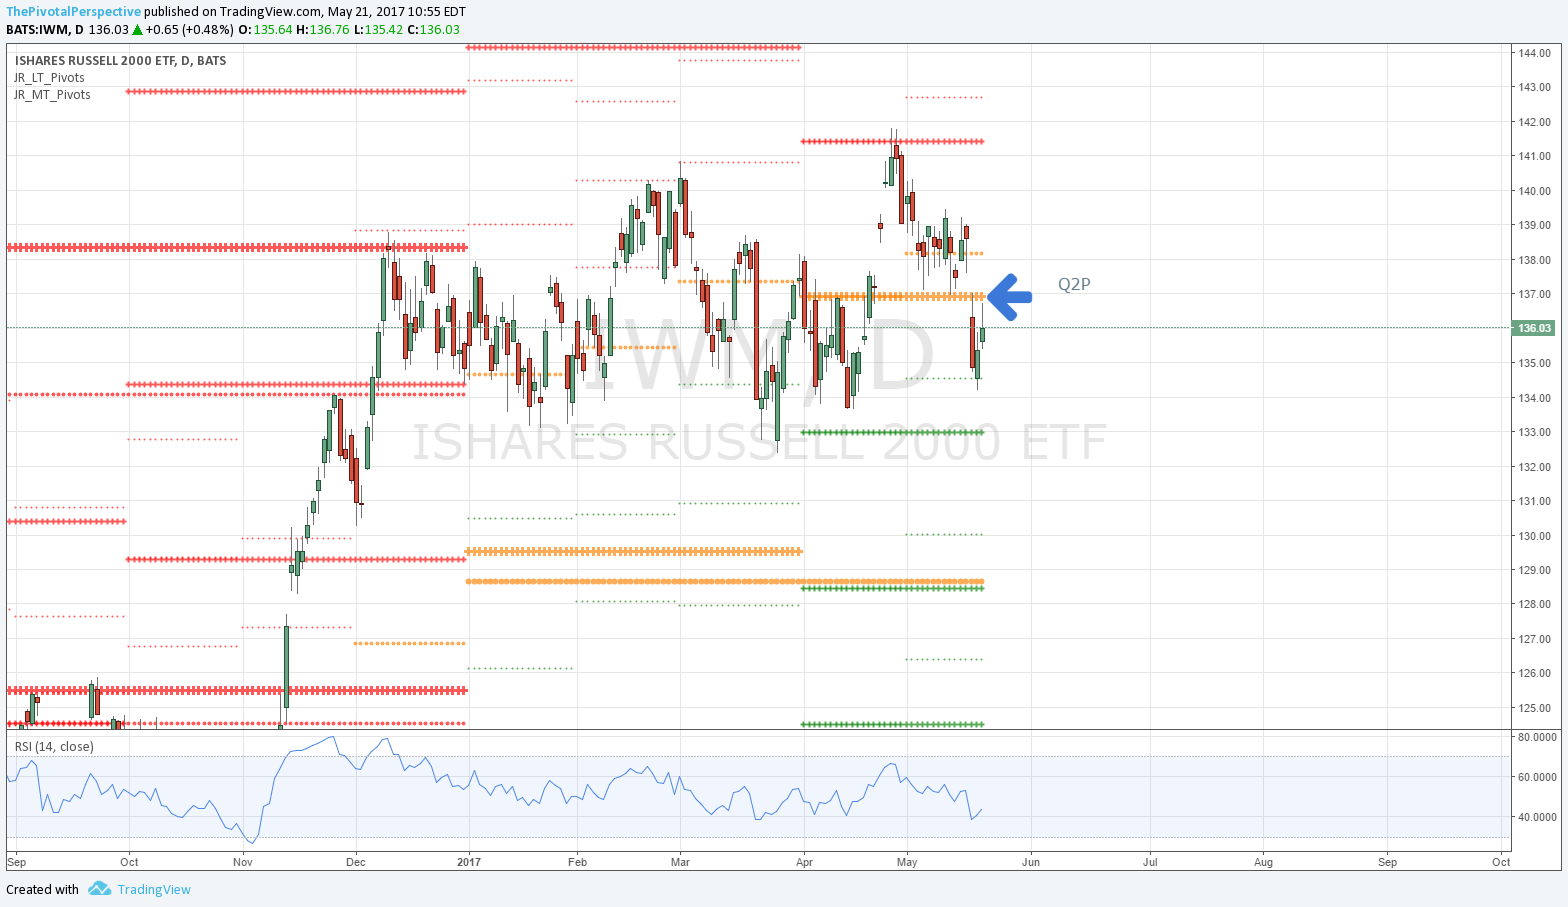
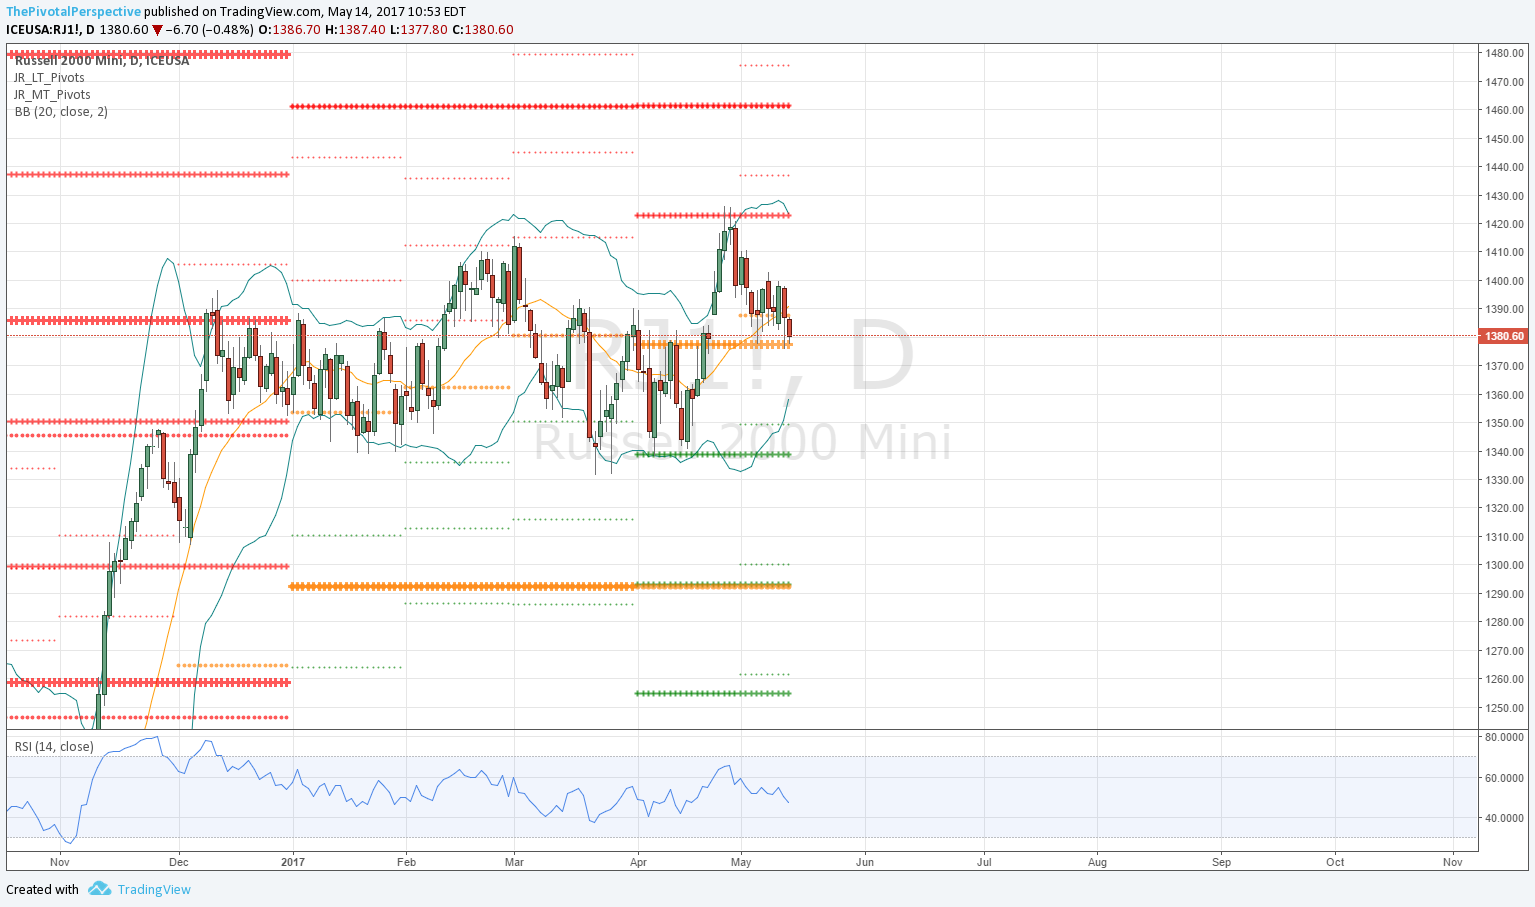
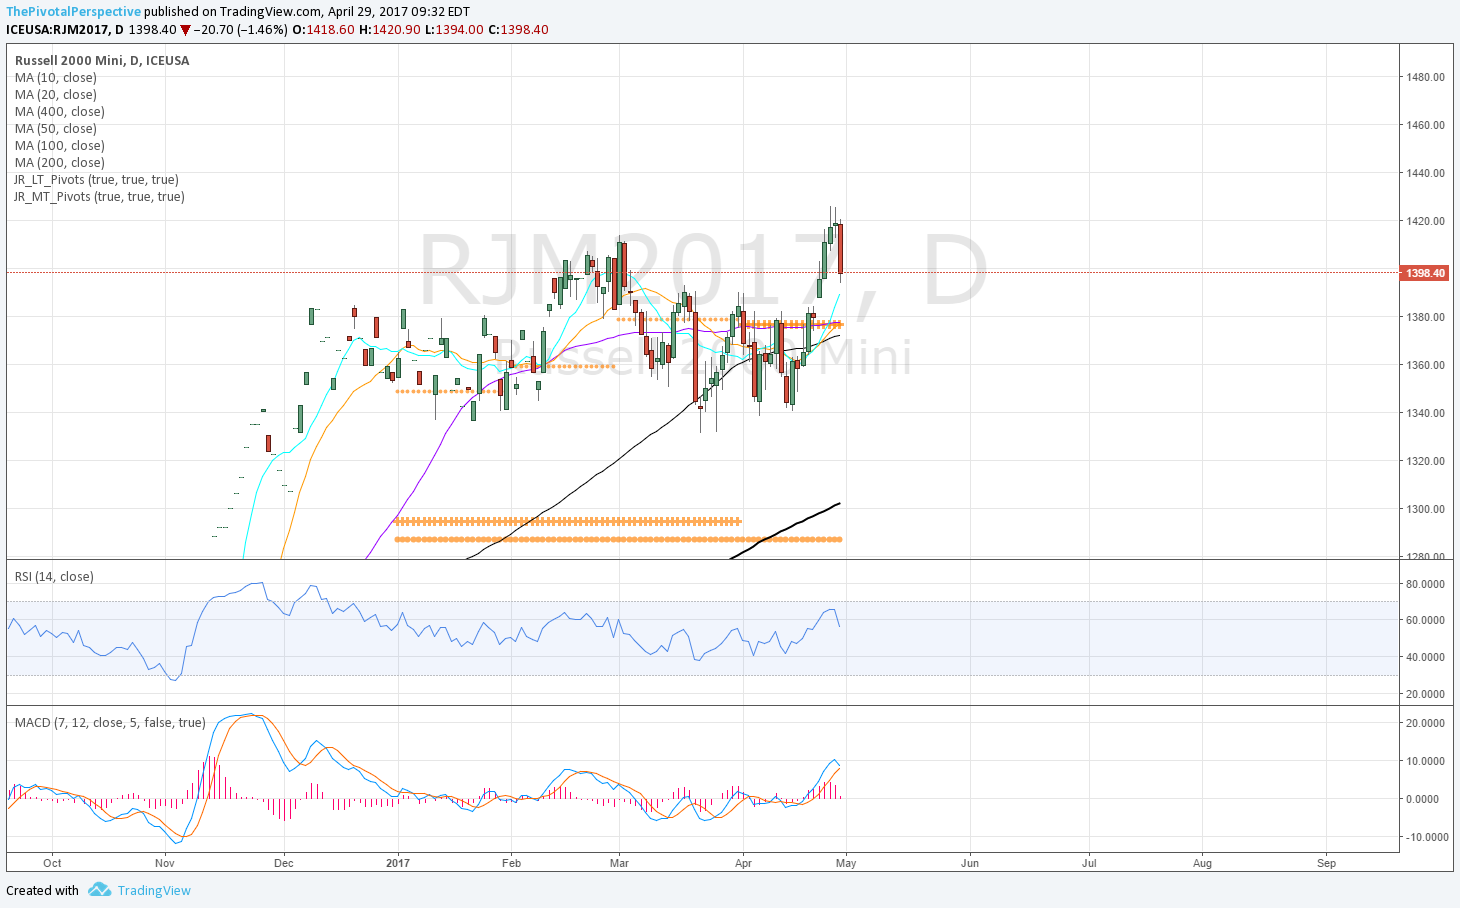
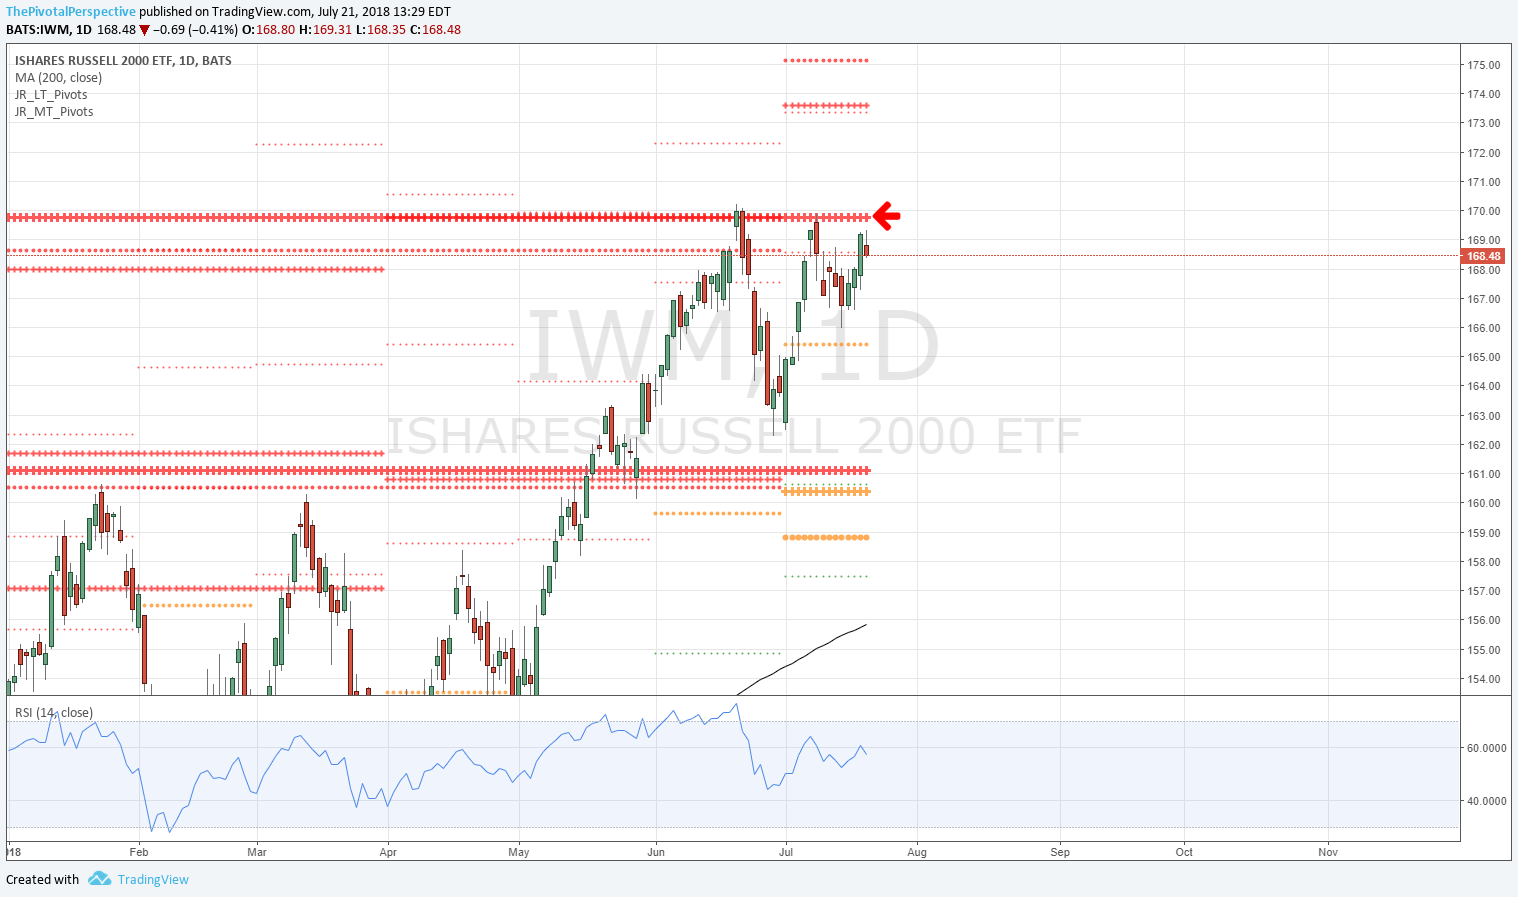
IWM D: 3rd time up to YR2 with minimal damage so far. 
RUT sum: Back to YR2 for the 3rd time in recent weeks. Will it clear? Not sure, but next week I'll be using the WP as additional clue of whether next move is breakout up or rejection. 
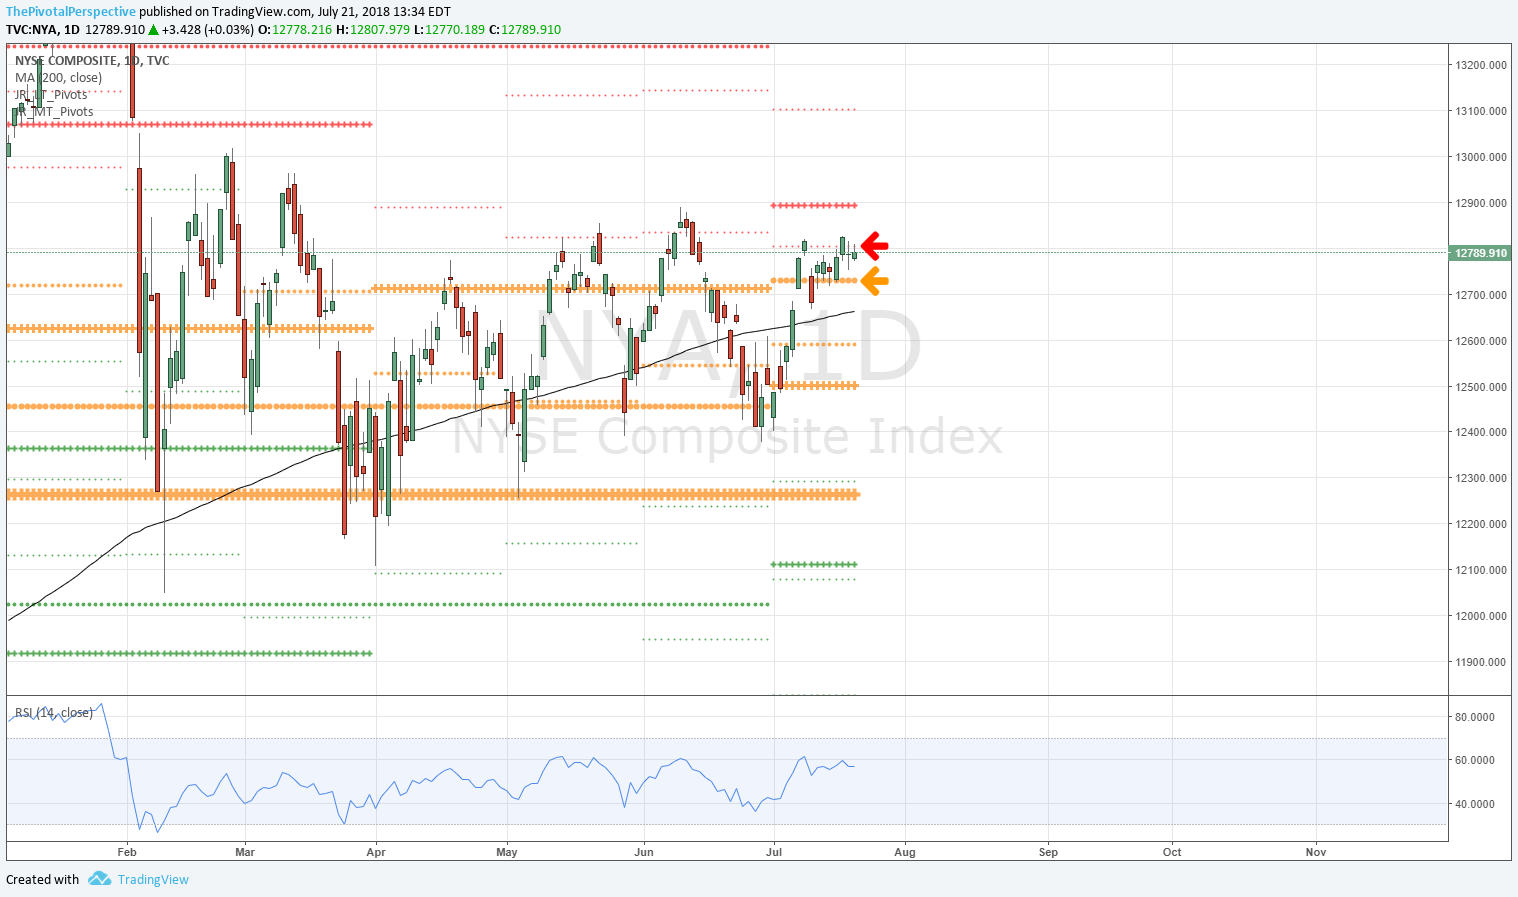
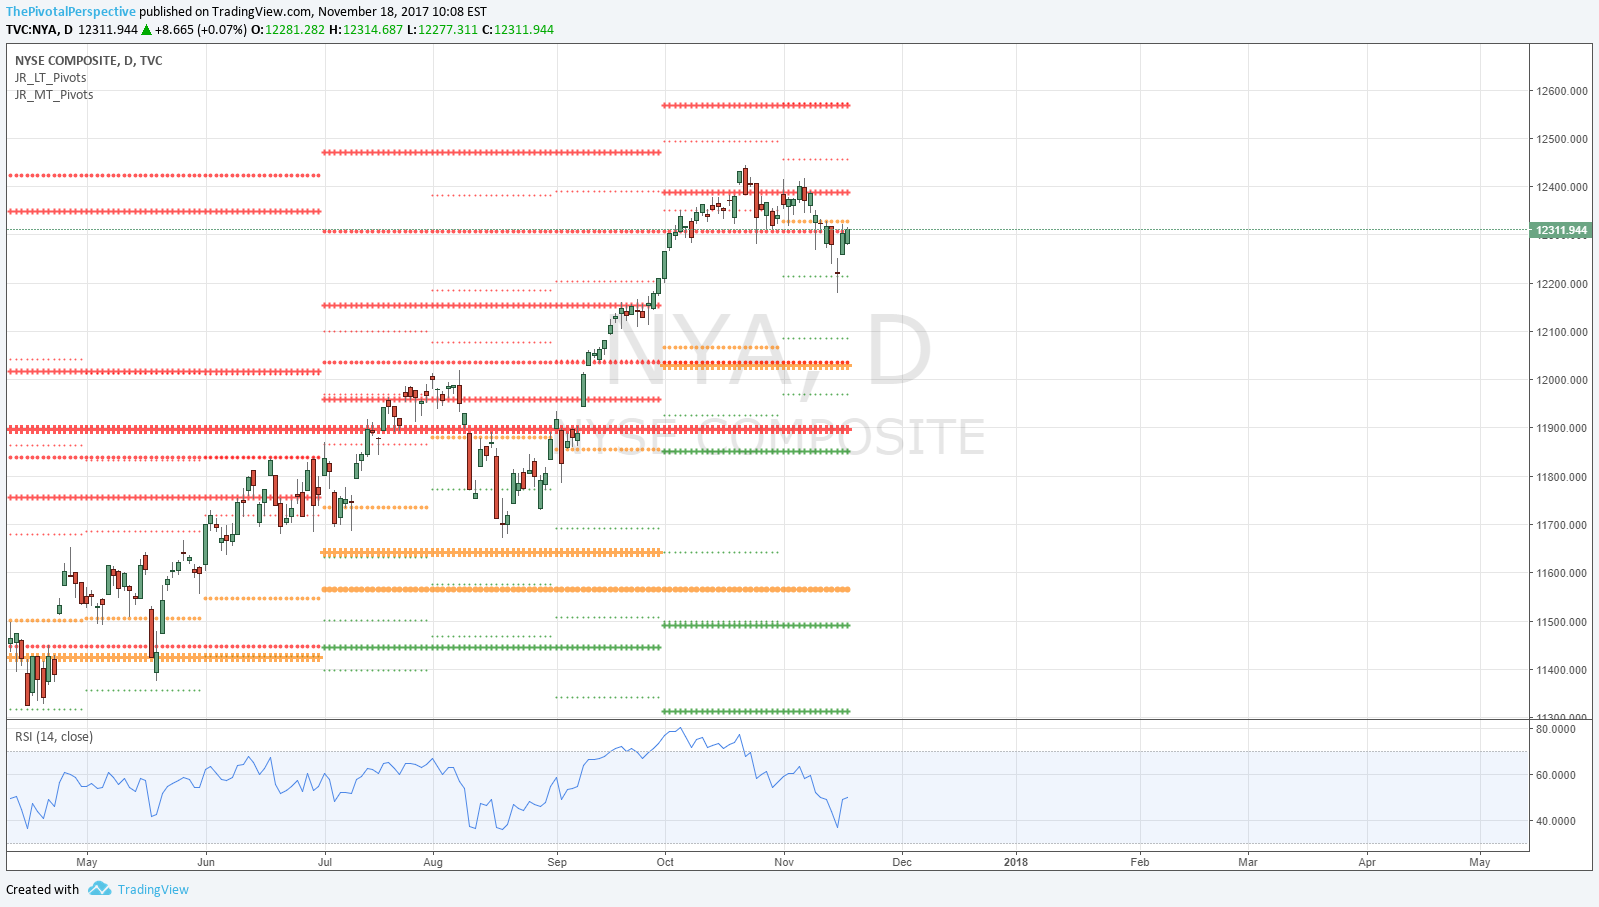
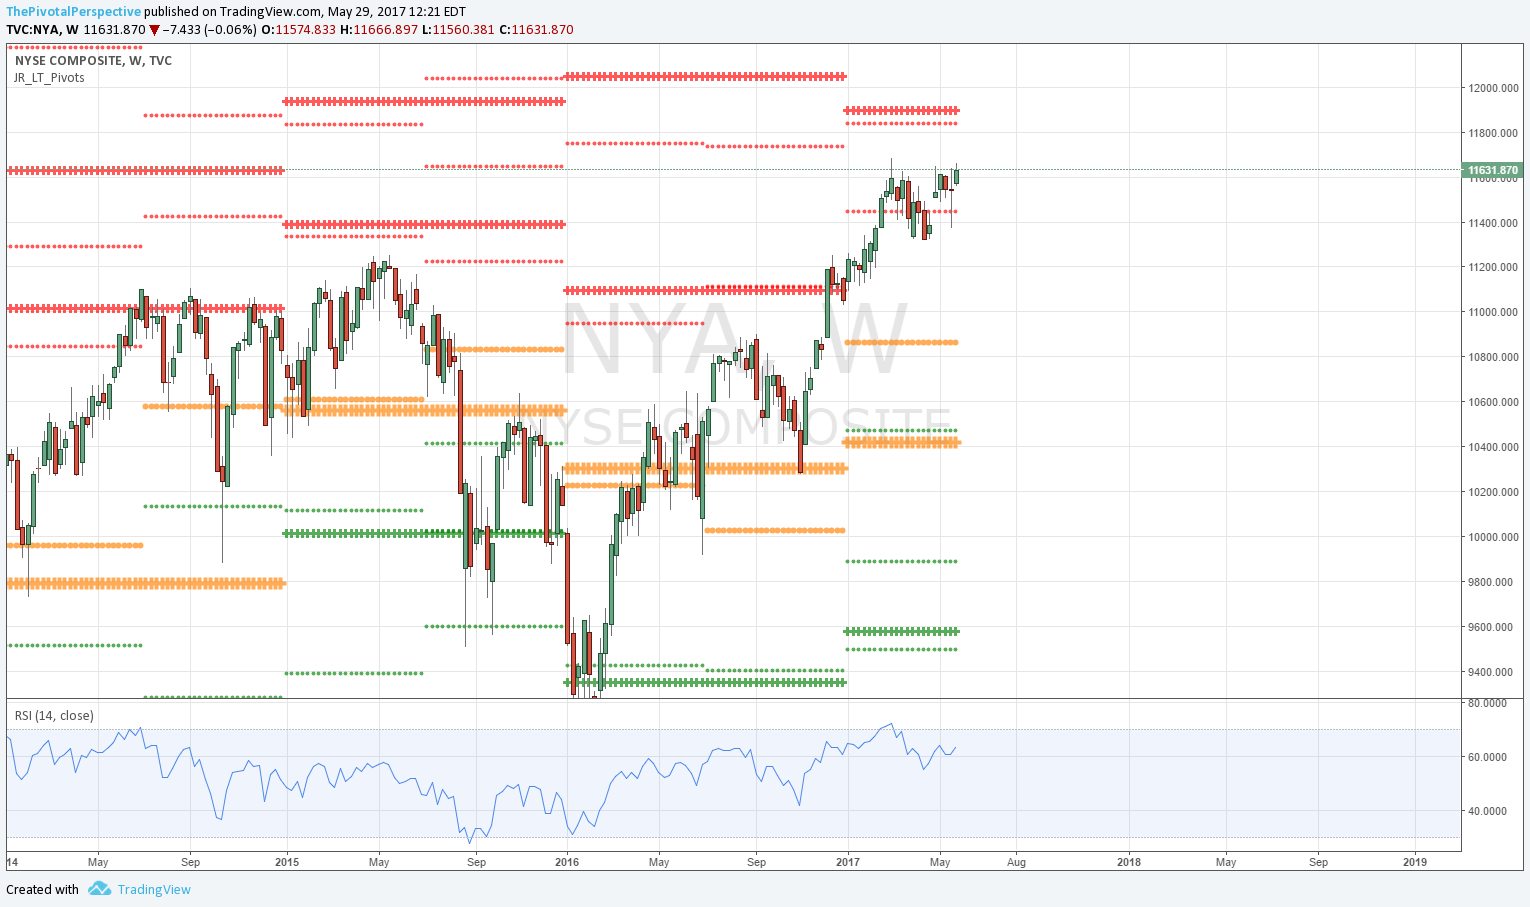
21 13 RUT W.png
21 14 IWM D.png

NYA
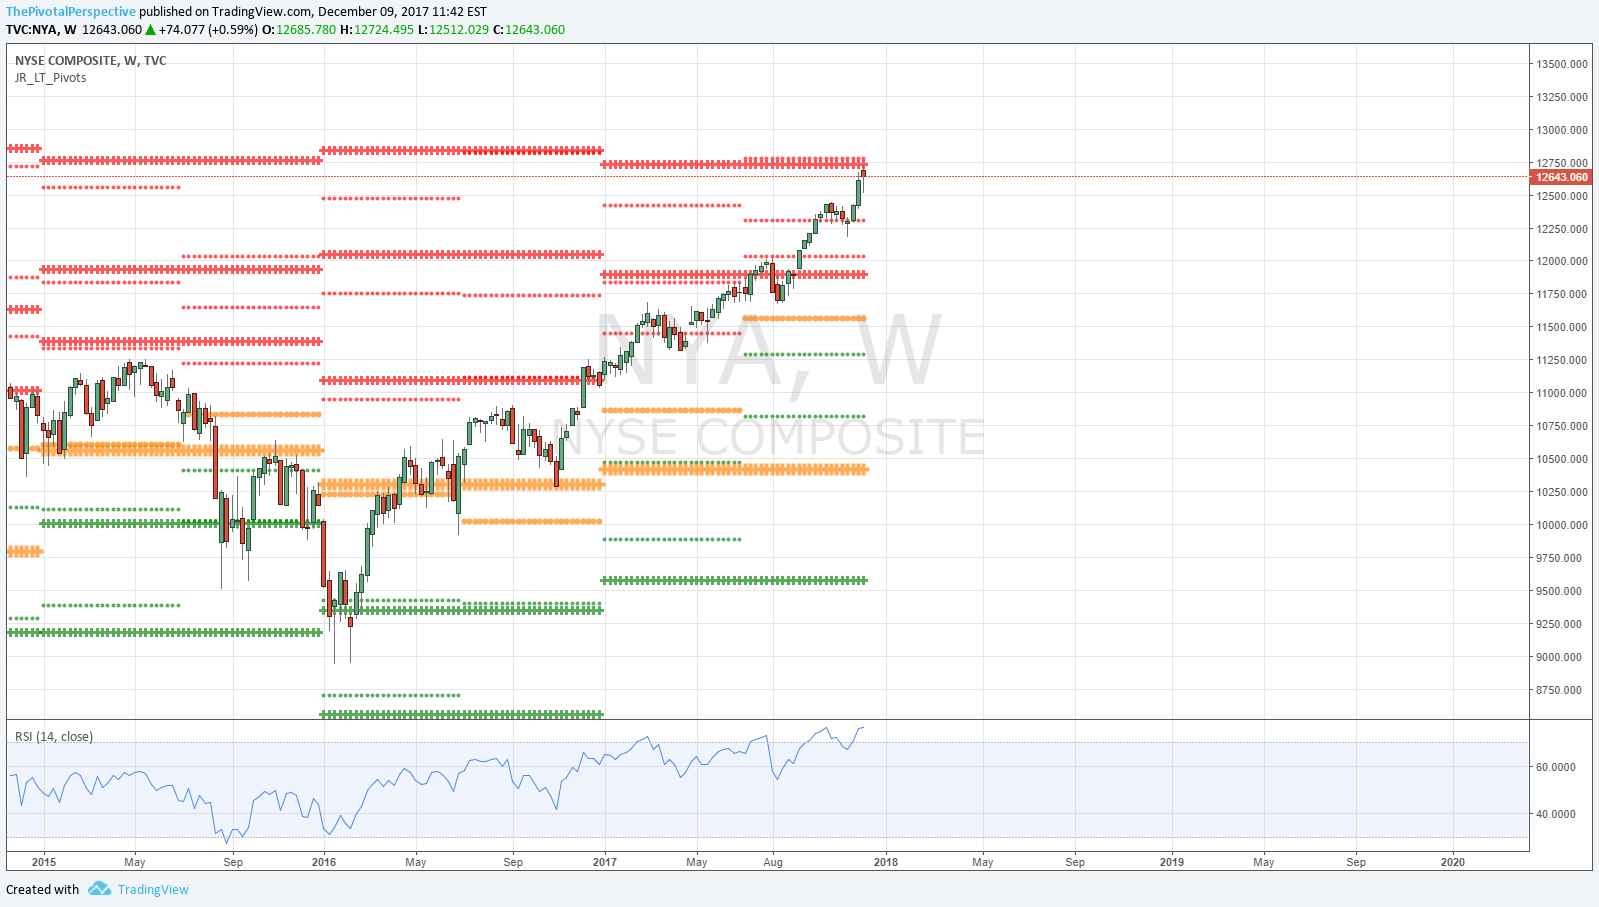
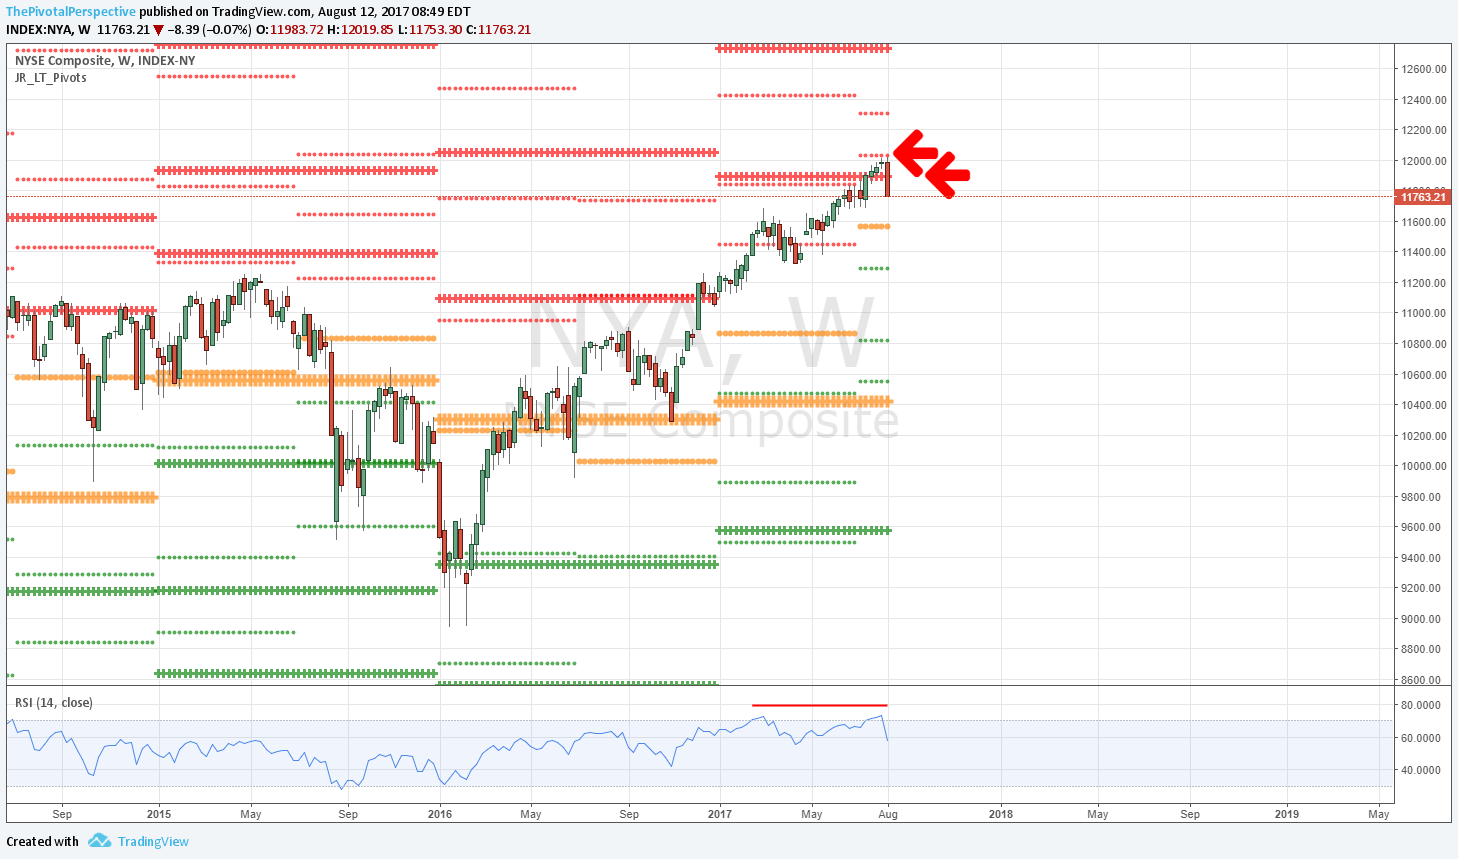
W: Above the HP but does not look convincing.
D: Also resistance at JulR1 with HP just below. 
NYA sum: Looks vulnerable to drop, but have to give bulls benefit of doubt above HP and D200MA.

21 17 NYA D.png

USA main indexes

Sum
Long term trends as measured by YPs and HPs are positive for the USA main indexes. These levels were tested in February and again in late March / early April and have held. However, last week indexes tried to turn medium term trends back to positive and failed. Next move seems up for grabs and there are a lot of levels that will make the decision easy:

SPY just below QP / MP combo; bearish below, more bullish above
DIA testing MP; more bearish below
QQQ testing QP; more bearish below, bullish if rebound

IWM probably needs to hold above all pivots for the bullish case

SPX / SPY / ES
SPX W: High of year on HR2, lows of year on YP and HP. Now mid range. 
SPY D: 3 days above QP and MP only to fail on Friday. Red line is 2017 close which is also important level in play functioning like a pivot. 
ES D: More bearish below the QP MP combo, but could try again to recover. 
SPX sum: Range bound action for 2018. Near term Q2P decides whether odds favor high test with potential for more or low test with potential for breakdown.

22 8 SPY D.png
22 3 ES D.png

NDX / QQQ
NDX W: High on HR2, low of HP. 
QQQ D: Testing QP.

22 4 NDX W.png
22 5 QQQ D.png

INDU / DIA
W: High on YR1, lows on HP
D: 2 days above QP then slight break then fail. Still above MP though.

22 6 INDU W.png
22 7 DIA D.png

RUT / IWM
RUT W: Also range bound between HR1 high and YP near low.
IWM D: Currently above all pivots is definite point on the bull side. 

22 9 RUT W.png
22 10 IWM D.png

NYA
NYA W: Tested and held YP area 4 weekly bars. But bounce doesn't look too zippy. 
NYA D: QP rejection; above MP, HP and YP.

USA main indexes

Sum
On Monday there was coordinated selling action on nearly all USA main indexes from various resistance levels: SPX/SPY Q4R3, NDX/QQQ YR3, RUT/IWM 2HR3 and Q4R1, NYA YR2 and VTI Q4R3. But the drop ended on Wednesday near SPY DecP (ES DecP near exact low), and from there indexes recovered back to highs. These levels are still worth watching, especially QQQ YR3, IWM YR1 and NYA YR2, but all trends remain up.

SPX / SPY  / ES
SPX W: Comfortably above YR2.
SPY D: Highs on Q4R3 but again mild pullback and back up.
ESZ D: Held DecP on pullback; above all pivots since late August. 
SPX sum: High on Q4R3 so far, but quick dip to DecP area bought and back up to highs. 

NDX / QQQ / NQ
NDX W: 4 of last 5 bars stuck at YR3, but not really dropping.
QQQ D: Only 2 days of real selling from YR3 area; Friday reclaimed above all pivots.
NQZ D: Back above all pivots, slightly.
NDX Sum: YR3 area resistance still worth watching. But notable that decline did not even reach DecS1 before coming back towards highs.

9 8 NQZ D.png

INDU / DIA
INDU W: Comfortably above 2HR3.
DIA D: Held DecP on 12/1 and up from there. Not near resistance. Above 2HR3 and Q4R2 area from late November.
Sum: Above all pivots; last time at or below a monthly pivot was 9/8, amazing run. Not near resistance.

RUT / IWM
RUT W: High on 2HR3, but still above YR1.
IWM D: 3 days back under YR1 but Friday came back. Still area worth watching.
RUT sum: High on YR3 exact, and so far 3 days under YR1 came back to finish above on Friday. Still YR1 level to watch. 

9 11 RUT W.png

NYA & VTI
NYA W: High bang on YR2.
NYA D: YR2 rejection, but maintained above all pivots.
VTI W: Above YR2.
VTI D: Q4R2 selling, but held above all pivots. 
 

9 14 NYA D.png

USA main indexes

Sum
All but IWM and NYA remain above all pivots, with SPY and VTI testing and quite successfully holding NovPs on the pullback low. But indexes have stalled in two major resistance areas - SPX YR2 / 2HR2 / Q4R2 for about 4 weeks, and NDX YR3 for the last 2 weeks. To me the configuration opens door for sellers next week, but given the strength of bounce from SPY NovP it is hard to be fully confident in any drop. 

SPX / SPY / ES
SPX W: No selling from YR2; second bar of last 4 to have small advance and close under 2HR2.
SPY W: I will be surprised if we don't see a drop next week.
SPY D: Daily version view shows drop to NovP, and bounce back to resistance.
ES D: NovP exact on pullback low.
SPX set sum: Held above all pivots with a strong rebound after test of NovP (exact on futs and cash, near tag on ETF). Still in YR2 / 2HR2 / Q4R2 resistance area for the last 4 weeks. 

18 6 ES D.png

NDX / QQQ
NDX W: 2 small bars below YR3 - door open for sellers.
QQQ D: YR3 near exact on high.

18 7 NDX W.png

DIA
Between levels.

IWM D
Low on NovS2 and 2HR1 combo, strong bounce back to NovP.

18 10 IWM D.png

NYA
NYA low on NovS1, bounce back to NovP>

VTI
Also low on NovP, back to 2HR2 resistance. 

USA main indexes

Sum
Healthy uptrends, with some mixed messages and rotation. NYA & INDU both above 2HR1; RUT has raced back to highs after deeper August pullback low, and and confidently approaching resistance so far. SPX and VTI are also testing 2HR1; SPX with a weaker advance last week that invites some selling. Lastly, NDX still above all pivots but testing its SepP and has been taking a breather as other indexes and sectors perk up.

SPY 2HR1 is a key level to watch next week, along with reaction from IWM Q3R1 and QQQ SepP.

SPX / SPY / ESZ
SPX W: Doji bar at top of BB with RSI divergence invites selling. 
SPX W: At 2HR1 - poke above, close below.
SPY D: High of month remains SepR1, after low of last month on AugS1.
ES Z: Above all pivots and MAs; buy signal 8/30-31 (back above all pivots, lifting above rising MAs, MACD flipping + 8/31) delivering another gain.
SPX sum: At long term resistance with weekly BB inviting sellers. That said, daily chart still above all pivots and MAs.

23 3 SPX W.png

NDX / QQQ / NQZ
NDX W: Testing 10MA again.
NDX W: Did not quite reach 2HR1.
QQQ D: Still closing above Q3R1 and SepP.
NQ Z D: Holding SepP and D50; below D10 and D20.
NDX sum: NDX relinquishing leadership this month after selling at the highs early September. Testing SepP and D50MA.

23 7 NDX W.png
23 8 NDX W.png
23 9 QQQ D.png

INDU / DIA
INDU W: Invites sellers.
INDU W: Between long term levels.
DIA D: Also between levels, with some pause at RSI overbought.
INDU: Again USA main index leader, recent higher highs; not on any pivot resistance but weekly Bollinger band resistance inviting some pullback.

23 11 INDU W.png
23 13 DIA D.png

RUT / IWM
RUT W: Looks great. 
RUT W: At resistance but confidently approaching, unlike SPX.
IWM D: That was a fast move back up from 2HS1 & Q3S1, back above pivots, then to Q3R1 and near 2HR1.
RUT sum: Also at resistance, but approaching confidently and weekly chart looks strong.

23 14 RUT W.png

NYA & VTI
NYA W: Wow - that is pretty rare stuff, 2 weeks overshoot of BB. 
NYA W: Liftoff above YR1 and also through 2HR1 - looking good.
NYA D: Testing Q3R2.
NYA sum - looking great, above 2HR1 and testing Q3R1 (which is only in play 1 more week).
VTI W: Pause at upper BB.
VTI W: Also at 2HR1.
VTI D: Traded above 2HR1 for 4 days but fell back for the weekly close. Note RSI reaction.

23 17 NYA W.png

USA main indexes

Sum
Regardless of any opinion about how NKorea would play out, all USA indexes made convincing holds of various pivot areas last week, and by 9/1 all 5 above all pivots (first time since 8/2). 

It is important to understand what was on the low to help recognize these days where the market is literally ringing a bell for a definitive turn. Weekly level major pivot only (ie, pivots, no support / resistance, and no monthly levels) and moving average charts included below for clarity of long term trend. On recent lows:

SPY weekly 20MA held, then recovered AugP 8/30 along with D20 and D50MAs.
QQQ weekly 10MA and 20MA cluster held, then all above AugP on daily close from 8/22 on; 8/29-30 recovered D20 and D50MA.
DIA weekly 10MA held; AugP and D50MA 8/29 bang on last week's lows.
IWM weekly 50MA and 2HS1 on lows; recovered 2HP & Q3P 8/30.
VTI weekly 20MA and near tag of Q3P; recovered AugP 8/30-31. 

From here, SPY and VTI Q3R1s are in play but even if mild pullback then SepPs likely support on first test. With all USA indexes above all pivots, one really has to be bullish and expect higher targets. I will change this view if we see resistance rejections and SepP breaks. 

SPX / SPY / ESU / ES1
SPX W: From near lows of summer range to highs, but without tagging long term levels.
SPY W: Major pivots only (Y, Hs, Qs, no monthly) chart plus MAs; MACD+ from 11/2016, above rising 20MA entire ride.
SPY D: Back above all pivots as of 8/30.
ESU D: Back above all pivots and MAs on 8/30 close, as MACD flipped +. D100MA near enough on both llows.
ES1 D: At Q3R1.
SPX sum: Low on AugS1 and D100MA held for a second time, and from there fast move back above all pivots and MAs. Q3R1 in play. Above that will target 2HR1 2500, not far away.
 

2 5 SPX W.png
2 6 SPY W.png
2 7 SPY D.png
2 8 ESU D.png

NDX / QQQ / NQU / NQ1
NDX W: Between levels.
QQQ W: Held 10MA and 20MA tag, with key low of Q3 bang on Q3P.
QQQ D: AugP 2 breaks, but held on daily close from 8/22 on.
NQ D: Above all pvits and MAs early 8/30.
NQ 1: About same.
NDX sum: Held test of weekly 10MA and 20MA; 2 minor breaks of AugP and definitive hold from 8/22 on.

2 12 QQQ W.png
2 14 NQU D.png
2 15 NQ1 D.png

INDU / DIA
INDU W: Back to 2HR1.
DIA W: Simple pullback to rising 10MA.
DIA D: Rising D50 and AugP convincing hold on 8/29.

2 16 INDU W.png
2 17 DIA W.png
2 18 DIA D.png

RUT / IWM
RUT W: High on 2HR1, low on 2HS1 both near exact. Recovered 2HP.
IWM W: Rising W50MA on the low as well.
IWM D: Pivot cluster on lows, back above all pivots as of 9/1.

NYA & VTI
NYA W: Back above YR1.
NYA W: Hold of rising 20MA and near tag of Q3P.
NYA D: Above YR1 is bullish, with SepP not far below as support as well.
VTI W: YR1 held as support from 8/22 on.
VTI W: Rising 20MA and near tag of Q3P on the lows.
VTI D: At Q3R1.

2 23 NYA W.png
2 26 VTI W.png

USA main indexes

Sum
Current leaders DIA and QQQ above all pivots. But SPY and VTI below AugPs with clear resistance on those levels the last few days. IWM led down as expected and recently bounced from the 2HS1 / Q3S1 combo. 

Levels to watch this week are QQQ AugP, SPY & VTI AugPs. It is certainly possible that SPY rallies and joins DIA and QQQ above all pivots. That said, several declines in early stages have involved a monthly pivot starting to act as resistance. This happened with SPY in April 2017 and September/October 2016; and in more threatening examples, December 2015 and August 2015. 

SPX / SPY / ESU / ES1
SPX W: Near tag of 2HR1 at highs; still above YR1 support and if lower then 2HP could be in play.
SPY D: AugP resistance 3 days in a row.
ES U: AugP, falling D20 and flat D50 resistance. MACD not returning to positive on the bounce.
ES 1: About same.
SPX sum: Consolidating gains after big run. Recent low on AugS1 and D100MA exact, bounce, but now AugP and D20 & D50 resistance. AugP acting as resistance can be part of a larger decline, like April 2017. 

26 4 SPY D.png
26 5 ESU D.png

NDX / QQQ / NQU / NQ1
NDX W: Near to 2HR1 at highs; above YR2. 
QQQ D: Still above AugP; 2 slight breaks this month.
NQU: Falling D20 resistance.
NQ1: About same:
NDX sum: Consolidating gains after amazing run up. Still above AugP and D50MA. 
 

26 8 QQQ D.png
26 9 NQU D.png
26 10 NQ1 D.png

INDU / DIA
W: High slightly above 2HR1 but now below.
D: Q3R2 near tag, and 2HR1 selling. Still above AugP.

26 11 INDU W.png

RUT / IWM
W: Isn't that nifty - high on 2HR1, low on 2HS1
D: Q3S1 also involved in low.
D: D200MA break, but rising could recover. 

26 14 IWM D.png
26 15 IWM D.png

NYA & VTI
NYA W: 2HR1 high, and now below YR1. Key level to watch>
NYA D: YR1 in red arrow, and AugP also there.
VTI W: YR1 not acting as definitively as early 2016 YS1 low or second half 2016 YR1 high.
VTI D: AugP resistance.

USA main indexes

Sum
First the positives: DIA above all pivots and all MAs except 10MA. QQQ broke AugP for 1 day and recovered. Also, only IWM is below Q3P. All the others (SPY QQQ DIA NYA/VTI) above Q3Ps, 2HP and of course YPs.

But - significant negatives. DIA, IWM and NYA had long term level bearish action. DIA top on 2HR1 and rejection, IWM 2HP break, and NYA 2HR1 and YR1 rejection. SPY had near tag of 2HR1 and rejection, and currently below AugP. 

My interpretation of this is the move we just saw is not a 1 day bear wonder or false break. This opinion could change, but this means I am not expecting an immediate bullish resolution. 

More bullish action would be SPY recovering AugP with look of support, and VTI bouncing from YR1 in decent reversal.

SPX / SPY / ESU / ES1
SPX W: Near tag of 2HR1 and down. Support at YR1, 2HP. RSI buy attempts likely in 50-60 zone. 
SPY D: Q3R1 rejection and below AugP. Next support AugS1, YR1, Q3P. Or, recovery of AugP would look more bullish. 
ESU: Break of D50MA. 
ES1: 2 days outside the daily BB.
SPX sum: Below AugP means should go lower. 

12 3 SPX W.png
12 4 SPY D.png
12 5 ESU D.png
12 6 ES1 D.png

NDX / QQQ / NQU / NQ1
NDX W: Failing at prior high and RSI divergence. That said just looks like consolidation at this point. 
QQQ D: Only 1 day below AugP. 
NQU D: Also back above D50MA.
NQ1 D: 1 day outside lower BB.
NDX sum: 1 day break of AugP and recovery, also back above D50MA. This looks more like one day bear wonder. 

12 10 NDX W.png
12 7 QQQ D.png
12 8 NQU D.png
12 9 NQ1 D.png

INDU / DIA
INDU W: Possible critical high on 2HR1.
DIA: High on Q3R2 / AugR1 combo, then 1 day rejection of 2HR1. 
DIA: Still above all pivots, and all MAs except D20.
DIA: 2HR1 rejection is bearish, but still above all pviots and all daily MAs except 10. 

12 11 INDU W.png
12 12 DIA D.png
12 13 DIA D.png

RUT / IWM
RUT W: Break of 2HP! 2HS1 support not far. 
IWM D: RSI oversold and near Q3S1, but below 2HP and Q3P, and of course AugP. Red line at 2016 close. Total return includes dividends and this is price, but still an important level for the market. 
RUT sum: This is long term underweight based on break of 2HP. This index has been weaker all year, and you ca

NYA & VTI
NYA W: Looks like critical high on 2HR1, and break of YR1 confirms selling. 2HP support.
NYA D: That near tag of 2HR1 and break of Q3R1 started the move. Massive rejection of YR1 on 8/10. Still under AugS1. 
VTI W: Testing YR1 as support. 
VTI D: Q3R1 rejection and so far holding YR1 but not much bounce.
NYA move adds to argument that market just made important top. VTI would join in that if YR1 breaks with look of rejection.

12 18 NYA D.png
12 21 VTI W.png
12 22 VTI D.png

USA main indexes

Sum
Last week I noted an important change in medium term pivot strength - DIA was only index above Q3R1 and the rest were below. Those with flexibility to rotate did well, with DIA going up each day as other indexes struggled in the past week. Pair trading did even better, as the call for IWM to lead lower also played out.

Indexes look more different than much of the year so far - DIA near 2HR1 area (exact tag on cash index), SPY slightly above Q3R1 (but futures not there yet); then QQQ and VTI are below Q3R1s. IWM has led the way lower as called, already testing a major support area 2HP and Q3P.

Bullish from here would be more indexes clearing Q3R1s. Bearish would be SPY Q3R1 rejection and possible IWM Q3P or 2HP pivot break.

Lastly, I don't mention NYA much but it almost never lets me down as an indicator (for new readers I view this along with VTI as broad indexes). While it has cleared YR1, 2HR1 is not far above. This is an important area to watch at 12034. For now it too is above its Q3R1 slightly. 

SPX / SPY / ESU / ES1
SPX W: Floating up towards 2HR1 at 2503.
SPY D: So far consolidating sideways after run up to new highs; a struggle but no rejection at Q3R1.
ESU D: Below 10MA slightly - otherwise above all pivots and MAs with nicely rising slopes. 
ES1 D: This version looks more bearish with Q3R1 still resistance (ES U also below Q3R1 too).
SPX sum: Sideways consolidation and pause at Q3R1, but no rejection yet. Futures contracts are not as bullish as SPX and SPY. Regardless of Q3R1 status, above all pivots and all daily MAs except 10 is still healthy uptrend.
 

5 3 SPX W.png
5 4 SPY D.png
5 5 ESU D.png
5 6 ES1 D.png

NDX / QQQ / NQU / NQ1
NDX W: Near tag of 2HR1. Glaring RSI divergence. 
QQQ D: After falling under Q3R1 on 7/27, no close above and 2 days of selling from the level.
NQU: Below 10MA, but holding a sharply rising 20MA. Starting to see a bit of resistance at prior highs as well.
NQ1: Q3R1 resistance. 
NDX sum: Since 7/27, Q3R1 has been resistance. 

5 8 QQQ D.png
5 9 NQU D.png
5 10 NQ1 D.png

INDU / DIA
INDU W: Launch above YR1 and reached 2HR1. RSI healthy, no divergence. 
DIA D: Levels slightly different here, with DIA above 2HR1 and nearly and AugR1. 
INDU: Took over as medium term strength leader on 7/28 - the only index to be above Q3R1s as of that date. Momentum has continued. 
 

RUT / IWM
W: 2HR1 stopped the move, and now nearly testing 2HP - important long term support!
D: 2HP and Q3P nearly same level and highlighted by orange arrow. 
RUT: Led down as called. Now testing significant support area 2HP and Q3P. Below AugP from the second trading day of the month. 

5 13 RUT W.png

NYA & VTI
NYA W: Near tag of 2HR1. Made it above YR1 for 3 weeks, but less than enthusiastic on this last leg up.
NYA D: Holding Q3R1 as support so far, in addition to the YR1 below that. 
VTI D: Struggling at Q3R1 since 7/27.

5 15 NYA W.png
5 17 VTI D.png

USA main indexes

Sum
All USA main indexes are testing medium term resistance. 
SPY on Q3R1 and JulR2
QQQ on Q3R1
DIA on JulR1
IWM near tag of JulR1, and cash index shows rejection at 2HR1
NYA and VTI both on Q3R1

Thus far we are seeing a pause not a rejection, but given weekly chart RSIs on QQQ and VTI especially, along with upper Bollinger bands on weekly SPY, DIA, IWM and VTI, a reversal here has decent odds. Bearish concerns would be alleviated with any clear and close above Q3R1s next week.

Also, with all USA main indexes above all pivots and all MAs all with rising slopes, cannot get carried away with any bearishness. 

SPX / SPY / ESU / ES1
SPX W: Looks like it should reach 2HR1 2503.
SPY D: For now, Q3R1 and JulR1 resistance. 
ES U: Look at all the nicely rising moving average lines.
ES 1: Possible reversal bang on on Q3R1 and JulR2, with RSI up to 68.2 at the recent peak.
SPX sum - Healthy uptrend but pause or possible reversal on Q3R1 and JulR2. 

22 6 ESU D.png
22 7 ES1 D.png

NDX / QQQ / NQU / NQ1
NDX W: Looks like higher levels possible. Watching weekly RSI carefully.
QQQ D: So far no selling at prior high area, but also at Q3R1.
NQU D: In 5% drop, only 10 and 20MA broke and bent; 50MA broke but did not bend; nicely rising D100 near the low, and D200 not seen since early July 2016!
NQ1: So far more like pause not reversal.
NDX sum: Strong uptrend but near prior highs and Q3R1 worth watching for possible reversal. Also watching RSI on weekly chart.
 

22 8 NDX W.png
22 10 NQU D.png

INDU / DIA
W: Still doing fine above YR1. 
D: Did not reach Q3R1, and back under JulR1. 
INDU sum: Above all pivots, all MAs rising, above all MAs; JulR1 watching as possible resistance.

22 15 DIA D.png

RUT / IWM
RUT W: Looks about to get whacked. Not sure how the cash index shows higher high and reversal on Friday but maybe option expiration related.
IWM D: JulR1 near tag and down. Still a more threatening reversal here than the others, below the low of the high bar. 
IWM D: Above all MAs, with all MAs having rising slopes. 
RUT sum: More threatening reversal here, especially the look of the cash index. However, still decent uptrend above all pivots and rising slope MAs so cannot get carried away with any bearishness. 

22 17 IWM D.png
22 18 IWM D.png

NYA & VTI
NYA W: Above YR1 is positive but given weekly chart RSI a fade back under the level could happen. Otherwise 2HR1 next level above.
NYA D: Still holding YR1 as support; resistance at Q3R1 and JulR2 like the others. 
VTI W: Decent higher highs above YR1. Doing fine, but look at RSI.
VTI D: Also down from near test of Q3R1.

USA main indexes

Sum
The most important event was that after several weeks of consolidating at yearly resistance levels, these turned into support for a decent launch. SPX YR1, INDU YR1, NDX YR2 all turning into solid support and clear lift-off. Now we can watch for a move to higher targets, starting with SPY, DIA and VTI Q3R1s and then ideally longer term levels at some point in the second half.

Near term levels to watch are NYA YR1, QQQ JulR1, and the VTI close high area. A fade from those may indicate a short hedge on IWM. NYA joining YR1 party would be bullish and confirm high chance of quickly seeing the higher level targets, meaning Q3R1 on SPY, DIA and VTI.

SPX / SPY / ESU / ES1
SPX W: 8th bar above the YR1 and finally a decent launch. 2HR1 2503, YR2 2576. This does kinda look like w5 division of W3 that has been running from 6/2016 fwiw. 
SPY D: Near term target Q3R1 247.03 along with JulR2 just above.
ESU D: Another buy signal on pivots with MACD and nice hold of D50MA and launch. 
ES1 D: Pushing outside the BB sign of strength; that divergence low on 7/11 that fractionally cleared the pivot was interesting tell.S
SPX sum - all looking good here, decent new high with daily RSI not yet overbought. Should reach higher targets starting with Q3R1 and then 2HR1 is above that. 

15 4 SPY D.png
15 5 ESU D.png
15 6 ES1 D.png

NDX / QQQ
NDX W: Also lifting above YR2, very bullish. 2HR2 is above 6000.
QQQ D: At JulR1, level to watch.
NDX sum: Watching JulR1 and then if above that should test highs. 
 

COMPQ
Also might be worth watching this level too - COMPQ (broader than N100).

15 9 COMPQ W.png

INDU / DIA
INDU W: Look at that YR1 turn into support - no selling pressure for several weeks then blast-off. 
DIA D: Q3R1 higher like SPY.
INDU sum: Should reach higher targets starting with Q3R1.

15 11 DIA D.png

RUT / IWM
RUT W: Lift above 2HP is good, but still not really getting in gear. 
IWM D: Lift above all pivots bullish, but reluctant rally. Due to wide range of June, JulR1 decently higher and may not tag.
RUT sum: Reluctant, still can be considered as short hedge candidate though we may not see JulR1.

15 12 RUT W.png

NYA & VTI
NYA W: YR1 11895 only fractionally above - still to watch.
NYA D: Hold of JulP was key on 7/11!
VTI W: Some struggle at YR1 then clear. 
VTI D: Looks more like 2x top from 6/19H.
Sum: NYA YR1 level to watch for next week; VTI appears going for Q3R1 like SPY and DIA.

15 16 VTI W.png

USA main indexes

Due to the way the scripts work in tradingview.com, new pivots won't show until bars open on Monday. So this week I'm going to focus on big picture quarterly and monthly charts, weekly chart with yearly levels only, and perhaps manual calculation on a few key indexes.

Sum
Quarterly charts are in amazing uptrends, all indexes well above all moving averages with impressive upward slopes. RSIs on these charts are *above* previous peaks, which I think will help limit damage on a pullback. Trends have been so strongly up, anything -5% will be seen as a great opportunity.

Monthly and weekly charts with pivots are another story. Most monthly charts show RSI and BB divergence, a classic move before a drop. And most importantly to my view:

SPY testing YR1 but still above - key level to watch
QQQ second fractional move below YR2 - anything lower is bearish, needs to have weekly close above to reduce the threat
DIA just below YR1 after 1 week above the level - anything lower is bearish, needs to have weekly close above to reduce the threat
VTI dropping YR1 after 4 bars weakly above - anyshthing lower is bearish, needs to have weekly close above to reduce the threat

3 of 5 USA mains under YR1/YR2s, and one other testing. I try to keep an open mind and acknowledge the trends, but if you consider the yearly levels in play here, RSI and BB divergences on monthly and weekly charts, it seems to be the market is about to get whacked.

But all this concern will dissipate with big gap and go on Monday, which could easily happen.

SPY Q
Massively above all MAs, RSI higher than 2014 peaks means no divergence. 7 quarters in a row - amazing run. Small wick on current weaker up candle some risk of selling as next move but overall very healthy and still a comfortable long term hold. 

SPY M
Above all MAs since 3/2016. Slight RSI divergence, but to me looks better with RSI above the 70 level. BB (Bollinger band) divergence compared to 2/2017 and 3/2017 tops. Wick and small gain invites selling. Uptrend, but pullback due.

SPY W
Above the YR1, but so far only 1 bar up above this level and since then 4 bars of selling. Still holding as support, and key level to continue to watch. Also note RSI divergence top and starting to roll over. 50 area likely better buy zone along with some pivot level if the YR1 cracks. 

1 7 SPY W.png

QQQ Q
Falling back inside Q BB also invites selling. However RSI no divergence yet, so still comfortable as a long term hold. 

QQQ M
RSI divergence. Coming back inside BB after 5 straight months outside. I 'think' upside limited to BB on any up move early in July if that happens. 

1 9 QQQ M.png

QQQ W
Long term buyers of technology in 3/2016 and, end 6/2016 and 7/2016 have had almost no worries until one week in May 2017, and 2 of the last 3 bars. YR2 second break - anything lower looks bad. Takes a weekly close back above to relieve this threat. 

DIA Q
RSI strong and 2nd close outside BB - wow.  

1 11 DIA Q.png

DIA M
RSI still slightly higher but classic BB divergence on the last bar compared to the highs earlier in the year. Wick invites selling.

1 12 DIA M.png

DIA W
Screaming RSI divergence and slightly below the very important YR1. Why shouldn't this level be as important as the 6/2016 YP hold or the 1-2/2016 YS1 holds? Real chance of significant top with anything lower.

IWM Q
2 smaller up bars and some RSI divergence invites selling. 

IWM M
RSI divergence and BB divergence on the last 2 up bars (highs inside BB, previous highs outside). But at least stronger up on last bar and still above all rising MAs. 

1 15 IWM M.png

IWM W
Between long term levels. 

VTI Q
RSI strong and massively healthy advance in play. 

1 17 VTI Q.png

VTI M
RSI divergence and again, classic BB divergence with small up bar with a wick. The door is wide open for sellers. 

1 18 VTI M.png

VTI W
Break of YR1 after trying to clear and stay above the previous 4 bars. Last weeks to have bearish conclusion on yearly level was 8-9/2016 before the drop. RSI divergence also in play.

USA main indexes

Abbreviated version with 1 chart per index.

Sum
Bulls still in charge with no sign of selling from key levels. DIA holding above YR1 throughout, and VTI recovered YR1 on Friday after 2 day slight break. QQQ back above all pivots as of 6/21. and basically holding YR2 as support with just 1 day fractional break in June. SPY well above its YR1 and also holding above Q2R1. IWM also above all pivots and nearly testing Q2R1.

Anything lower would look significant with YR1 rejections on DIA and VTI, but that hasn't happened. yet.

SPY
Well above YR1 which cleared and held 5/25-31, and then mostly above Q2R1 from 6/1 which has held as support on several tests. Overbought condition of 6/2 has worked too to RSI 53 on 6/22 with minimum of price damage. Still bullish here. 

QQQ
3 breaks of JunP and 3 recoveries. Held YR2 as support, back above 1HR3 as well. Testing Q2R2.

24 6 QQQ D.png

DIA
Top near 1HR2 so far, but still above the more important YR1. Also holding Q2R1 as support. Almost anything lower would be below YR1 so this is still the level to watch. 

24 7 DIA D.png

IWM
Above all pivots, nearly testing Q2R1 again. Doing fine this month.

VTI
2 days slightly below YR1 but recovery on Friday keeps the weekly bar above. 

USA main indexes

As with last week, shorter version with 1 chart per index. 

Sum
2017 leader QQQ slammed last week, but still above YR2 and JunP. The broader COMPQ had its high bang on YR2 and I think this makes last week's move a bit more threatening. 

But SPY and VTI are still holding above their YR1s, and IWM has gotten in gear. 

DIA is now testing its YR1. There have been many historical turns on Dow long term pivots. We could see one here. 

SPY
Trouble at JunR1 but still holding above Q2R1 and more importantly above YR1 as support. So, resistance at JunR1, support zone JunP to Q2R1. If higher, JunR1 in play.

11 4 SPY D.png

QQQ
Smash but still above YR2 and JunP. It would look much more bearish to be if those levels break and then start to look like resistance. In the bigger picture, Tech has run up so much that it would take a substantial drop to threaten any long term weakness, ie 1HP or soon to be in play 2HP. 

11 5 QQQ D.png

COMPQ
Broader Composite had high bang on YR2. 

11 6 COMPQ D.png

DIA
Testing YR1!

11 7 DIA D.png

IWM
Quick pop above Q2R1 to JunR2. 

VTI
Still holding YR1 as support. 

USA main indexes

Abbreviated posting this week. Instead of including all variations of the indexes I track, just posting 1 per index.

Sum
USA main indexes bullish last week, with QQQ continuing power move and jumping above Q2R1. Even more significant, SPY definitely clearing YR1 and VTI moving above YR1 as well. DIA testing major cluster ahead, and IWM near test of Q2R1. 

SPY D
Bullish with the jump above YR1. Also above Q2R1, and near JunR1. 

QQQ D
This just does not stop, with launch above Q2R2. First reference to "2017 Main index leader" was in January. Better move rotating all SPY & IWM positions to QQQ from there. 

3 4 QQQ D.png

DIA D
Major cluster approaching, YR1, 1HR2 and Q2R1. Now testing JunR1.

IWM D
Bounced from MayS1, jumped above Q2P and JunP, near test of Q2R1. 

VTI
Above YR1, bullish to maintain. 

USA main indexes

Sum
2017 leader Tech continues amazing run, clearing YR2 and 1HR3 which is big picture very bullish as long as these levels maintain threat of significant turn is reduced. Similarly, SPX set cleared YR1 for 2 trading days last week - bullish with the same logic, threat of major turn reduced if the index can maintain above these levels. INDU, NYA & VTI are at March highs. IWM bringing up the rear, still below MayP and likely leading down if markets lower next week.

Bullish scenario from here is IWM clearing MayP, DIA, NYA & VTI clearing March tops, and leaders going for next levels up which are QQQ Q2R2 and SPY Q2R1. Bearish scenario would be IWM breaking Q2P and SPX set back under YR1 for a pesky fake-out move. 

Charts
Cash index weekly charts with long term levels only
Daily ETF chart with long term & medium term pivots
Futures current contract pivots only (no S/R) and MAs for clarity of entries (now June 17 M)
Futures "1" continuous contract with Bollinger bands

SPX / SPY / ESM / ES1
SPX first close above YR1 2407 - maintaining above that is bullish.
SPY same idea, 240.90.
ESM showing entry chart with pivots only - MayP recovery & D50MA gave profitable buy chance, with MACD following through to positive 2 days later.
ES1 chart at the top daily BB, RSI not yet overbought. Next target area up is 1HR2 and Q2R1 combo.
SPX set sum - clearing YR1 is bullish and if maintains opens door to next level up, Q2R1 at 2427. That said the more important levels are the long term YR1 / 1HR2 combo at 2407 and 2400 respectively.

28 6 SPY D.png
28 7 ESM D.png
28 8 ES1 D.png

NDX / QQQ / NQM / NQ1
NDX W chart very bullish to be above YR2 & 1HR3.
QQQ nearing Q2R2, but more important is the YR2 clear.
NQM chart on pivot & MACD buy from 4/20
NQ1 chart some divergence on RSI currently.
NDX sum - very bullish to be above YR2. Next level Q2R2.
 

29 1 NDX W.png
29 3 NQM D.png
29 4 NQ1 D.png

INDU / DIA / YMM / YM1
INDU W bullish to hold 1HR1 as support - looks to be going for YR1 / 1HR2 combo.
DIA back above all pivots on 5/22. 
YM also back above all pivots 5/19, and above all MAs 5/22.
But current 2x top to continuous (and current) futures, as well as ETF & cash.
INDU set sum - above all pivots and MAs, but 2x top potentially in play. If higher then YR1 area next major level to watch.
 

29 5 INDU W.png
29 6 DIA D.png
29 8 YMM D.png
29 9 YM1 D.png

RUT / IWM / RJM / RJ1
Weekly chart between levels.
IWM much lower high, and though back above Q2P bounce capped by May thus far.
RJM chart does not have look of lift-off above any pivot on recent bounce, and MACD still negative.
RJ1 showing resistance at falling D20 and MayP combo.
RUT sum - Lagging but everyone knows it. Still likely to lead lower if markets down next week.

29 12 RJM D.png
29 13 RJ1 D.png

NYA & VTI
Both back above all pivots on 5/19. Both at double tops; if higher then VTI nearing YR1.

USA main indexes

Sum
2017 leader NDX / QQQ has stopped on significant long term resistance, YR2 & 1HR3. But trends remain strongly up (rising MAs across the board) and no RSI divergence on daily or weekly charts.

SPX set saw selling from YR1 / 1HR2 area and broke MayPs, but managed to recover MayP on Friday. As long as MayPs holds, bulls get benefit of doubt.

This was also the case for NYA & VTI - although they didn't reach long term pivot resistance, Q2P test on NYA held and both back above all pivots on Friday.

INDU / DIA is a bit weaker with more glaring RSI divergence, and testing MayP - not conclusively above.

RUT / IWM, the weakest of the 5 for much of this year, remains below Q2P. 

My take - as long as SPY and VTI are above MayPs, bulls get benefit of doubt and IWM may recover Q2P again with NDX / QQQ resuming up. But if those break for the 2nd time this month, I expect that to be definitive and IWM will continue to lead main indexes lower. 

Charts
Cash index weekly charts with long term levels only
Daily ETF chart with long term & medium term pivots
Futures current contract pivots only (no S/R) and MAs for clarity of entries (now June 17 M)
Futures "1" continuous contract with Bollinger bands

SPX / SPY / ESM / ES1
SPX W deserves careful attention with double top on YR1 / 1HR2 area. This could be as important as double bottoms on 2HS2 in 2015 and YS1 / 1HS1 in 2016. However, last candle also gives chance for comeback, with hold of 10MA and rising 20MA (MAs not shown).
SPY D shows another fake break which is a bit annoying if you take action on it (4/13 break of Q2P followed by immediate recovery, and 5/17 followed by recovery in 2 days).
ESM shows resistance at the 3/1 highs, with only 2 slight closes above. 50MA rolling over to flat slope.
ES1 visit to lower daily BB especially with rising slope was bought. 
SPX set sum - YR1 / 1HR2 stopping the rally twice is potentially bearish, but as long as index is back above all pivots bulls get benefit of doubt on a comeback.

21 11 SPY D.png
21 12 ESM D.png

NDX / QQQ / NQM / NQ1
NDX W chart shows selling at YR2 and 1HR3.
QQQ on Friday still had resistance at YR2.
Futures charts still nicely rising MAs and well above all pivots. 
NDX set sum - strong trends, but selling at significant resistance of YR2 / 1HR3.


21 16 NQM D.png

INDU / DIA / YMM / YM1
INDU holding 1HR1 as support looks more bullish.
Back to MayPs but DIA testing level and not clearly above.
D50MA still appears to have negative slope. 

21 20 YMM D.png
21 21 YM1 D.png

RUT / IWM / RJM / RJ1
Weekly chart between levels.
IWM 2nd break of Q2P and still below, although did hold MayS1 on the low. 
D50MA and even D100 are flat. 

21 23 IWM D.png
21 25 RJ1 D.png

NYA & VTI
Both selling from double top area, but both back above all pivots on Friday gives bulls benefit of doubt. 

21 26 NYA W.png
21 28 VTI W.png

USA main indexes

Sum
USA leader Technology (NDX / QQQ & futures) looks fantastic, testing YR2 without any sign of rejection thus far. The recent few day dip to the rising D50MA on 4/13 held massively and started another healthy leg higher, well above all pivots and all above the 10MA since 4/20.

It is a very different picture in the other main indexes which have either not sustained a move above the 3/1 highs (SPY & IWM) or simply failed to go higher (DIA & NYA/VTI). Most are above all pivots, but IWM is below MayP for the second time this month. SPX is bumping up against YR1 / 1HR2 resistance area.  

Bullish scenario would be tech continuing to lead, IWM back above MayP, and SPX starting to clear YR1 though SPY version of the same level is a bit higher. Bearish scenario would be NDX back under YR2 (Friday closed 2 points above), IWM under Q2P and DIA, NYA/VTI under MayPs. As I have been saying the last two weeks, odds seem a toss up here and will try to factor in safe havens, other technicals, etc, to decide what is more likely.

Charts
Cash index weekly charts with long term levels only
Daily ETF chart with long term & medium term pivots
Futures current contract pivots only (no S/R) and MAs for clarity of entries (now June 17 M)
Futures "1" continuous contract with Bollinger bands

SPX / SPY / ESM / ES1
Pause at YR1 / 1HR2 resistance 2400-2407.
SPY resistance levels are higher but still resistance 3/1 highs.
ESM above all pivots, above all MAs except 10 by a hair
ES1 YR1 tag and down.
SPX set sum - Pause at YR1 / 1HR2 resistance but tepid selling thus far and it may try to come back.
 

14 3 ESM D.png
14 4 ES1 D.png

NDX / QQQ / NQM / NQ1
Weekly cash chart 2 points above level, YR2 5684.
QQQ slightly above.
NQM all above 10MA, incredible.
NQ1 just under YR1.
NDX set - looks to be in process of clearing but futures not quite there yet and 2 points really too close to call.

14 5 NDX W.png
14 6 QQQ D.png
14 7 NQM D.png
14 8 NQ1 D.png

INDU / DIA / YMM / YM1
Between long term levels.
DIA above MayP.
YMM above MayP and 20MA, but below10MA. Also note slope of D50 starting to level out.
INDU sum - Above all pivots and not an any resistance areas, but a bit weaker than SPX via moving averages and D50MA starting to level out, a sign of slowing trend. 
 

14 11 YMM D.png

RUT / IWM / RJM / RJ1
Weekly chart between levels.
IWM high on Q2R1 near exact, and 2nd time below MayP. Again testing Q2P.
Futures charts show low on Q2S1 and high on R1, back to Q2P. Also note flat D50MA.

14 15 RJM D.png
14 16 RJ1 D.png

NYA & VTI
Both not at long term resistance levels. Both pausing at 3/1 close highs, but both above MayPs.

14 18 NYA D.png

USA main indexes

Sum
All USA main indexes are above all pivots, and all but IWM is above all MAs (IWM above all except 10MA). This is very bullish configuration and the trend gets the benefit of the doubt.

But leader QQQ is nearing YR2 and SPY YR1, so this means test of significant resistance is likely ahead. Also, on SPY, RSI approaching 70 area on both weekly and daily charts for SPY (RSI already 70+ on monthly and quarterly charts). So yearly levels are worth watching for a potential top, but anything above that sustains would be very bullish. 

Charts
Cash index weekly charts with long term levels only
Daily ETF chart with long term & medium term pivots
Futures current contract pivots only (no S/R) and MAs for clarity of entries (now June 17 M)
Futures "1" continuous contract with Bollinger bands

SPX / SPY / ESM / ES1
SPX weekly approaching long term resistance area of the 1HR2 & YR1 2400-2407. Positive to clear the previous weekly close high in the solid red line. Also note RSI at 68.2 approaching 70 level, possibly setting up divergence top. 
SPY right at the 3/1 close high. YR1 & 1HR2 a bit further out at 240.90.
ESM nothing wrong with this chart, nice hold of Q2P, recovery of MAs and heading up.
ES1 shows above 3/1 close high and heading into YR1 at 2403.
SPX set - Approaching YR1 / 1HR2 resistance area. Daily charts above all pivots and MAs is bullish; daily and weekly RSIs getting up there and worth watching 70 area tags if higher Monday.

6 12 ESM D.png
6 13 ES1 D.png

NDX / QQQ / NQM / NQ1
NDX W heading to YR2 at 5684.
QQQ brief dip below AprP, recovery and another rocket up from there. 
NQ huge hold of D50MA.
NQ1 chart shows YR2 a bit higher than cash index probably due to 11/8/2016 influence. 

6 15 QQQ D.png
6 16 NQM D.png

INDU / DIA / YMM / YM1
INDU long term resistance a bit further away.
Daily charts doing fine with hold of MayP and up. AprR1s doable. 

6 18 INDU W.png
20 YMM D.png
6 21 YM1 D.png

RUT / IWM / RJM / RJ1
Weekly chart also further away from levels.
Daily chart above pivots, but further from 3/1 high. So far Q2R1 is the top. Also, compared to QQQ move after 4/20 this has been very dissapointing. 

6 22 RUT W.png
6 24 RJM D.png
6 24 RJM D.png

NYA & VTI
NYA above 2HR1 looking good.
Daily chart nice hold of MayP and UP. AprR1 doable and maybe Q2R1 above that. 
VTI similar, again at 3/1 close high but looks ready to get through. 

6 27 NYA D.png
6 28 VTI W.png
6 29 VTI D.png

USA main indexes

Sum
2017 USA main index leader NDX / QQQ looks fantastic, with convincing new highs, not yet at pivot resistance, and no other warning sign such as RSI divergence. Others are not in the same league: SPX and NYA/VTI both stalled at 3/1 close high levels, with SPX near tag of 1HR2 as well. RUT set reached Q2R1 but then major selling from there and back under 3/1 highs, making that look like a failed high. INDU mild drop from AprR1. 

So the leader still strong, but the others leave some to be desired. If higher, I think the SPX set YR1 / 1HR2 / Q2R1 combo will cap upside. New MayPs in play on Monday, and bulls will want to see all 5 indexes stay above these levels for better chances of another push to highs. 

Charts
Cash index weekly charts with long term levels only
Daily ETF chart with long term & medium term pivots
Futures current contract pivots only (no S/R) and MAs for clarity of entries (now June 17 M)
Futures "1" continuous contract with Bollinger bands

SPX / SPY / ESM / ES1
Weekly chart looks quite toppy here with test of YR1 1HR2 area.
SPY a bit shy of levels.
ES still on buy and MayPs will be telling.
ES1 also has red line drawn at the close highs.
SPX set sum - Trend is up but chances of a top have now increased with SPX 1HR1 near test and down as well as selling at the 3/1 close highs. If higher, then 2400-2407 significant resistance which includes SPX YR1, 1HR2 and Q2R1. 

29 11 SPY D.png
29 12 ESM D.png
29 13 ES1 D.png

NDX / QQQ / NQM / NQ1
Still superstrong and looks like it should reach YR2.
QQQ includes medium term levels and Q2R1 is the first level to reach, then YR2, then 1HR23 is above that.
NQM huge hold of D50MA.
NQ1 blasted above the prior highs.
NDX set sum - 2017 leader still doing incredibly well. 
 

29 16 NQM D.png
29 17 NQ1 D.png

INDU / DIA / YMM / YM1
Similar pattern as SPX, but not on any long term level.
DIA near tag of AprR1 though (cash index also near tag of AprR1).
YMM will likely open above MayP.
YM1 not quite at previous close highs yet. 
INDU sum - Tag of AprR1, but could come back. Major cluster above previous highs at YR1, 1HR2 and Q2R1 all 21325 to 21425, roughly. 
 

29 20 YMM D.png
29 21 YM1 D.png

RUT / IWM / RJM / RJ1
Weekly chart doesn't look terrible from this view.
But daily chart has serious concerns with rejection of Q2R1 and failure at 2015 highs. 
RUT sum - Q2R1 resistance and prior high rejection just does not look good. 

29 23 IWM D.png
29 24 RJM D.png
29 25 RJ1 D.png

NYA & VTI
These didn't reach any pivot resistance levels on the recent highs, but clear selling from the 3/1 close highs shown in red on the daily charts. 

29 27 NYA D.png