Sum
2017 leader Tech continues amazing run, clearing YR2 and 1HR3 which is big picture very bullish as long as these levels maintain threat of significant turn is reduced. Similarly, SPX set cleared YR1 for 2 trading days last week - bullish with the same logic, threat of major turn reduced if the index can maintain above these levels. INDU, NYA & VTI are at March highs. IWM bringing up the rear, still below MayP and likely leading down if markets lower next week.
Bullish scenario from here is IWM clearing MayP, DIA, NYA & VTI clearing March tops, and leaders going for next levels up which are QQQ Q2R2 and SPY Q2R1. Bearish scenario would be IWM breaking Q2P and SPX set back under YR1 for a pesky fake-out move.
Charts
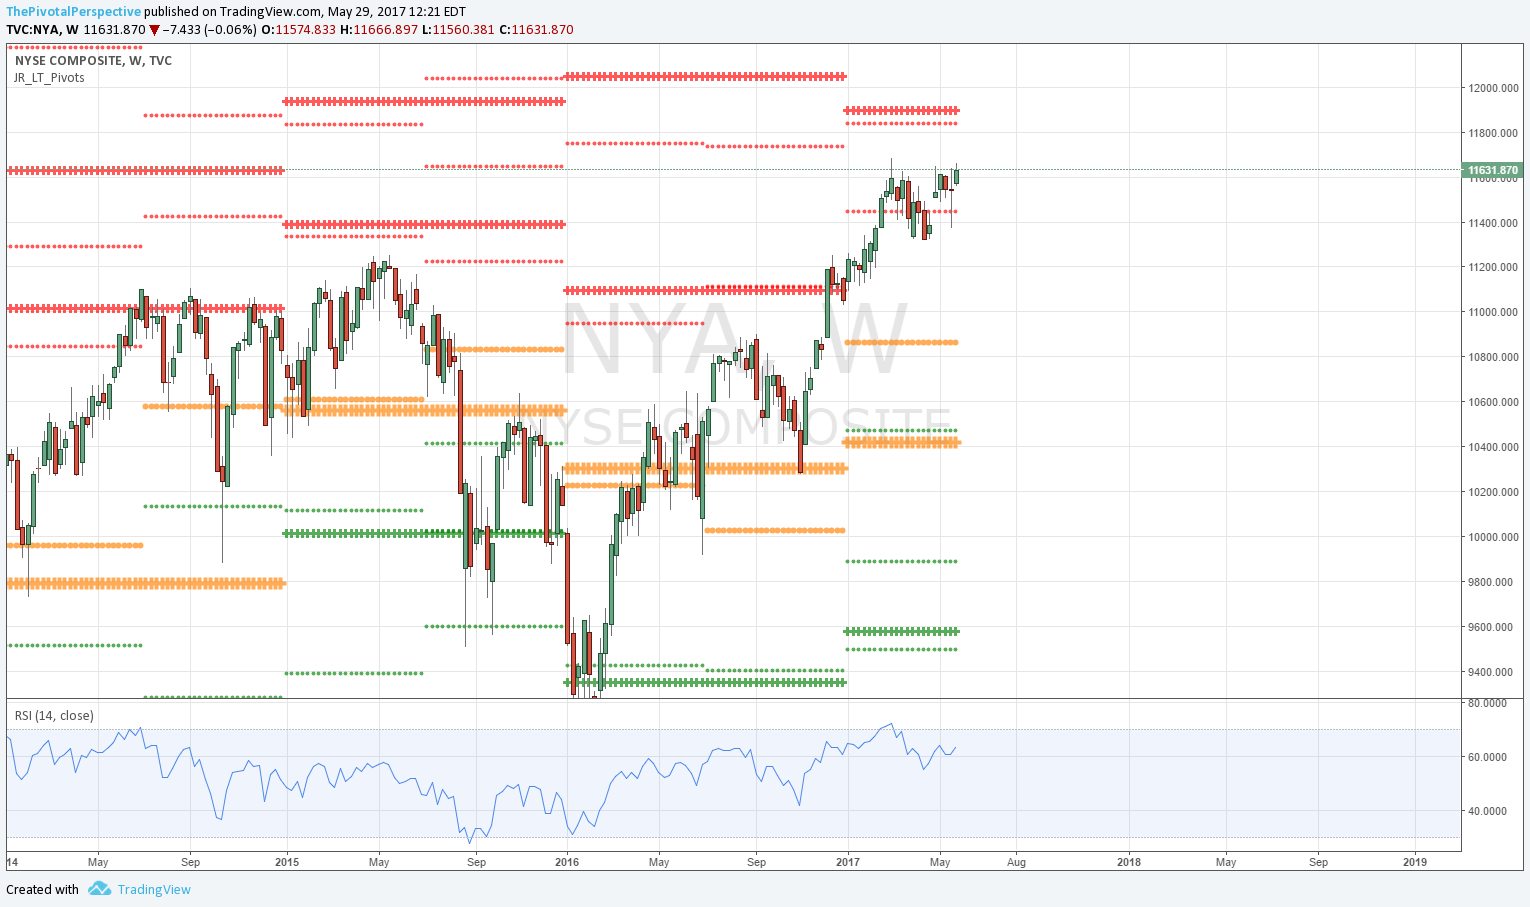
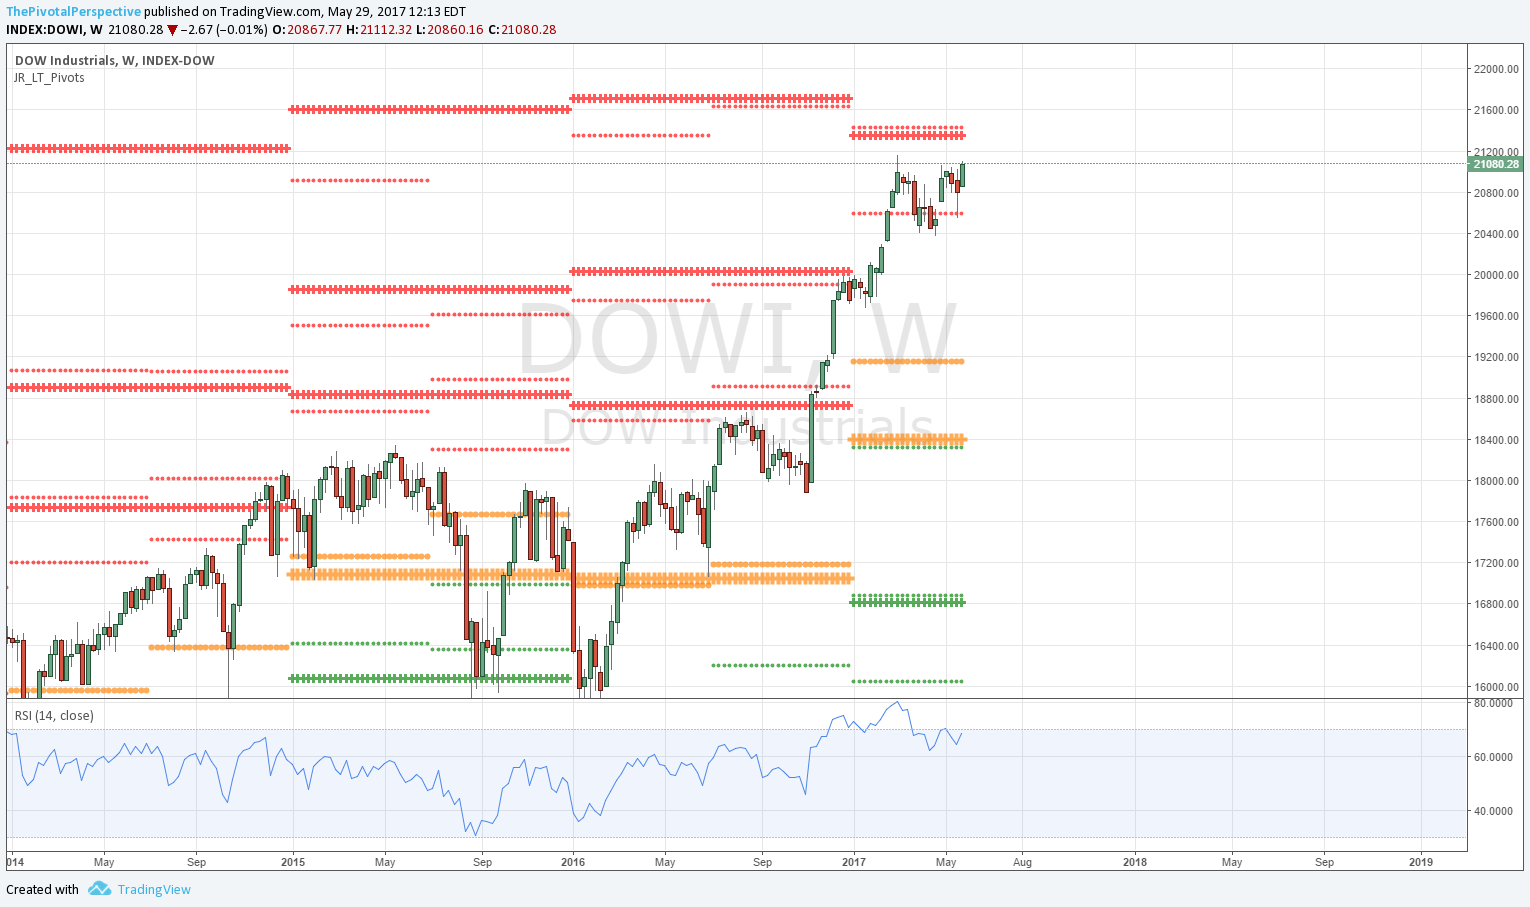
Cash index weekly charts with long term levels only
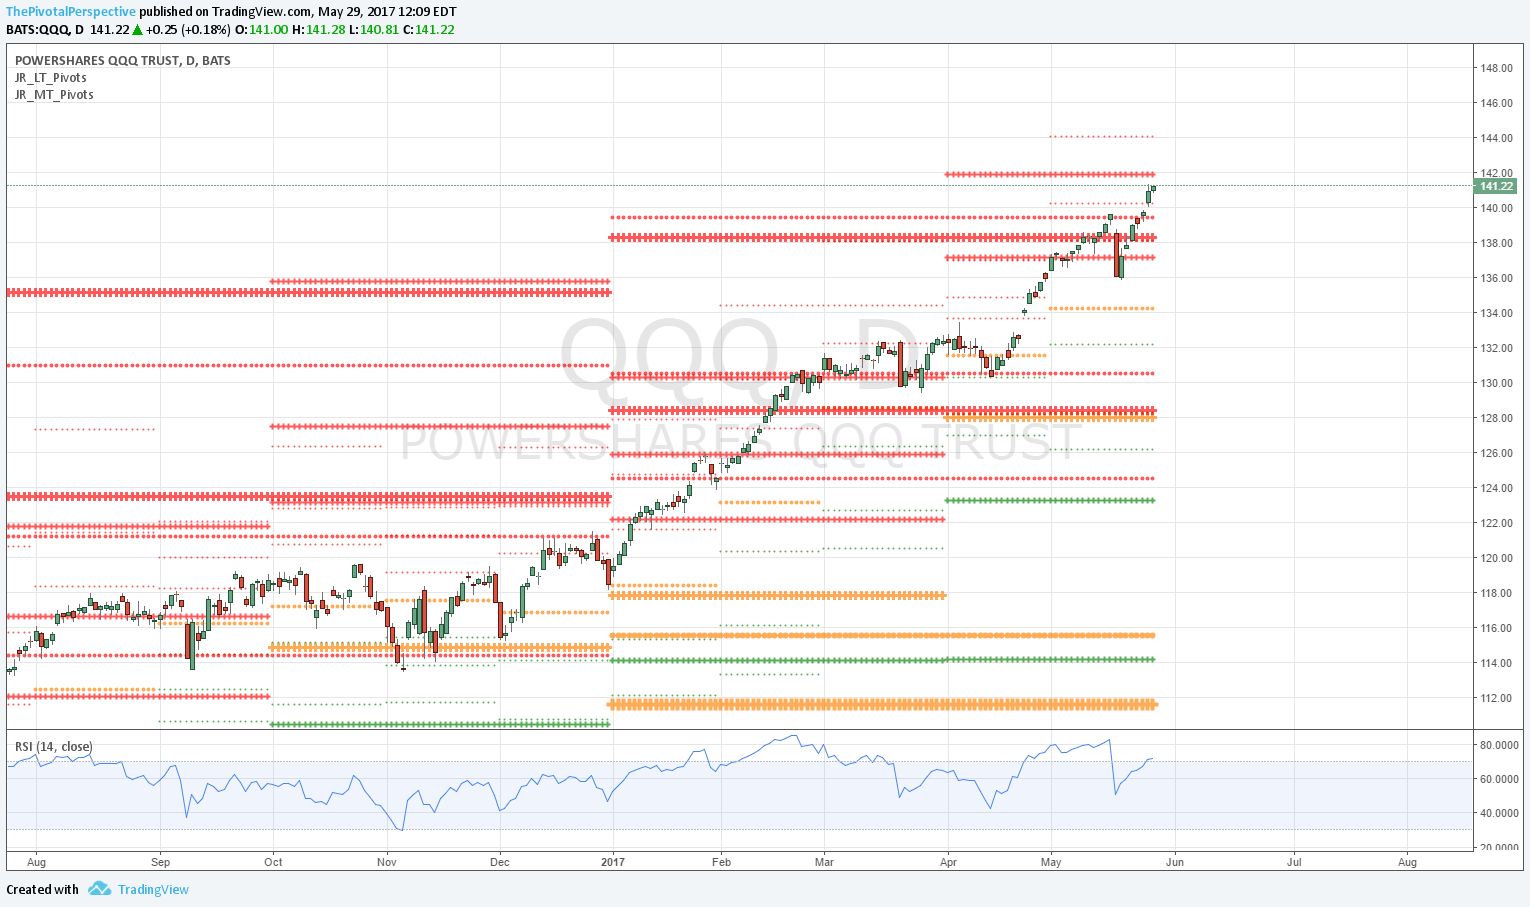
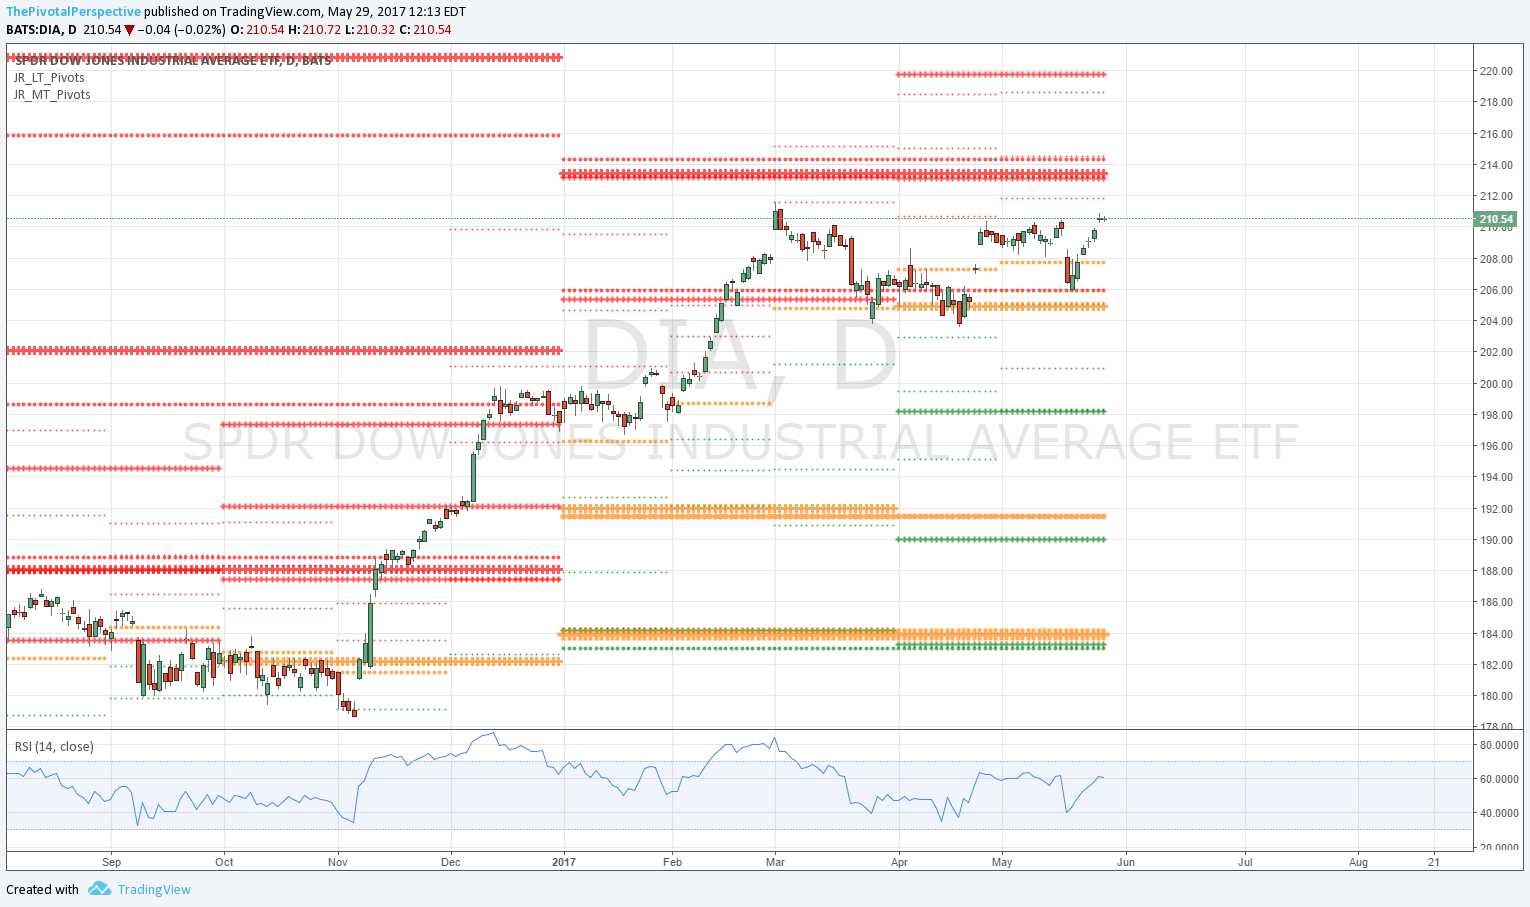
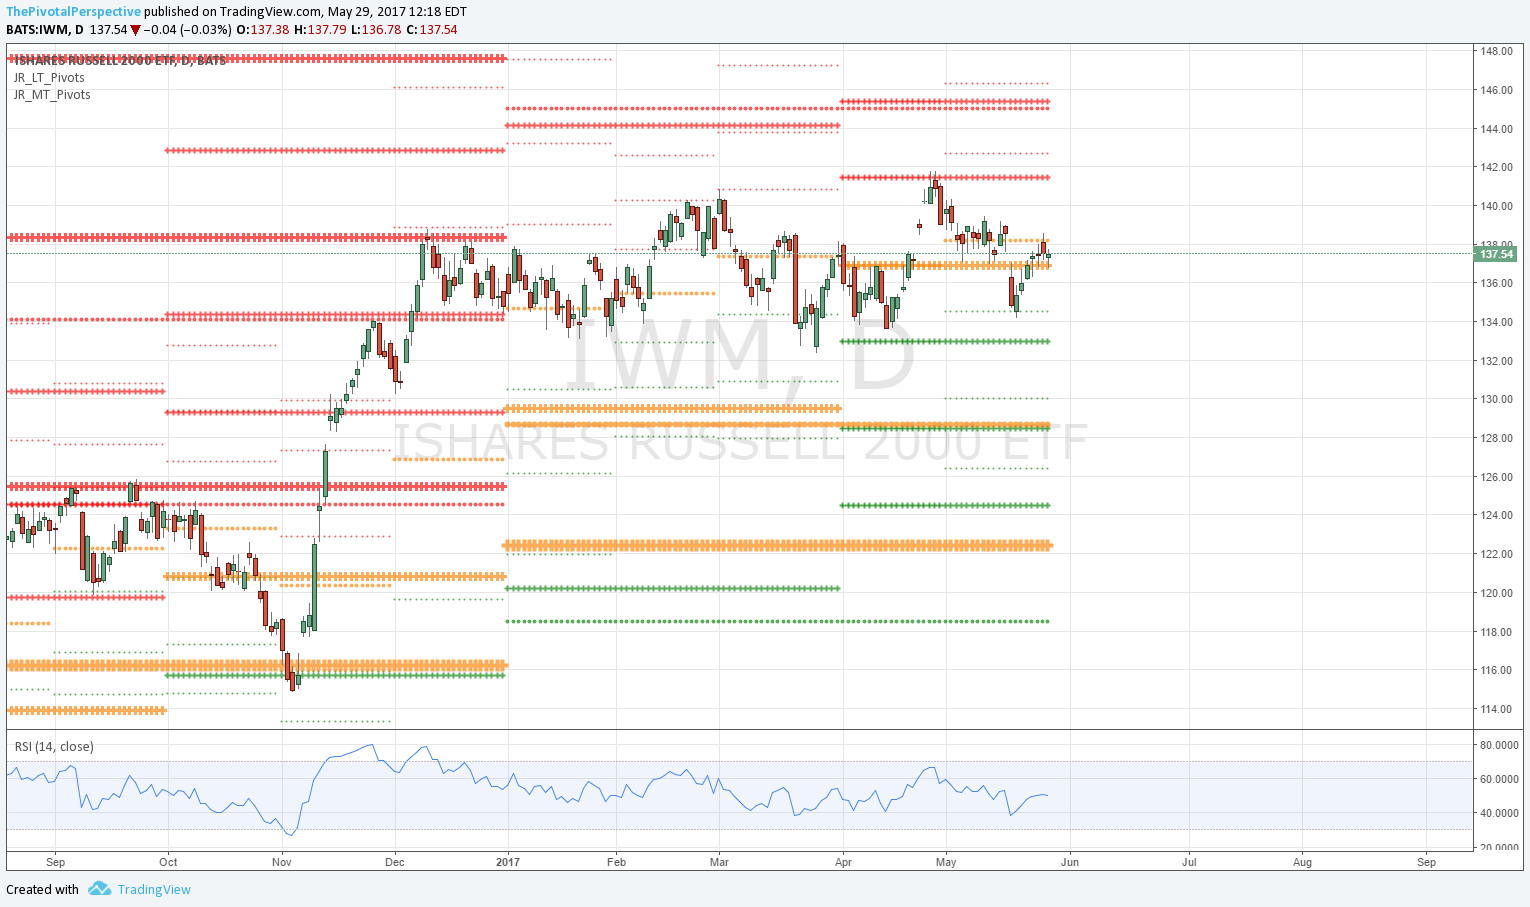
Daily ETF chart with long term & medium term pivots
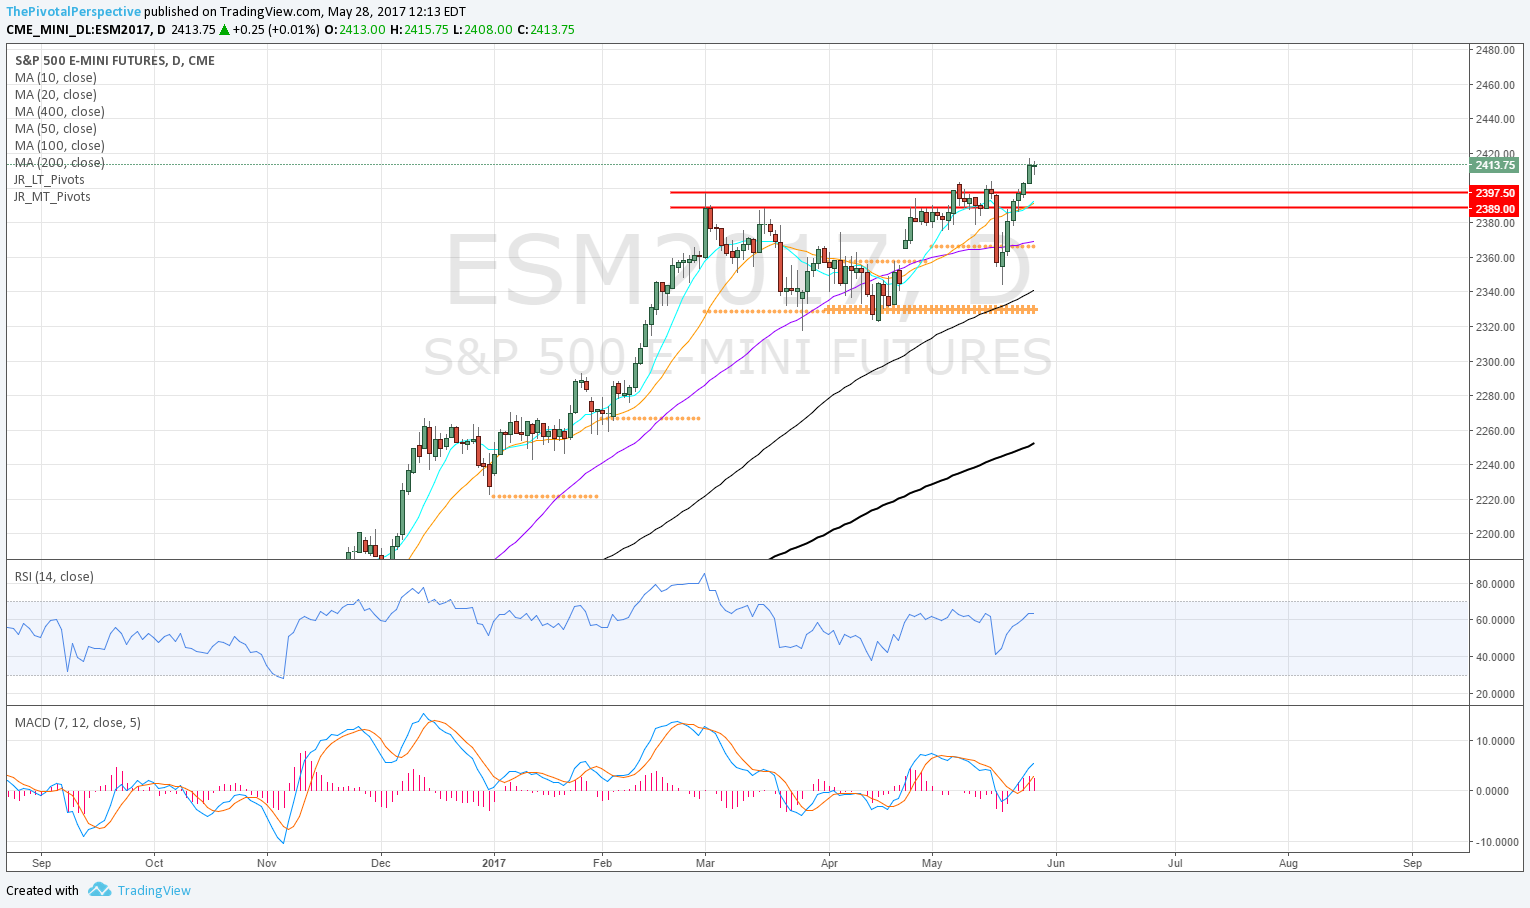
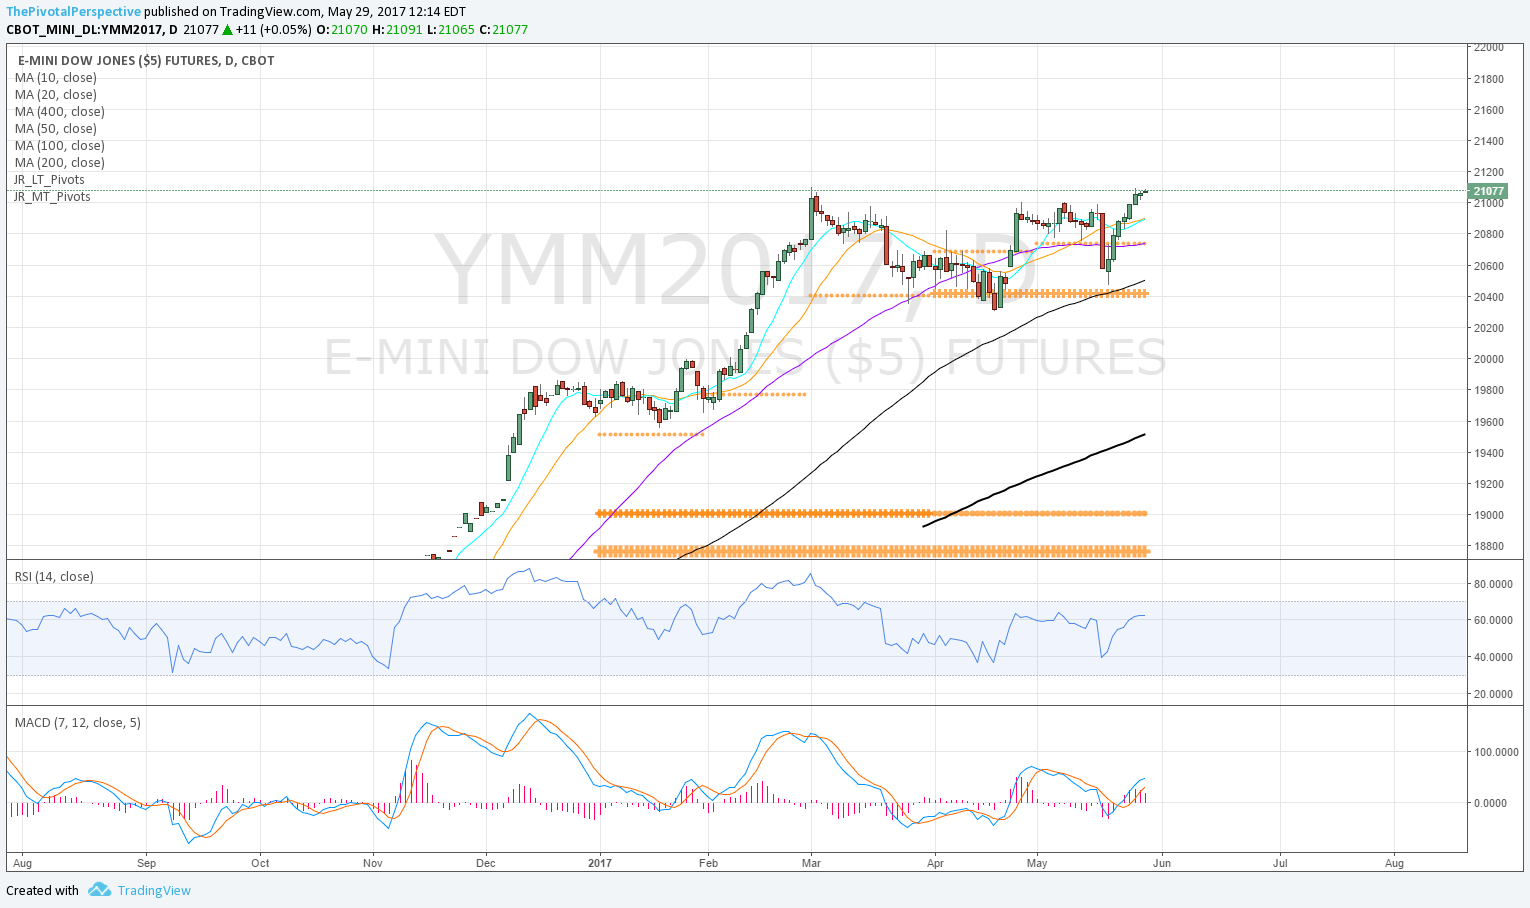
Futures current contract pivots only (no S/R) and MAs for clarity of entries (now June 17 M)
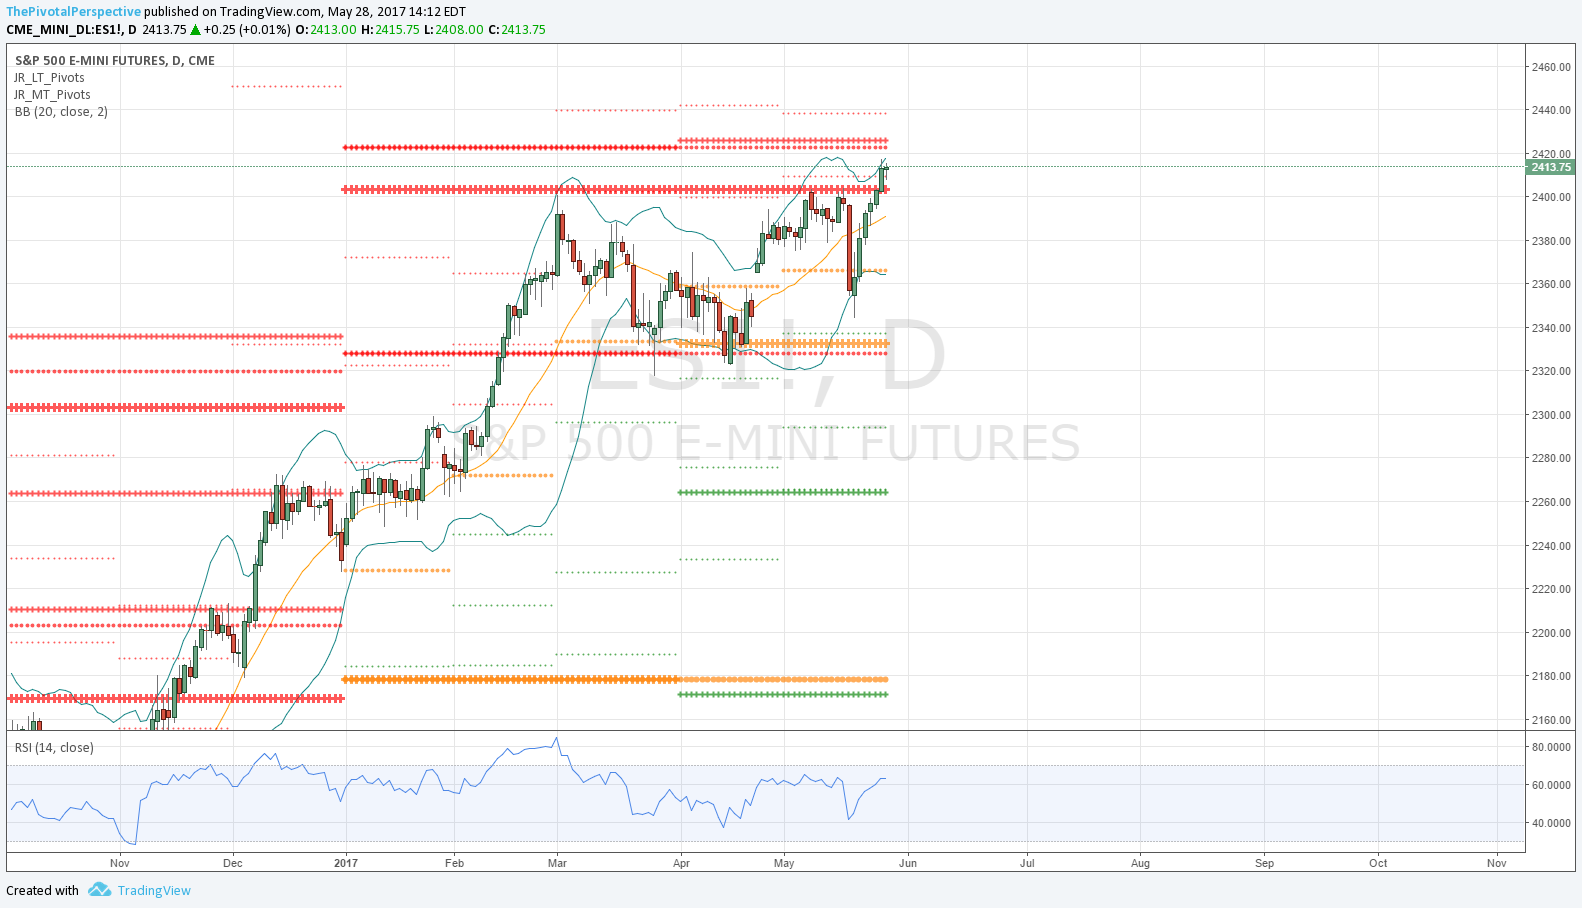
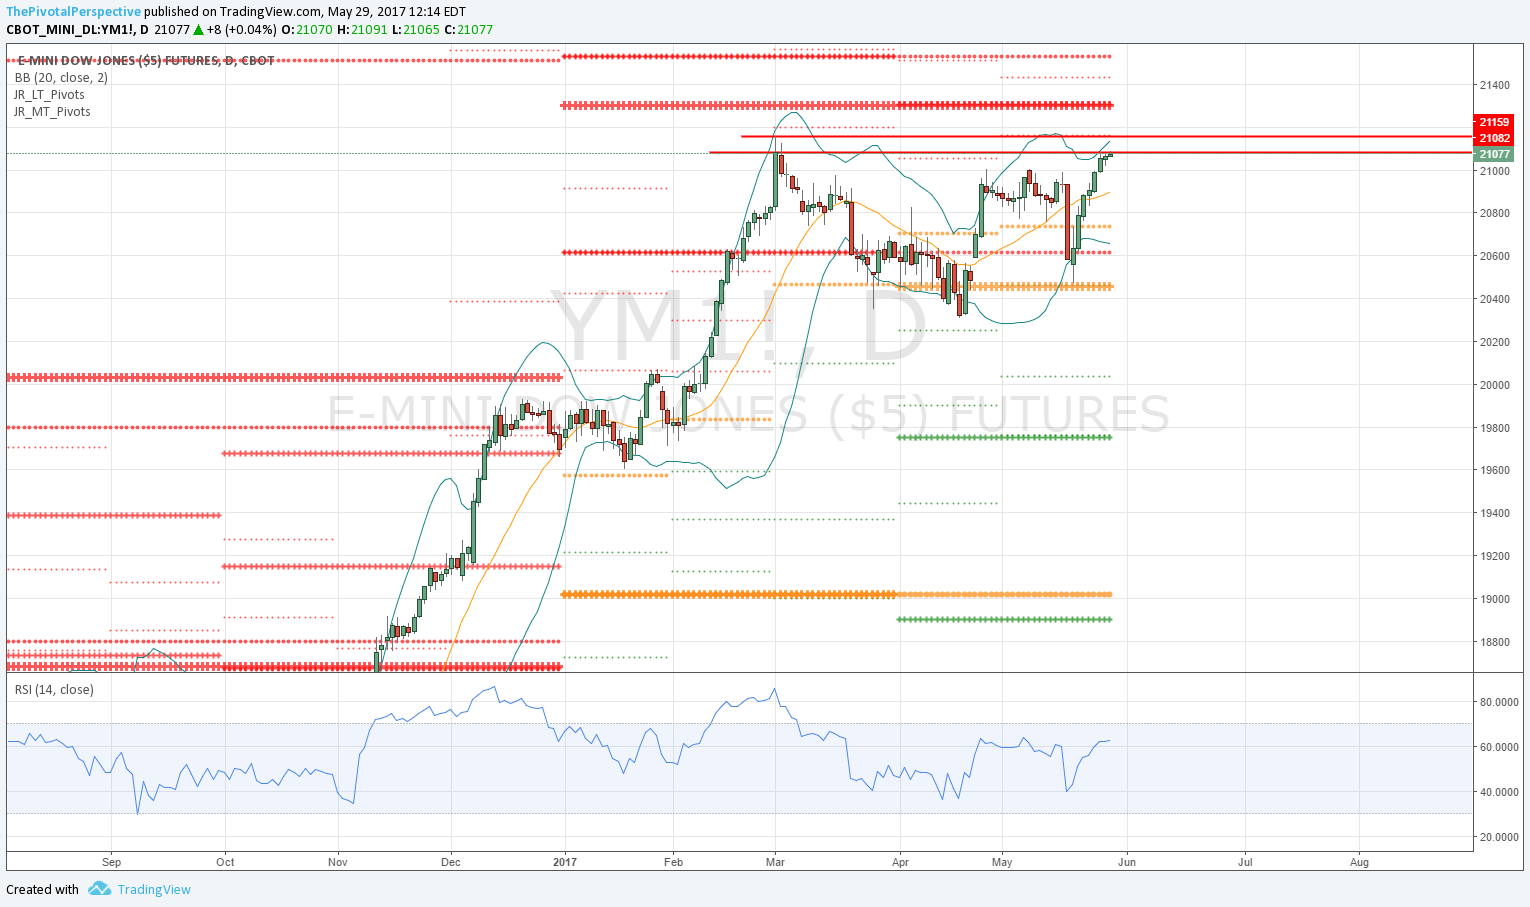
Futures "1" continuous contract with Bollinger bands
SPX / SPY / ESM / ES1
SPX first close above YR1 2407 - maintaining above that is bullish.
SPY same idea, 240.90.
ESM showing entry chart with pivots only - MayP recovery & D50MA gave profitable buy chance, with MACD following through to positive 2 days later.
ES1 chart at the top daily BB, RSI not yet overbought. Next target area up is 1HR2 and Q2R1 combo.
SPX set sum - clearing YR1 is bullish and if maintains opens door to next level up, Q2R1 at 2427. That said the more important levels are the long term YR1 / 1HR2 combo at 2407 and 2400 respectively.


NDX / QQQ / NQM / NQ1
NDX W chart very bullish to be above YR2 & 1HR3.
QQQ nearing Q2R2, but more important is the YR2 clear.
NQM chart on pivot & MACD buy from 4/20
NQ1 chart some divergence on RSI currently.
NDX sum - very bullish to be above YR2. Next level Q2R2.


INDU / DIA / YMM / YM1
INDU W bullish to hold 1HR1 as support - looks to be going for YR1 / 1HR2 combo.
DIA back above all pivots on 5/22.
YM also back above all pivots 5/19, and above all MAs 5/22.
But current 2x top to continuous (and current) futures, as well as ETF & cash.
INDU set sum - above all pivots and MAs, but 2x top potentially in play. If higher then YR1 area next major level to watch.
RUT / IWM / RJM / RJ1
Weekly chart between levels.
IWM much lower high, and though back above Q2P bounce capped by May thus far.
RJM chart does not have look of lift-off above any pivot on recent bounce, and MACD still negative.
RJ1 showing resistance at falling D20 and MayP combo.
RUT sum - Lagging but everyone knows it. Still likely to lead lower if markets down next week.


NYA & VTI
Both back above all pivots on 5/19. Both at double tops; if higher then VTI nearing YR1.