Sum
USA leader Technology (NDX / QQQ & futures) looks fantastic, testing YR2 without any sign of rejection thus far. The recent few day dip to the rising D50MA on 4/13 held massively and started another healthy leg higher, well above all pivots and all above the 10MA since 4/20.
It is a very different picture in the other main indexes which have either not sustained a move above the 3/1 highs (SPY & IWM) or simply failed to go higher (DIA & NYA/VTI). Most are above all pivots, but IWM is below MayP for the second time this month. SPX is bumping up against YR1 / 1HR2 resistance area.
Bullish scenario would be tech continuing to lead, IWM back above MayP, and SPX starting to clear YR1 though SPY version of the same level is a bit higher. Bearish scenario would be NDX back under YR2 (Friday closed 2 points above), IWM under Q2P and DIA, NYA/VTI under MayPs. As I have been saying the last two weeks, odds seem a toss up here and will try to factor in safe havens, other technicals, etc, to decide what is more likely.
Charts
Cash index weekly charts with long term levels only
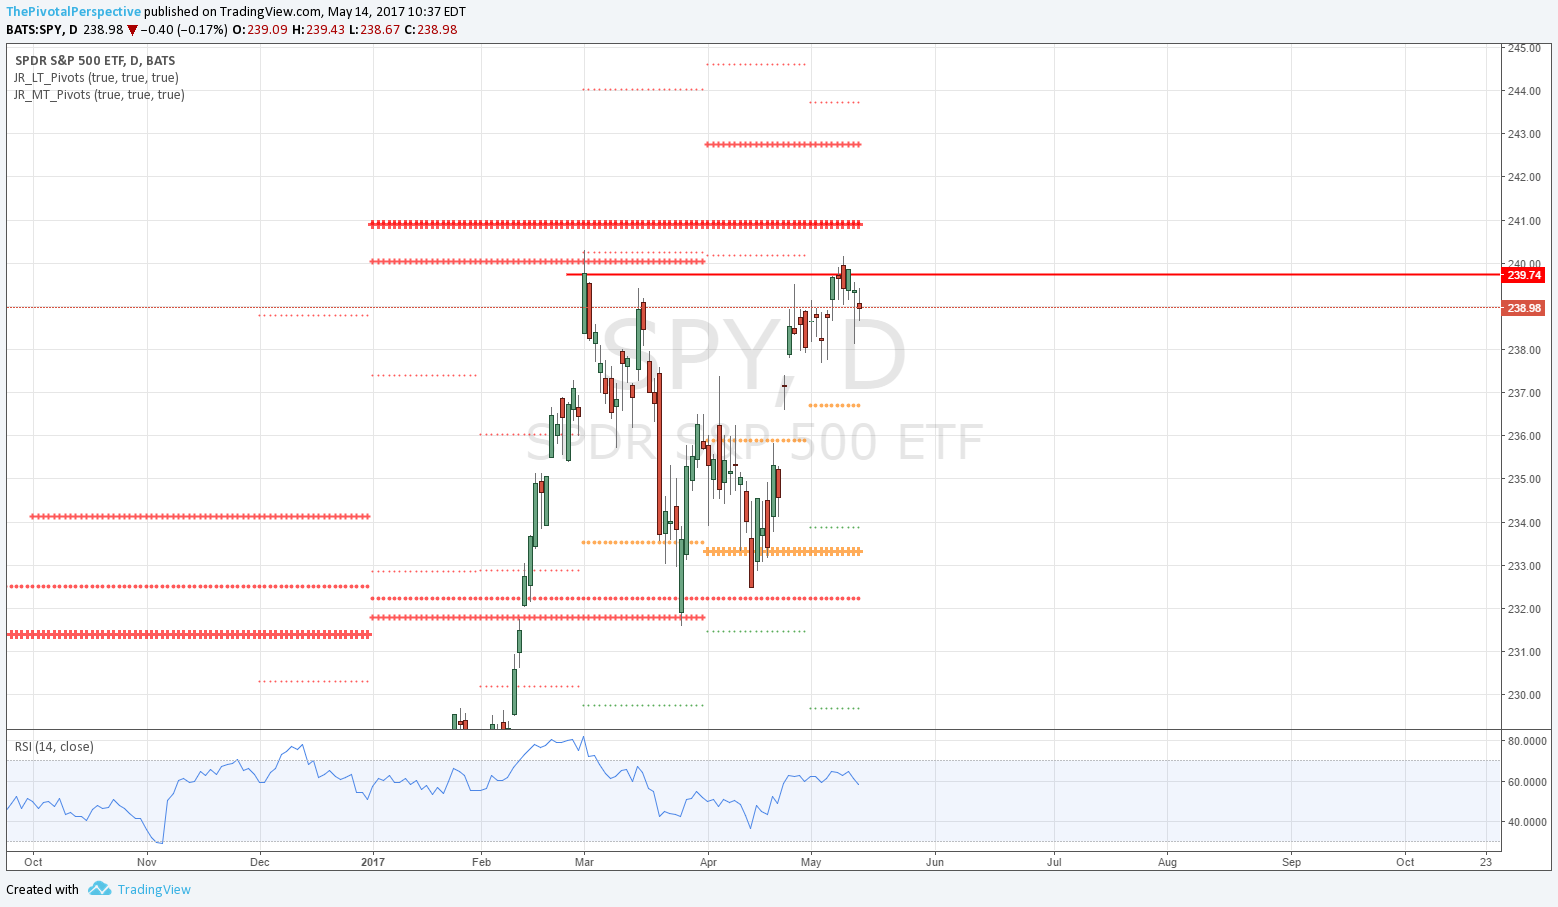
Daily ETF chart with long term & medium term pivots
Futures current contract pivots only (no S/R) and MAs for clarity of entries (now June 17 M)
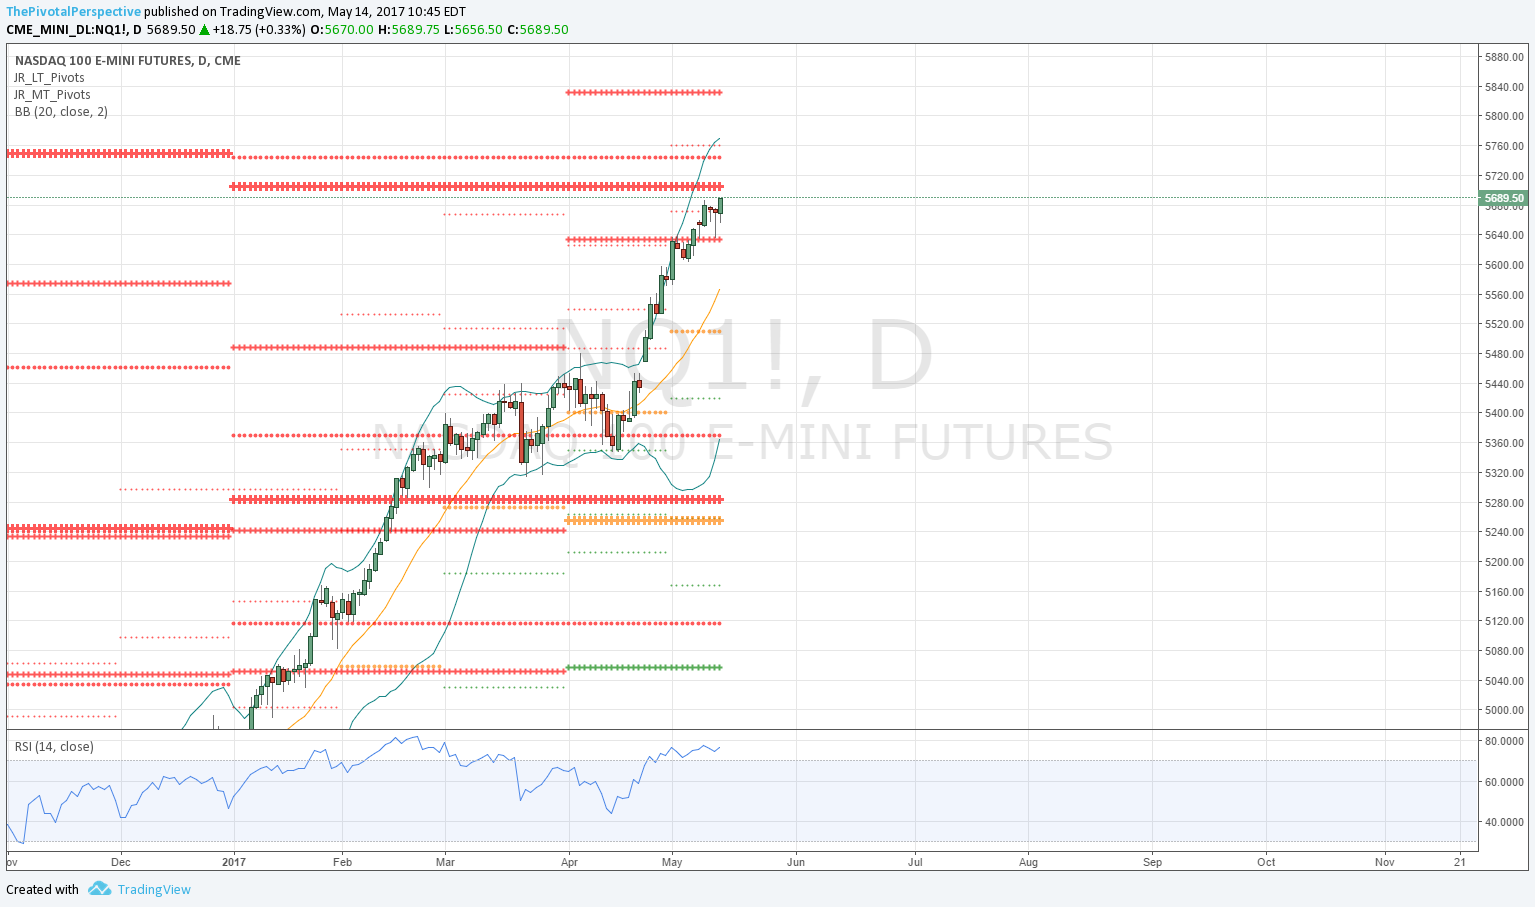
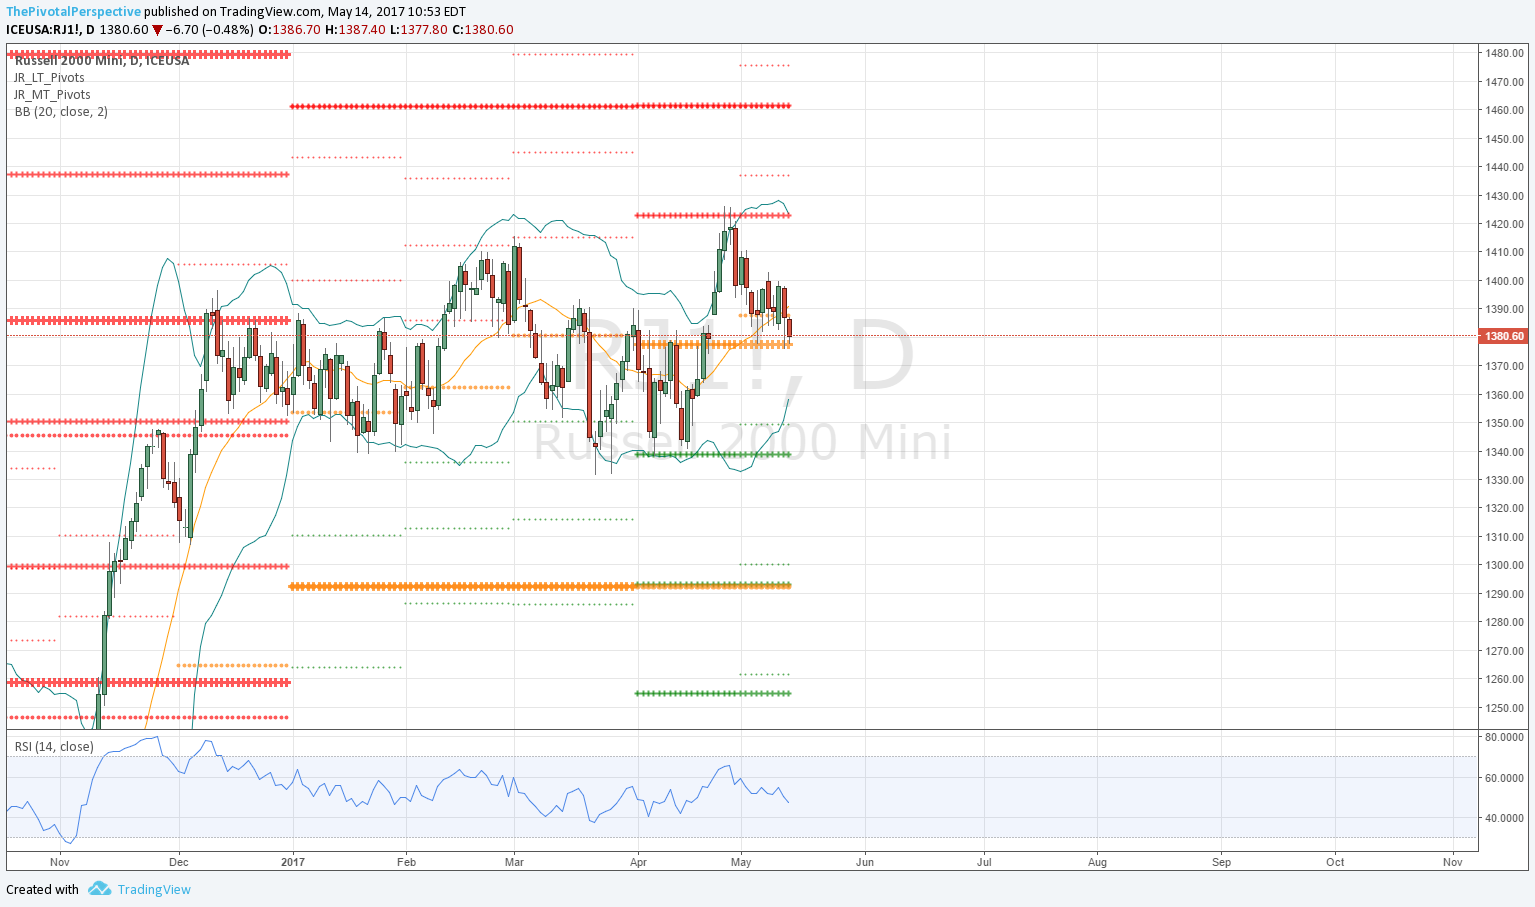
Futures "1" continuous contract with Bollinger bands
SPX / SPY / ESM / ES1
Pause at YR1 / 1HR2 resistance 2400-2407.
SPY resistance levels are higher but still resistance 3/1 highs.
ESM above all pivots, above all MAs except 10 by a hair
ES1 YR1 tag and down.
SPX set sum - Pause at YR1 / 1HR2 resistance but tepid selling thus far and it may try to come back.


NDX / QQQ / NQM / NQ1
Weekly cash chart 2 points above level, YR2 5684.
QQQ slightly above.
NQM all above 10MA, incredible.
NQ1 just under YR1.
NDX set - looks to be in process of clearing but futures not quite there yet and 2 points really too close to call.


INDU / DIA / YMM / YM1
Between long term levels.
DIA above MayP.
YMM above MayP and 20MA, but below10MA. Also note slope of D50 starting to level out.
INDU sum - Above all pivots and not an any resistance areas, but a bit weaker than SPX via moving averages and D50MA starting to level out, a sign of slowing trend.


RUT / IWM / RJM / RJ1
Weekly chart between levels.
IWM high on Q2R1 near exact, and 2nd time below MayP. Again testing Q2P.
Futures charts show low on Q2S1 and high on R1, back to Q2P. Also note flat D50MA.


NYA & VTI
Both not at long term resistance levels. Both pausing at 3/1 close highs, but both above MayPs.


