Due to the way the scripts work in tradingview.com, new pivots won't show until bars open on Monday. So this week I'm going to focus on big picture quarterly and monthly charts, weekly chart with yearly levels only, and perhaps manual calculation on a few key indexes.
Sum
Quarterly charts are in amazing uptrends, all indexes well above all moving averages with impressive upward slopes. RSIs on these charts are *above* previous peaks, which I think will help limit damage on a pullback. Trends have been so strongly up, anything -5% will be seen as a great opportunity.
Monthly and weekly charts with pivots are another story. Most monthly charts show RSI and BB divergence, a classic move before a drop. And most importantly to my view:
SPY testing YR1 but still above - key level to watch
QQQ second fractional move below YR2 - anything lower is bearish, needs to have weekly close above to reduce the threat
DIA just below YR1 after 1 week above the level - anything lower is bearish, needs to have weekly close above to reduce the threat
VTI dropping YR1 after 4 bars weakly above - anyshthing lower is bearish, needs to have weekly close above to reduce the threat
3 of 5 USA mains under YR1/YR2s, and one other testing. I try to keep an open mind and acknowledge the trends, but if you consider the yearly levels in play here, RSI and BB divergences on monthly and weekly charts, it seems to be the market is about to get whacked.
But all this concern will dissipate with big gap and go on Monday, which could easily happen.
SPY Q
Massively above all MAs, RSI higher than 2014 peaks means no divergence. 7 quarters in a row - amazing run. Small wick on current weaker up candle some risk of selling as next move but overall very healthy and still a comfortable long term hold.

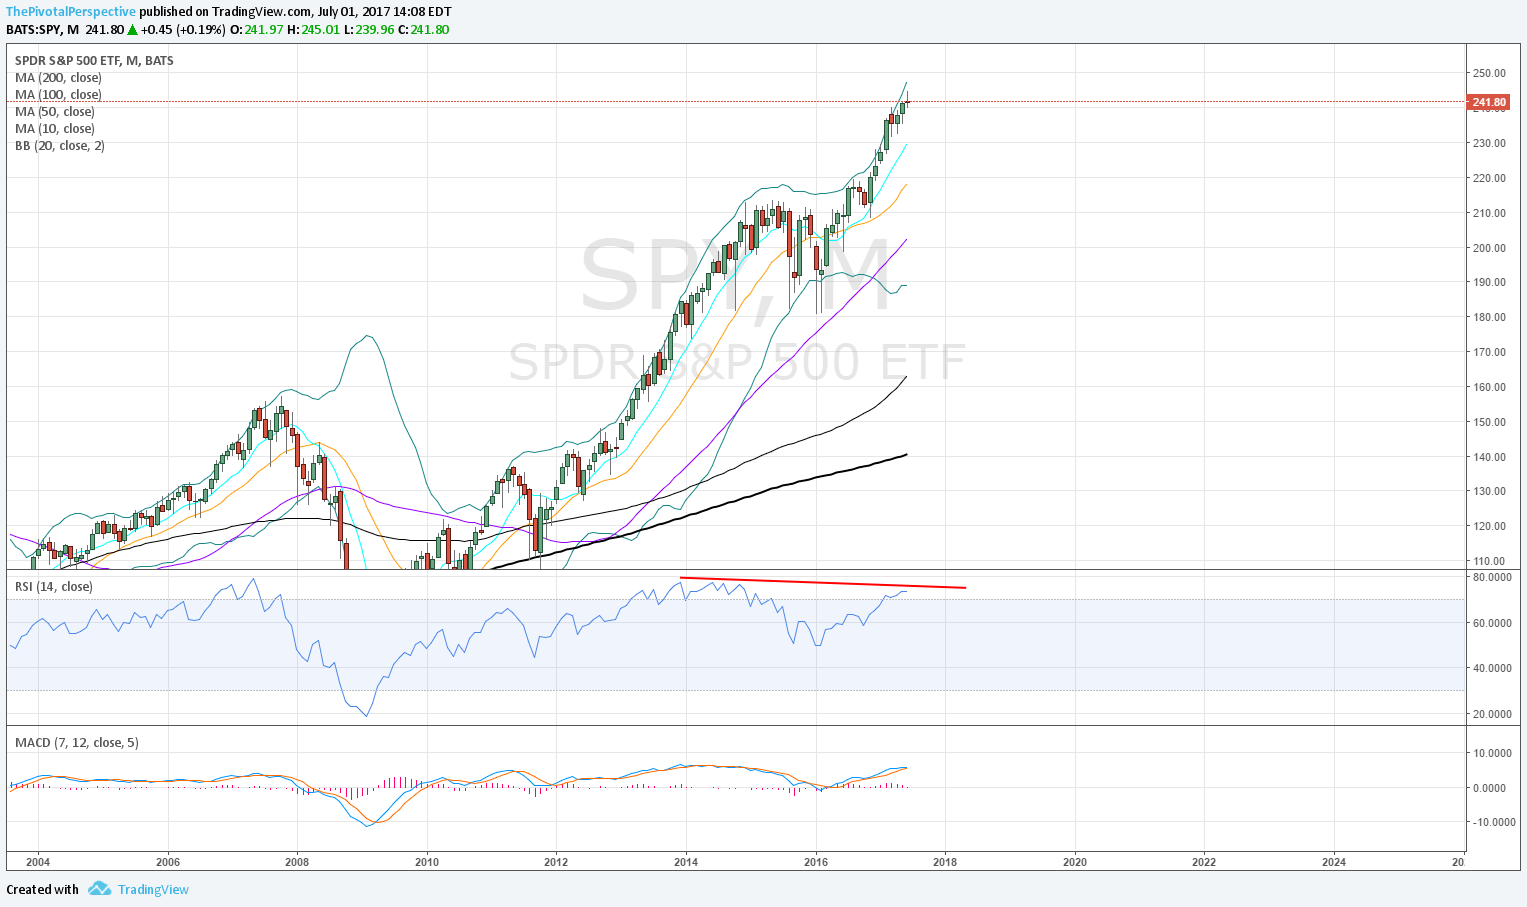
SPY M
Above all MAs since 3/2016. Slight RSI divergence, but to me looks better with RSI above the 70 level. BB (Bollinger band) divergence compared to 2/2017 and 3/2017 tops. Wick and small gain invites selling. Uptrend, but pullback due.
SPY W
Above the YR1, but so far only 1 bar up above this level and since then 4 bars of selling. Still holding as support, and key level to continue to watch. Also note RSI divergence top and starting to roll over. 50 area likely better buy zone along with some pivot level if the YR1 cracks.

QQQ Q
Falling back inside Q BB also invites selling. However RSI no divergence yet, so still comfortable as a long term hold.

QQQ M
RSI divergence. Coming back inside BB after 5 straight months outside. I 'think' upside limited to BB on any up move early in July if that happens.

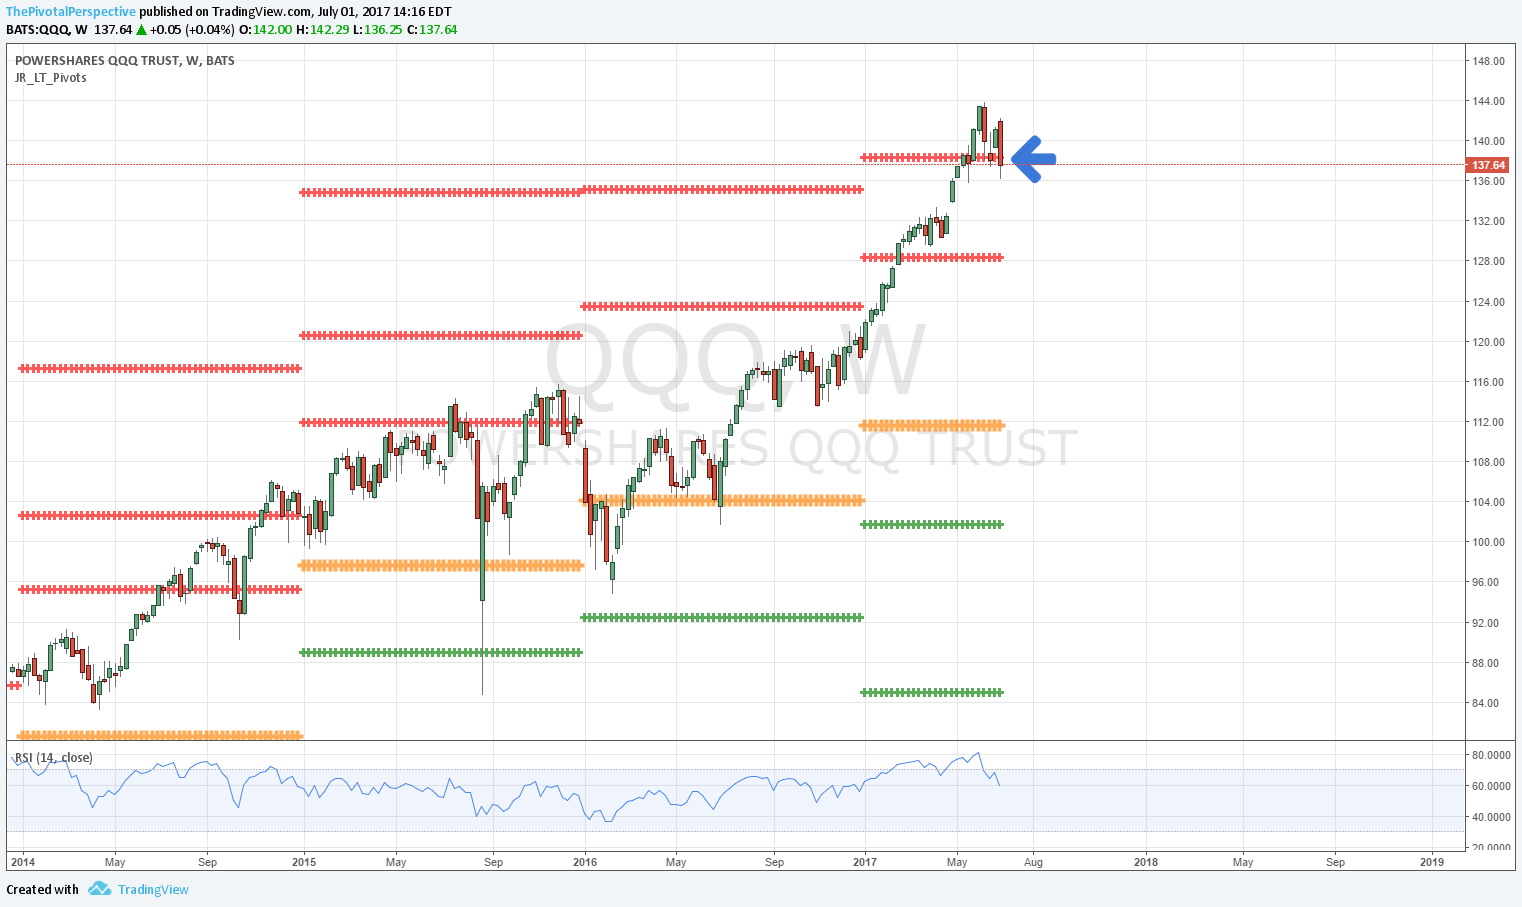
QQQ W
Long term buyers of technology in 3/2016 and, end 6/2016 and 7/2016 have had almost no worries until one week in May 2017, and 2 of the last 3 bars. YR2 second break - anything lower looks bad. Takes a weekly close back above to relieve this threat.
DIA Q
RSI strong and 2nd close outside BB - wow.

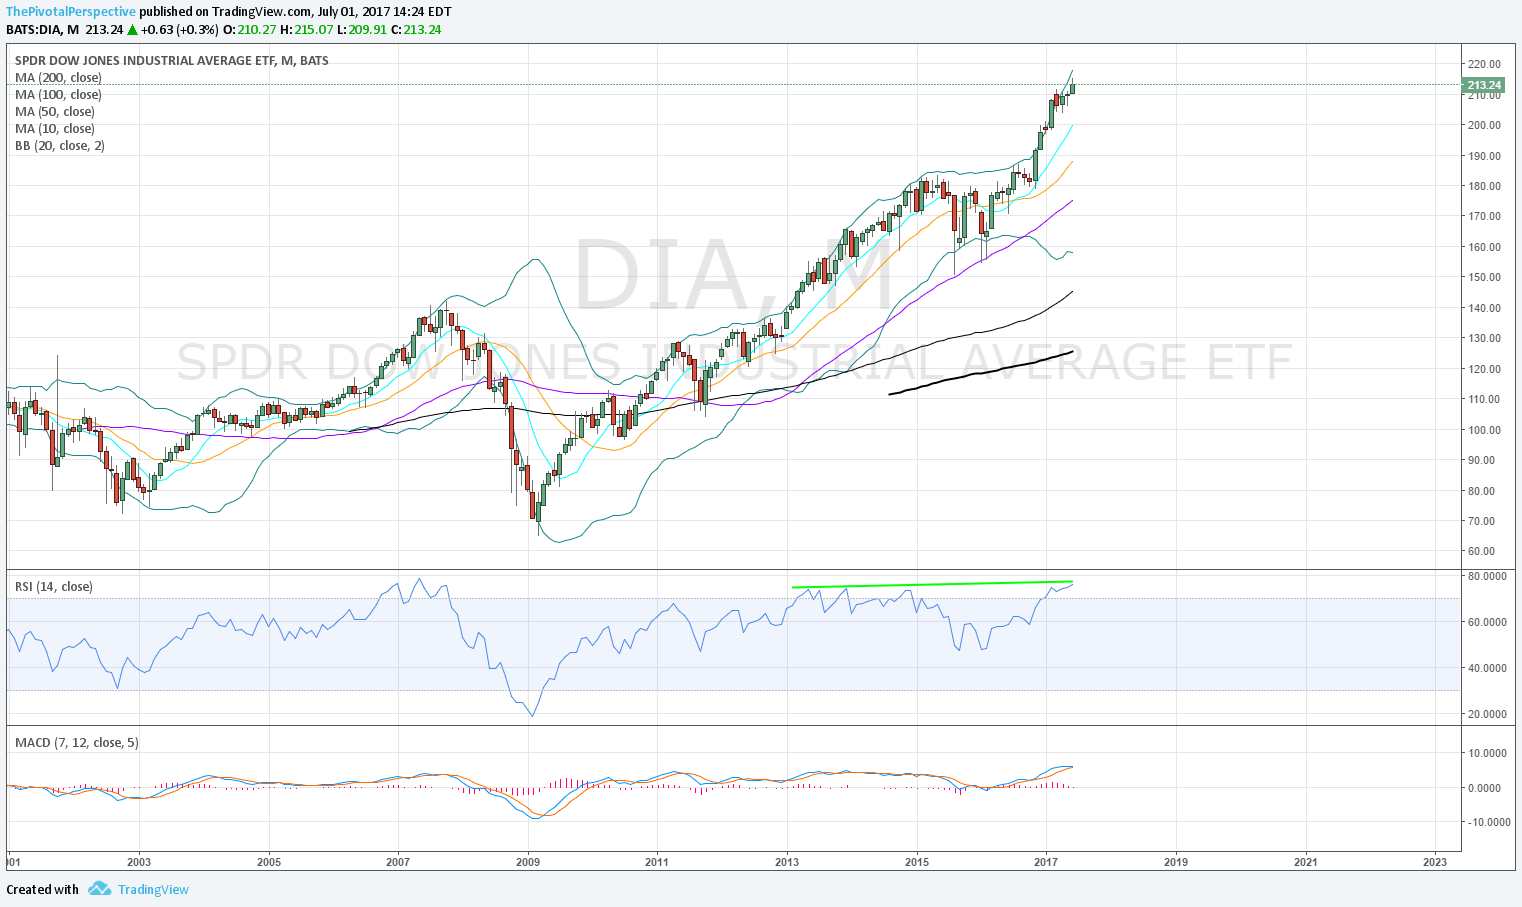
DIA M
RSI still slightly higher but classic BB divergence on the last bar compared to the highs earlier in the year. Wick invites selling.
DIA W
Screaming RSI divergence and slightly below the very important YR1. Why shouldn't this level be as important as the 6/2016 YP hold or the 1-2/2016 YS1 holds? Real chance of significant top with anything lower.

IWM Q
2 smaller up bars and some RSI divergence invites selling.

IWM M
RSI divergence and BB divergence on the last 2 up bars (highs inside BB, previous highs outside). But at least stronger up on last bar and still above all rising MAs.

IWM W
Between long term levels.

VTI Q
RSI strong and massively healthy advance in play.
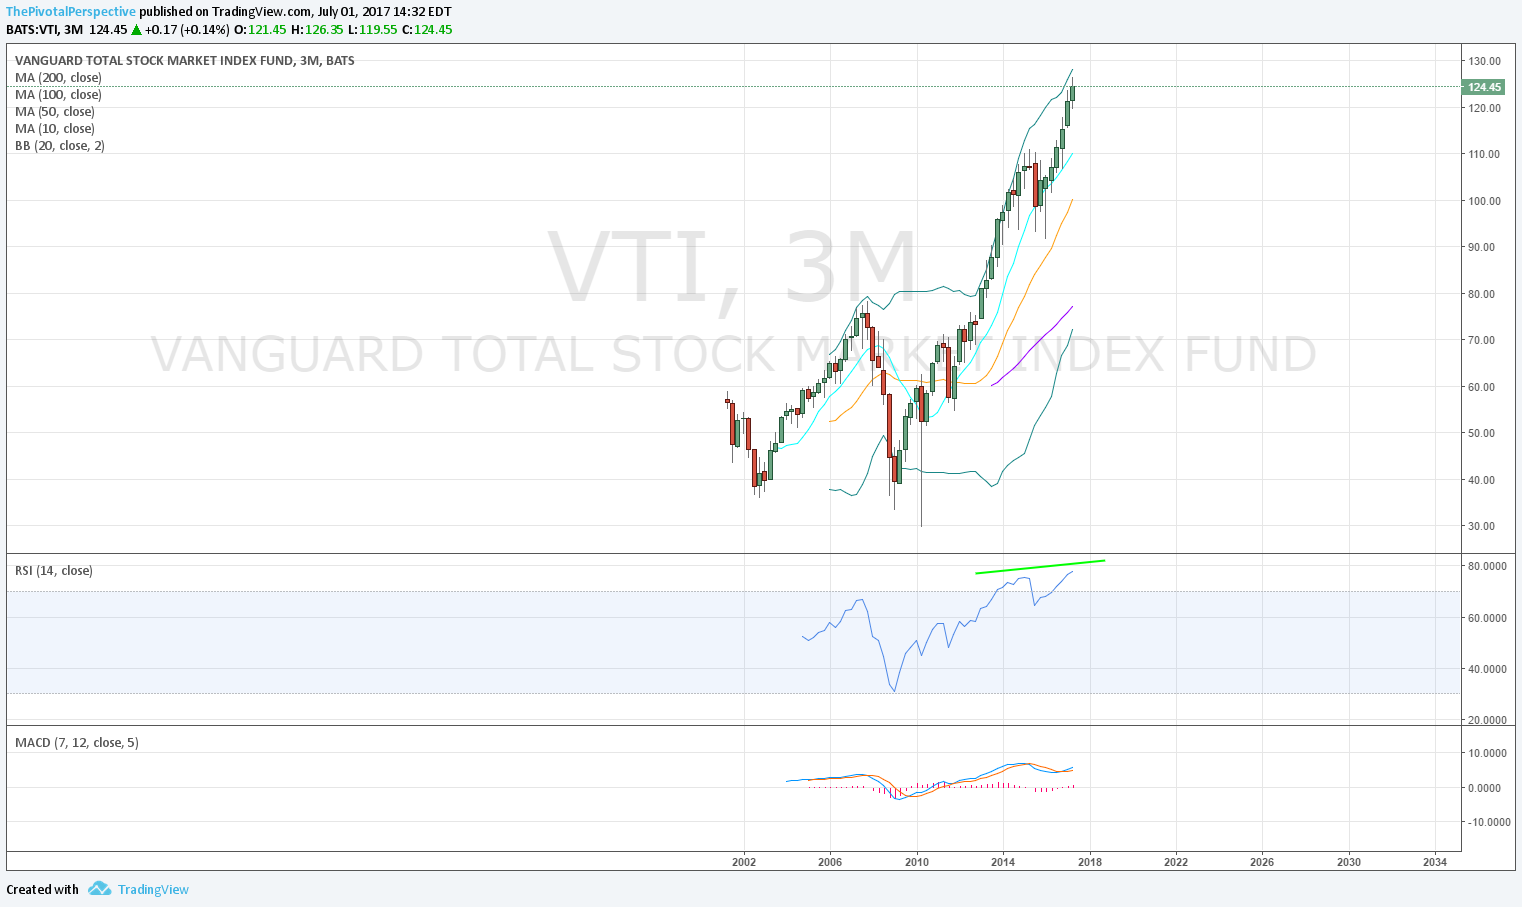
VTI M
RSI divergence and again, classic BB divergence with small up bar with a wick. The door is wide open for sellers.

VTI W
Break of YR1 after trying to clear and stay above the previous 4 bars. Last weeks to have bearish conclusion on yearly level was 8-9/2016 before the drop. RSI divergence also in play.
