Valuation and fundamentals

The 10 week moving average of 18x P/E is moving up with impressive slope (blue line). SPX price (orange) has bumped up against this valuation level a few times, but with earnings increasing the index can continue to climb without becoming truly more expensive. A healthy 3 on scale of -5 to 5.

*

Citigroup Economic Surprise Index got even worse. C'mon. I cannot believe the market is reacting somewhat to this. Well, stocks have been ignoring, but not bonds. TNX and other yields at multi-month lows on 6/14.

I would like to see the indexes on Europe, Japan, China, Emerging markets, etc, that are available on a Bloomberg but not publicly released as far as I know. 

The conclusion has to be that markets are moving more on earnings than economic releases, which makes some sense. Or global economy is doing better than USA, which is certainly possible. Either way I think i may have to downgrade the "fundamentals" portion of my scoring. To keep it simple will give the P/E double the weight of the Economic Surprise.

Valuation: 3x2 = 6
Fundamentals: -5
Total score 1 out of -15 to +15 scale. Seems like market should not have much upside. 

Valuation and fundamentals

The 10 week average of earnings estimates continues to climb, jumping from 135.40 to 135.89 according to numbers implied by Thomson Reuters. This lifts the 10 week average of the 18x earnings to 2446. SPX has been pushing 18x earnings for months now, but with earnings estimates increasing price as been able to increase without getting truly more expensive. Fully valued with upwards slope is still a decent positive for the market. 18x valuation in blue and SPX in orange below. Still considering this a 3 on scale of -5 to +5.

*

But Citigroup Economic Surprise still looks terrible. Calling this -3.

Combined score 0. Rallies should face headwinds until economic data begins to improve.

Valuation and fundamentals

Abbreviated posting this week.

10 period MA of 18x forward earnings jumped to 2437, with the first weekly close above. While the market is still basically at 18x, it is bullish with this kind of slope. 

But Citigroup Economic Surprise Index looks terrible. Most stocks may be ignoring this right now, but bonds aren't. 

3 2 snip.PNG

Valuation +3, Fundamentals -3, total score 0. This would imply a trading top is immanent. 

Valuation and fundamentals

Earnings estimates picked up nicely last week, turning slope from flat-ish trend since March to decently positive.

The 10 period moving average of forward earnings estimates.

This level multiplied times 18 gives us implied 18x P/E, smoothed by a 10 period moving average. 

And here is that same level with SPX price in orange. 

So this is the third time near this valuation, though the first two tries were at 2400 and this time a bit above. Rising slope means the market can gain without getting truly more expensive. I still think this level is worth watching for professional reactions. Still, due to rising slope, on a scale of -5 to 5 I am upgrading this to 2.

*

But economic data is a real drag here. Scoring this -3 since below last low. 

Combined score still negative. This increases the chance of a fade back into recent range for SPX.

Valuation and fundamentals

The 10 period moving average of S&P forward earnings estimates according to Thomson Reuters continues to climb. 

The implied 18x P/E based on this estimate is up to 2414.

So far, 18x forward earnings (or at least the smooth 10 period moving average of it) has stopped the index twice based on weekly close. 

As long suspected, we have seen some professional selling at this valuation multiple. However, the level continues to climb and this allows price to follow without paying higher valuations. Rough estimate on score of -5 to 5 is 1.

*

Citigroup Economic Surprise Index as reported by Yardeni is just not helping. 

Score this -3, lower than the last low. Combined total = -2. Based on this indexes should not race back to highs.

Valuation and fundamentals

Thomson Reuters data showing 12 month forward P/E of 17.57. This makes the 10 period moving average of implied earnings 133.83, up decently from last week.

Multiply this by 18 and you have valuation level resistance for SPX, which has now climbed above 2400.

But this is still looking like resistance for SPX.

Increasing earnings is a positive, but still there appears to be professional selling at this multiple. I will score this a 1 based on rising slope. 

*

Citigroup Economic Surprise Index is just not helping things here. 

Score this -2.

Combined total = -1 on a scale of -10 to +10. According to my rough estimates of valuation and fundamentals, markets should be topping out with very slim chance of SPX blasting through YR1. 

Valuation and fundamentals

Thomson Reuters reporting forward P/E of 17.75, which puts implied earnings at 135 area and the more important smoothing 10 period moving average at 133.55, continuing to climb. 

So here is 18x implied valuation, turning up after a flat period. 

And here is the same 18x valuation level with SPX price in orange. 

I still think 18x-19x will be significant resistance because with the antics of current administration smart money is not going to wait for 20x to begin serious selling. But if earnings increase, then that takes urgency off as price can climb higher with consistent valuations. Let's give this a 2 this week due to the rise in the average 18x level from 2400 to 2403, itself up from 2398 the previous week. This is coming after about 6 weeks of stall in the 10MA from 2695-2398.

*

However, Citigroup Economic Surprise Index looks terrible. Giving this a -2.

Combined score 0. These charts argue for a "sell in May" move but that doesn't mean it starts on 5/1. 

Valuation and fundamentals

Thomson Reuters reporting that 12 month forward P/E of SPX dropped as price rallied - that means earnings up. But I've been using a 10 period MA to smooth data. Here are results from 2016 Q4 to current.

Multiplying this earnings number by 18 gives the implied valuation level.

And here is SPX added in orange. 

So the index is making another test of 18x area earnings. This site has maintained for months that I expect a major top in the 18x-19x area. If earnings continue to climb, then price can go higher while maintaining this valuation. It would be negative for the earnings to level off and start dropping. Resuming positive counts towards making this a very slight positive guesstimate, +1.

*

Citigroup Economic Surprise is not helping! Back to the zero line, so let's give that a 0.

Combined rough estimate score on scale of -5 to +5 is a very middling .5. This caps upside and increases the chance of a sell in May event. 

Valuation and fundamentals

Every week, I check the 12 month forward P/E of SPX as reported by Thomson Reuters. Dividing by price gives the implied earnings estimate. Multiplying by P/E ratios gives theoretical valuation support and resistance levels.

The 10 period moving average of earnings estimates continues to flatten after climbing rapidly last year. 

Multiplying this by 18x gives theoretically SPX valuation resistance - same slope as above.

And here's how this idea played out with 18 P/E (10 period MA of that to be precise) in blue and SPX price in orange. Note: not a hindsight exercise. I pointed to 18x target since summer 2016, and as the market ran into this level expected some professional selling. 

s3.PNG

*

Citigroup Economic Surprise Index took a sharp dive back to the neutral line. There is no positive spin on this chart. 

Valuation score - 0
Fundamentals - 0

I does not appear that the market "should" move anywhere - EU politics and USA taxes seem to be the immediate drivers.

Valuation and fundamentals

Thomson Reuters reported forward P/E at 17.54, making the 10 MA of the implied earnings estimate at 132.78, about even from last week, and 10 MA of 18x earnings at 2398. Here are the charts. 

And what we are especially interested in, how SPX price has reacted to this valuation level. Keep in mind that I pointed to 18x forward earnings for months and once we got there expected "professional selling" and this is exactly what has happened. 

The 10MA of 17x is now about 2265 so if lower that might be an additional reason for support there. 

Market is reacting from being fully valued. Estimates are leveling off. It hasn't dropped enough to attract value buyers. My interpretation of this is 0.

*

Citigroup Economic Surprise Index dropped from higher levels. Still I give this a 3.

Combined average 1.5. As heavy as market feels it is only normal after a 15% SPX rally off November lows. 

Valuation and fundamentals

Earnings estimates according to Thomson Reuters are starting to level out. 

Here is the 10 period moving average of the raw earnings estimate itself.

Multiply this by 18 and you get implied 18x forward earnings for SPX. Same slope.

And here is how SPX has reacted to this valuation level.

The level was tagged on 3/1 highs, but did not exceed on weekly close. 

Basically, 18x forward earnings as stopped the rally; and of more concern, earnings estimates are starting to flatline. This increases the chance of a range or drop going forward. Because the 10MA level of 18x forward earnings was lower than last week, I'm giving valuation score a -1.

*

Citigroup Economic Surprise Index dropping from a high level. Still decent, but not the same as going up. This gets a 3.

Combined total on scale of -5 to 5 = 1. Not impressive but still positive. 

Valuation and fundamentals

The Thomson Reuters reporting of SPX 12 month forward P/E got up to 17.99 on 3/19, held at 17.93 when SPX dropped the week of 3/24, and then went down to 17.68 the week SPX rallied. There is something going on that I don't get and it may be as simple as a 1 week lag. Anyway, this is why I've switched to 10 period moving averages (for several months now).

The 10MA of earnings itself is still in uptrend, but slowing increase and maybe leveling off. 

The 10MA of 18x forward earnings - which has been the low end of my target range for months, is similar, leveling off after sharp ascent. 

Here's that same 18x P/E MA and SPX price in orange. SPX tagged the area for a few trading days on the 3/1 highs but not on weekly close. 

Last week I said valuation concerns had turned negative due to the drop in the 18x P/E, but this week returned to gains so let's say 0. Market is fully valued but not a negative if going up.

*

Citigroup Economic Surprise Index looks like it dropped a bit but still from a very healthy area. That still is a 4. 

Combined effect is mild positive and the simple math of my very rough estimate is a 2 on scale of -5 to +5. Valuation concerns should limited upside somewhat, but strong fundamentals also limit declines.

I think the move that most institutions agree upon is to global. Yardeni has put out a list of forward P/Es country by country. India is commanding nearly the same multiple as SPX, but that is because of demographics and growth. Nearly everything else is cheaper than the USA. This move of global out-performance is already in process especially this year, and I think likely to be a theme for more than 1 quarter.


Valuation and fundamentals

According to Thomson Reuters, SPX P/E is still up there at 17.93. Considering the price drop, this is a bearish development which actually dropped the 10 period MAs of the levels. For example, the 18x 10MA level that I have been so keenly watching was 2398 last week and 2395 this week. Here's the chart. 

And here's the price movement. 

It is hard to understand why earnings estimates dropped so sharply last week; there may be a lag in real data and this could be some move implied by price. But for now, I consider the decline in the 10MAs of earnings estimates and implied P/E levels to be a bearish development - fully valued, and implied price level starting to slope (ie trend) negative, and price reacting from level as resistance. Score -1 (on scale of -5 to +5).

*

Citigroup Economic Surprise Index still looks quite strong. 3. 

Combined total 2, average score 1. Power up move likely over, but still might be positive enough to prevent a larger drop. 

Valuation and fundamentals

I have been tracking valuation over time since seeing a CNBC interview with David Tepper 4 years ago. CNBC was grilling him because SPX hadn't reached his price target. He was emphatic - "I didn't say such and such a number, I said 18x forward earnings - and it reached that level. At the time 18x forward earnings was the price target you cited." Or words to that effect. 

So this endeavor started as a project for the small fund where I was the primary strategy consultant, just to keep up with Wall Street thinking. This is also how they do their year end targets - calculate earnings estimates, assign multiple, voila, target 2400 or whatever. It doesn't mean they will be right - in fact consensus probably more likely to be wrong - but I liked to know what they were thinking as a group. 

As it turned out 18x forward earnings played a major role in the SPX 2015 top and distribution and subsequent drop. Oh yeah, pivots were awesome too. Check the home page for that (NDX top on level). 

When the fund closed down and I started this site to show some chops, I had to reverse engineer this project since the Bloomberg was no longer available. I began with Wall St Journal data, but then saw Ed Yardeni cite Thomson Reuters so made the change. Then I got frustrated with week to week chop in the cited P/E, and that issue was solved with a 10 period moving average. 

Over the past year I have consistently said that I expect to see at least 18x forward earnings for a major top. For a while I was saying 18x-20x would be appropriate for a euphoria high. At some point after the Trump election this was reduced to 18x-19x. This target area was tagged on 3/1. 

The Thomson site listed 17.99 as of 3/10 week data collection, and this week dropped down to 17.76. That is the raw data, not the 10MA. At the price high of 2400.98, the 10MA of 18x level was 2388. So the level I have been looking all this time was tagged. The 10MA value has continued to climb a bit since then, with a current value of 2399. Price highs this week were 2390 and 2388 - so not quite. Also we haven't had a weekly close above 18x 10MA value. But the market has clearly slowed down at this area. Oh yeah, pivots in play too. 

Here is a more graphic version put out by Ed Yardeni of what am I doing with this project. According to his data, this is the first time we are seeing 18x forward earnings or near it in quite some time. But I know what was on the Bloomberg when using. I don't know the reason for the discrepancy but maybe some CFA can explain. 

I'm also interested in the rate of change and not just the level. Traders just call this slope. Here is my non flashy chart of what I am getting at. If I put the price on this, the slope is harder to see so this is the pure price of the SPX implied by the 10MA of 18x forward earnings. 

As long as this continues to climb, then price can climb too while maintaining this rather full valuation. But when that starts to look more sideways, caution warranted, and if sloping down, watch out. 

Here's a chart with SPX added. The reason it doesn't look like the level has tagged is because the market has not had a weekly close on the level. 3/1 high tagged the area and retreated, and recent highs were a shade under as well. 

Sum - I consider the market fully valued here. We may see a professional selling reaction from 18x forward earnings and so far it has paused the rally when seemingly nothing else could. But as long as the slope is increasing - ie earnings are going up - then I cannot call it a negative.

*

Citigroup Economic Surprise Index was another item available on the Bloomberg - very handy with several different versions (Japan, EU, China, EEM, etc). Yardeni has somehow been able to make the main USA version available and I have been linking to it each week.

This is still going up and a definite plus. 

So if we had some simple scale on 0 to +/-5 were 0 was neutral, 5 the best, -5 the worst, let's say valuation is about a 1. This will be downgraded to zero if the slope is sideways. Fundamentals are better and reaching a fairly high zone in the Surprise chart, let's say 4. 

Combined value 2.5, moderate positive. These numbers are arbitrary. Just giving the math types some sense of what I am thinking about these two combined. 

Valuation and fundamentals

10 period moving average of 18x forward earnings since 2/3/2017 has been:

2/3  2374, with SPX at 2297
2/10 2384, with SPX at 2316
2/17 2386, with SPX at 2351
2/24 2388, with SPX at 2367
3/3 2391, with SPX at 2383

High of the week was SPX 2400. Basically the valuation target zone I have been mentioning since last August shifting over to Thomson numbers from WSJ data has been tagged. But valuation is a funny thing. Right now my opinion is that forward earnings high in this bull market will be 18x-19x and not higher. But willing to say that this could be wrong, and it is the psychology of valuation that matters to the market. More on an interesting post here by Barry Ritholz. And while I start each weekend series with a quick look at valuation and fundamentals, it is price action that carries far more weight in my strategies. 

Due to 18x tag, I am downgrading valuation concerns to neutral. For the last year I've been saying mild positive because I thought there were room to go higher (but not too much higher). As long as numbers keep increasing the SPX can go higher while maintaining 18x. The pace of increases to the 18x level seems to be slowing so I may downgrade if the numbers start dropping. 

*

Citigroup Economic Surprise seems to be slowing but still in decently positive territory. 

The two combine for mild positive. 

SPX nearing longstanding valuation target

8/6/2016, SPX 2182. "I think we can see 18x-20x forward earnings in this latter stage, but not has high as the late 1990s when new technology was so completely changing everything."

8/20/2016, SPX 2183: "Both measure show P/E getting into high area of 2015, which itself was the bull market high. If we are in euphoria stage of the bull market I think we can see 18-20x on the Thomson numbers which currently means 2300-2550, but the extremes of the late 1990s are just not going to happen in this decade."

12/3/2016, SPX 2191: "Ultimately I'd like to see euphoria highs near 18x forward earnings in 2017-18."

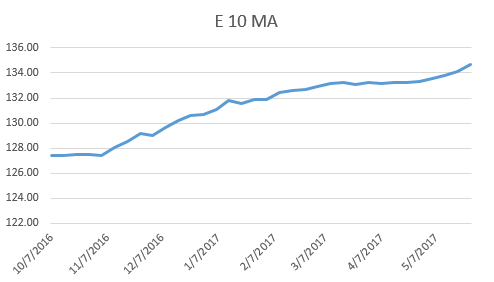
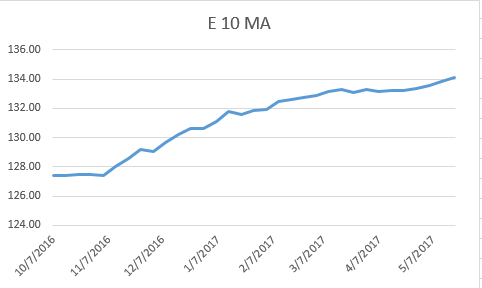
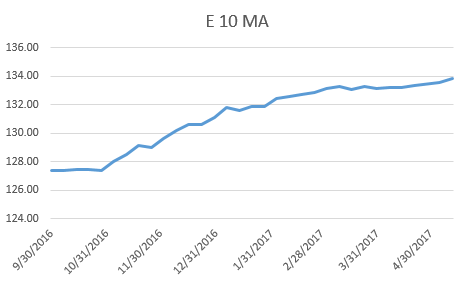
12/10/2016: "I don't understand the curve fitting of the model but Thomson Reuters P/E went *lower* last week. I think the solution here is a moving average so I am just going with a 10 period MA. This will cut out this noise and have smoother valuation areas to watch as support or resistance."

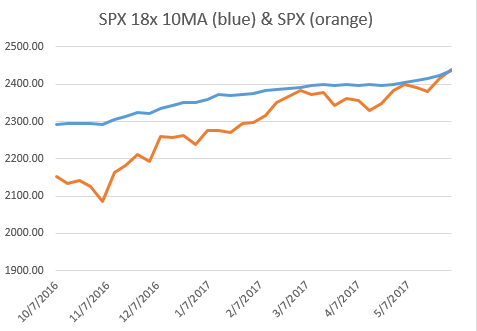
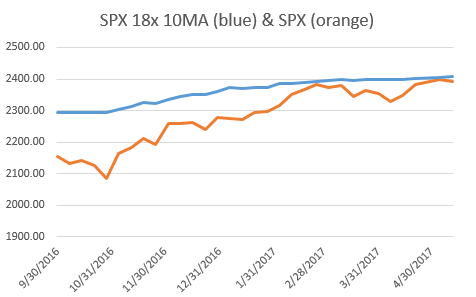
12/17/2016, SPX 2258: "There you have it, a continually updating target range for SPX at 18x - 20x forward earnings. I don't think the market is going higher than that. Based on 12/16 close, this means SPX about 4-15% upside from here, although it is possible that the 10MA will continue to climb and this shift the target range higher as well. 

12/24/2016, SPX 2263: "This site has consistently maintained that I expect to see 18x-20x forward earnings for a real bull market euphoria high. Currently, 18x 10MA is 2350 and 20x 10MA is 2612. These may continue to increase, but for now this is my target range which is an admittedly wide +3.9% to +15.4% upside from current levels on SPX."

1/7/2017, SPX 2276: "The 10MA of 18x-20x valuation target are up to 2360-2622, or 3.6% to 15.2% upside from current price levels. These will continue to change as earnings and the 10 week moving average also change.

1/14/2017, SPX 2274: "I'm beginning to have doubts about anything higher than 19x. Smart money will gladly leave the remaining 5% on the table to protect themselves against a -20% drop. If I change the target range to 19x, then this means current 2514, 10MA 2503, % upside to 10MA = 10%."

2/4/2017, SPX 2297: "Using 10MAs to smooth the data: 18x target 2374, 19x target 2506, Or 3.3% - 9.1% upside."

2/18/2017, SPX 2351: "Every week I have pointed out target of 18x forward earnings; the current value is 2440 and 10MA is 2386. I think 19x is a cap, because I don't think smart $ will wait for 20x forward earnings to sell. This is currently 2576 and 10MA is 2518. Thus, 10MA target range of 18x-19x forward earnings of 2386 to 2518 is 1.5% - 7.1% from current SPX levels." 

Valuation and fundamentals

Information from Thomson Reuters over the last few weeks is exactly why I have switched over to a smoothed 10 moving average emphasis.

Raw numbers SPX earnings implied by P/E and price
2/3/17: 132.04
2/10/17: 134.81
2/17/17: 135.59
2/24/17: 133.22

Earnings cut that much over the last week?

Meanwhile the 10MA smoothed data is:

2/3/17: 131.90
2/10/17: 132.48
2/17/17: 132.58
2/24/17: 132.72

Market is acting like the latter, not the former. 

So, 18x 10MA is 2389, and 19x is 2521. This is .9% to 6.5% from current levels. Valuations may soon turn into more of a headwind depending on what you think of 18x forward earnings. 

*

Citigroup Economic Surprise Index still looks quite healthy. 


Valuation and fundamentals

The 10 period moving average of SPX forward 12 months earnings as implied by Thomson Reuters is a bit higher than last week, from 132.48 to 132.58. So this makes the 10MA of the P/E 17.23, which is just a bit under the current value of 17.34. 

Every week I have pointed out target of 18x forward earnings; the current value is 2440 and 10MA is 2386. I think 19x is a cap, because I don't think smart $ will wait for 20x forward earnings to sell. This is currently 2576 and 10MA is 2518.

Thus, 10MA target range of 18x-19x forward earnings of 2386 to 2518 is 1.5% - 7.1% from current SPX levels. 

Last week I mentioned that 17.5x might have been part of resistance market was facing, but didn't pose any problems. 

*

Citigroup Economic Surprise Index as reporting by Yardeni looks great, looking to be the highest since early 2014. 

These are both a moderate positive for markets. 

Valuation and fundamentals

The 10 week moving average of SPX forward earnings estimate according to Thomson Reuters continues to climb, reaching into the 132s for the first time since I adopted this method to smooth out of some of the noise. Thus the 10MA of P/E is stable despite the price jump in the index, which is bullish. 

I have been pointing to 18x as a nice sounding area for bull market euphoria high since starting this site, and observing how this level has moved over time. The 10MA of 18x is now 2384 with 19x at 2517. This target zone represents about 3.0% - 8.7% upside from Friday's close of 2316.

In the meantime I will watch 17.5x forward earnings to see if there is any reaction. The 10MA of 17.5 forward earnings now 2318.

*

Citigroup Economic Surprise Index staying in positive territory for the longest span since 2014. Bullish.

Sum: while watching 17.5 forward earnings at 2318, I am still pulling for 18x-19x as a better bull market euphoria high. These levels are currently 2384-2517 or 3.0% - 8.7% higher than now. Fundamentals continue to support risk assets. 

Valuation and fundamentals

Latest reading of SPX forward P/E from Thomson Reuters ticked up to 17.40, bringing 10MA to 17.16 and 10MA of earnings estimates to 131.90. Using 10MAs to smooth the data:

18x target 2374
19x target 2506

Or 3.3% - 9.1% upside. 

*

Citigroup Economic Surprise Index maintaining in positive territory - looks to be the longest span of time since 2014. 

Both of these moderate positive for markets. I suppose I should watch 17.5 area since it is nearby and could be thought of as a round number target. Real value 2310 as of recent data and 10MA value 2308.