Global indexes

Mostly emerging markets, a few developed.
ACWI SHComp FXI EEM KWEB INDA EWZ RSX EFA EWG EWJ

Leaders: RSX EWZ EWJ
Laggers: INDA

All of these have YR1 rejections or failures, and most below FebPs. 

ACWI
M: Falling back inside BB.
W: YR1 rejection.
D: FebP break.

3 50 ACWI M.png
3 52 ACWI D.png

Shanghai Composite
M: Different pattern, but also trouble at upper monthly BB.
W: YR1 rejection
D: Rallied to close a bit above FebP. 

3 61 SCH M.png

FXI
M: Falling back under 2015 puts China leadership more in question.
W: YR1 slight break (not rejection in this case)
D:  YR1 and FebP slight breaks.

3 64 FXI M.png
8 DIA D.png

EEM
M: Oops
W: YR1 rejection
D: FebP break. 
 

3 70 EEM M.png

KWEB
W: YR1 rejection

3 74 KWEB.png

INDA
W: 1HR1 fail.
D: Almost at Q1P already - weak.

3 75 INDA W.png

EWZ
W: YR1 fakeout.
D: Slight break of FebP. A reclaim of YR1 would look like a good buy.

3 78 EWZ.png

RSX
W: YR1 fakeout.
D: Testing FebP but notably still above.

3 80 RSX D.png

EFA
YR1 rejection, FebP break.

EWG
YR1 rejection, FebP break.

EWJ
YR1 rejection, FebP slight break - interesting buy on any bounce.

Global indexes

I don't post about these every week but watch and often have positions.

From the perspective of tax cut this is not that hard to understand but suddenly nearly all of the 8 I track are below DecPs. In fact, all but broad index ACWI. EWZ the weakest of the lot, under Q4P for the 3rd time. 

ACWI (like NYA broad index)

2 50 ACWI D.png

SHComp
Holding Q4P, below DecP.

2 51 SHComp.png

FXI
Below DecP.

2 52 FXI D.png

EEM
Below DecP.

2 53 EEM D.png

KWEB
Below DecP, nearing Q4P.

INDA
Below DecP.

2 55 INDA.png

RSX
Below DecP, holding Q4P so far.

EWZ
Break under OctP at slanted arrow; then NovP resistance on bounce; below Q4P 2n3rd break, slightly below DecP as well. 

2 57 EWZ D.png

Global indexes and $DXY

Sum
DXY perking up has correlated with some stall in many global indexes, which have produced huge gains and been favorites for most of the year at TPP. Thus far ACWI, FXI, KWEB, EEM and INDA not too bothered by DXY move and still seem to me like they could go higher. EWZ the notable laggard, below Q4P. 

DXY
2nd time above Q4P from 10/20 has been the definitive move so far. YS1 (thick green) first resistance but now starting to clear. Should this continue, perhaps some pressure on global indexes. 

ACWI
No problems here, above Q4R1 and could see 2HR2. 

FXI
Favorite for months, above YR2 but some trouble at Q4R1. 

SHComp
Below NovP but doesn't look too bad with Friday's hammer. 

KWEB
Some shakeout after massive run but just held YR3 as support. 

4 25 KWEB.png

EEM
Q4R1 difficulties but above NovP and 2nd time clearing 2HR2. Still looks fine. 

INDA
Looking good!

4 27 INDA D.png

EWZ
One of the few stock indexes below Q4P with Friday's break. 2nd rejection from YR1 10/23 has been definitive. 

RSX
Also somewhat weaker, below NovP.

Global indexes

Time limits me to tracking these 8 - it would be more thorough to do base index plus ETF & futures for each.

It is pretty striking how good most of them look. While a few are at Q4R1s, several have cleared YR2s, YR1s etc and KWEB has even cleared YR3.

EEM lifting above 2014 highs and looks ready to jet; INDA had a bit of trouble on YR2 but came right back and also is popping. 

ACWI (often mirrors NYA)
W: Powering up.
W: Above YR2 from mid Sept.
D: Almost at Q4R1.
Sum: Looks like higher into year end; near term reaction from Q4R1 possible.

14 70 ACWI W.png
14 72 ACWI D.png

SHComp
W: A bear might be looking for 3000-3200 but that's not happening now. Breakout above earlier 2016-17 highs. 
W: Between long term pivot levels. 
D: Above all pivots, can't complain. Notice that YP test fought back in a big way in May and steadily up from there. 

14 73 SHC W.png

FXI
W: Powering up.
W: Above YR2
D: At Q4R1 2nd time. 

KWEB
W: After 65%+ YTD this is not the place to position but still powering up above 10MA with no glaring RSI divergence. 
W: Above YR3!
D: At OctR1 but this can be held above YR3 with max low Q4P.

14 80 KWEB W.png
14 82 KWEB D.png

EEM
W: Breakout above 2014H!
W: Above YR2, above 2HR2.
D: At Q4R1.

INDA
W: Raced back to highs after deeper drop.
W: Just a little higher would look great, but already a bit above 2HR1.
D: Back above YR2, testing 2HR2 & Q4R1 area. Recovery of Q4P and OctP was good buy chance if not in on Q3P earlier. 

EWZ
W: Also bounced back nicely from rising 10MA.
W: Clearing YR1.
D: YR1 a few chances to turn into resistance but didn't. 

14 88 EWZ W.png

RSX
W: Also lifting above prior highs.
W: Rally from YP hold is now about +20%
D: Steady up, above all pivots from 7/25 on.

14 91 RSX W.png
14 92 RSX W.png

World indexes

Not as thorough as USA main indexes or safe havens, but thought interesting to check these. If the market is making a real turn, then it won't be just USA indexes.

A few of these look toppy. 

ACWI
Still healthy above all pivots, but if higher then YR2 is serious resistance. 

9 80 ACWI D.png

FXI
2HR2 and Q3R2 rejections - counter-trend short candidate. Longs can hold above SepP.

9 81 FXI D.png

SHComp
Pivots OK. Monthly chart near upper BB for the first time in years. 

9 82 SHComp D.png

EEM D
Only 2 days below its AugP then blast to new highs. Between levels - hold above YR2 and SepP combo. 

KWEB
Phenomenal run - re-entry above YR2 7/12 would have done great. 

9 84 KWEB D.png

INDA D
2HR2 rejection, testing YR2. Longs can hold above SepP. 

RSX D
Above 2HR for now. Below that would look more toppy. 

EWZ D
YR1 resistance with extremely high RSI. Countertrend short candidate.

9 87 EWZ D.png

Global indexes

Some long term levels to consider. 

Yes I like the China, India and EEM trade and TPP rotated into this in March with a substantial percentage of portfolio since then, often 40%. This has benefitted from Trump shenanigans and institutional recognition that EEMs should have far higher market cap compared to global GDP and GDP growth. But if markets were to have a pause, it is at places like this.

That said, all these weekly charts have RSI strength with higher highs than May. This increases the chance of mild drop and/or eventual comeback. 

EEM W
YR2 area and 2HR1 testing, pullback likely. 

2 1 EEM W.png

INDA W
So far soaring above, bullish. Easier to hold above the YR2 as support. 

Hang Seng Index W
Bang on YR2 here. 

NIFTY W
YR2 and 2HR1 tag - so far not above.

SENSEX
Same move - YR2 and 2HR1 tag. 

MSCI Emerging Market Index Futures Cont Contract
YR2 and 2HR1 combo too.

Global indexes

CNBC tends to go on about Dow new highs, but to me the real story here is global stocks, and most especially sizzling China and India. These have been aided by the plunging $USD and Yellen's dove rate hike talk.

I try to keep an eye on these as they are great trading vehicles, but only post occasionally due to time constraints. Still, on this site I've frequently mentioned: ACWI, FXI, EEM, SHComp, KWEB (recent addition), INDA, RSX and EWZ. Let's take a look. 

A more thorough approach would consider the base indexes, as most of these except SHComp are going to have the $USD involved. $DXY has been dropping like a rock and approaching YS1 at 94.86. If this holds then the steam may come out of global indexes, but currency trends seem to persist more than stocks and larger timeframes look terrible so I'm not too worried about DXY strength taking away recent gains from INDA and EEM. 

Everything except SHComp rallied big, and even RSX and EWZ recently back above all pivots. That said RSX and EWZ weekly charts are not in uptrends like the others (RSX high 1/2017, EWZ double top 2/2017 and 5/2017, still well under those highs) so could be considered interesting hedging trades against EEM and INDA longs. RSX and EWZ also impacted by oil which will be something to watch if using those as shorts. 

Bottom line here is that FXI, EEM, KWEB and INDA just had *massive* buying to quickly propel them to convincing new highs. This kind power move outside weekly and daily Bollinger bands doesn't tend to immediately reverse, even if daily RSIs are apporaching overbought. 

PS - Did I mention? INDA position 7/5, EEM 7/10 for 40% of portfolio. 

ACWI
Double top but otherwise all clear for higher levels.

15 30 ACWI D.png

FXI
W: Wow - blast off. This is not the kind of move to immediately reverse.
D: Already at 2HR1!

15 31 FXI D.png

EEM
W: Another power move up. Should test 2015 highs.
D: Going for YR2, 2HR1 and Q3R2 cluster.

15 33 EEM W.png

SHComp
OK but still in range. Less zippy.
Daily chart YP hold after 2 minor breaks was definitive.

15 35 SHComp.png
15 36 SHC D.png

KWEB
W: Impressive.
D: Tougher reentry setup banging against YR2.

INDA
W: Going up!
D: Already at YR2!

RSX
This had a huge lift as well. 
YP smart money buyers doing very well, and recently back above all pivots. 

15 41 RSX W.png

EWZ
Also back above W200 and other moving averages, but you cannot really call this an uptrend yet. About sideways for a year. 
Daily chart above all pivots - made it to JulR1.

15 43 EWZ W.png

Global indexes

I tend to ignore Europe just because most of the time it is correlated, and then you have to factor in currency. But I like tracking other stocks because of the potential for larger percentage moves. Several of these have had huge moves both up and down in the last few years. 

Sum
ACWI: looks fine
FXI: At YR1, possible hedge against EEM based on this level. Also at multi-year Fib.
EEM: Better than FXI, also at key Fib.
KWEB: Selling at YR2 and monthly chart vulernable to more drop. Avoid for now.
SHComp: Charts look fin.
INDA: Considering on long side again.
RSX & EWZ: Both in congestion zones on long term charts, but still above YPs. Likely better choices on long side.
 

ACWI (benchmark)
Q: Top of BB may have a reaction lower, but still looks like strong trend and lots of potential for up.
M: Small red bar, buyers may jump right back in. Weak selling with RSI near 70.
W: Between yearly levels.
ACWI sum: Global index idea still looks good per this benchmark.

2 1 ACWI Q.png
2 2 ACWI M.png

FXI
Q: Above flat-ish MAs, weaker lower high. Could go either way.
M: Not much edge on direction here but 50% of 2015 drop to 2016 low is it so far.
W: 3 weeks of selling at YR1. 
FXI sum: Long term charts seem like they could go either way, but weekly pivot chart showing selling from YR1 makes this more bearish.

2 4 FXI Q.png

EEM
Q: At 61% multi year Fib!
M: Same Fib here, weak up - pullback easily possible.
W: Between levels.
EEM sum: I think still long term potential for up, and looks better than FXI. At key Fib and smaller up monthly chart is a test. 

2 7 EEM Q.png
2 9 EEM W.png

KWEB
M: A reason I locked in gains is that massive wick on monthly bar totally outside the BB.
W: Clear selling at YR2 for several weeks. 
KWEB: Still look this idea - but for now this is avoid. 

2 10 KWEB M.png

SHComp
Q: Not too bad, above all MAs except 10MA, weak selling with buyers stepping in. Could rally.
M: Room to rally.
W: YP held despite several times it could have broken. 
SHComp: I don't trade this too often but charts look fine here.
 

2 12 SCH Q.png
2 13 SHC M.png
2 14 SHC W.png

INDA
Q: Currency issues seem to have prevented a new high. India indexes are much higher than 2015 tops. 
M: This looks more to me like pause in uptrend rather than reversal, but needs to stay above the last month's close for this judgment to maintain.
W: Working off RSI OB in healthy fashion. Long consideration.

RSX
Q: Congestion, below falling 20, above rising 10. 
M: Congestion, below falling 50, above rising 20.
W: Held the YP! 
RSX sum: Probably will open below 2HP and Q3P despite bounce off YP. Congestion better to avoid until more clues on which direction is the larger move. 

2 19 RSX M.png

EWZ
Q: Below falling 20MA, above 10MA.
M: Below falling 50MA, above rising 20MA.
W: Between levels, partially due to very wide 2016 range. 
EWZ sum: Not much edge here.

2 23 EWZ W.png

Global indexes

I really like trading these because often more volatility both up and down than USA indexes, but often don't have time to do full blog post. 

In 2014-15 while at the fund I was all over the China rally and drop, and of course with oil crashing Brazil and Russia got hit too. On this site I started highlighting EWZ in February 2016 as a relative leader on the lows, and mentioned it frequently after that along with semiconductors. EWZ finished 2016 up 61% and actually put in 122% rally low to high tick for the year, so think about that for performance opportunities.

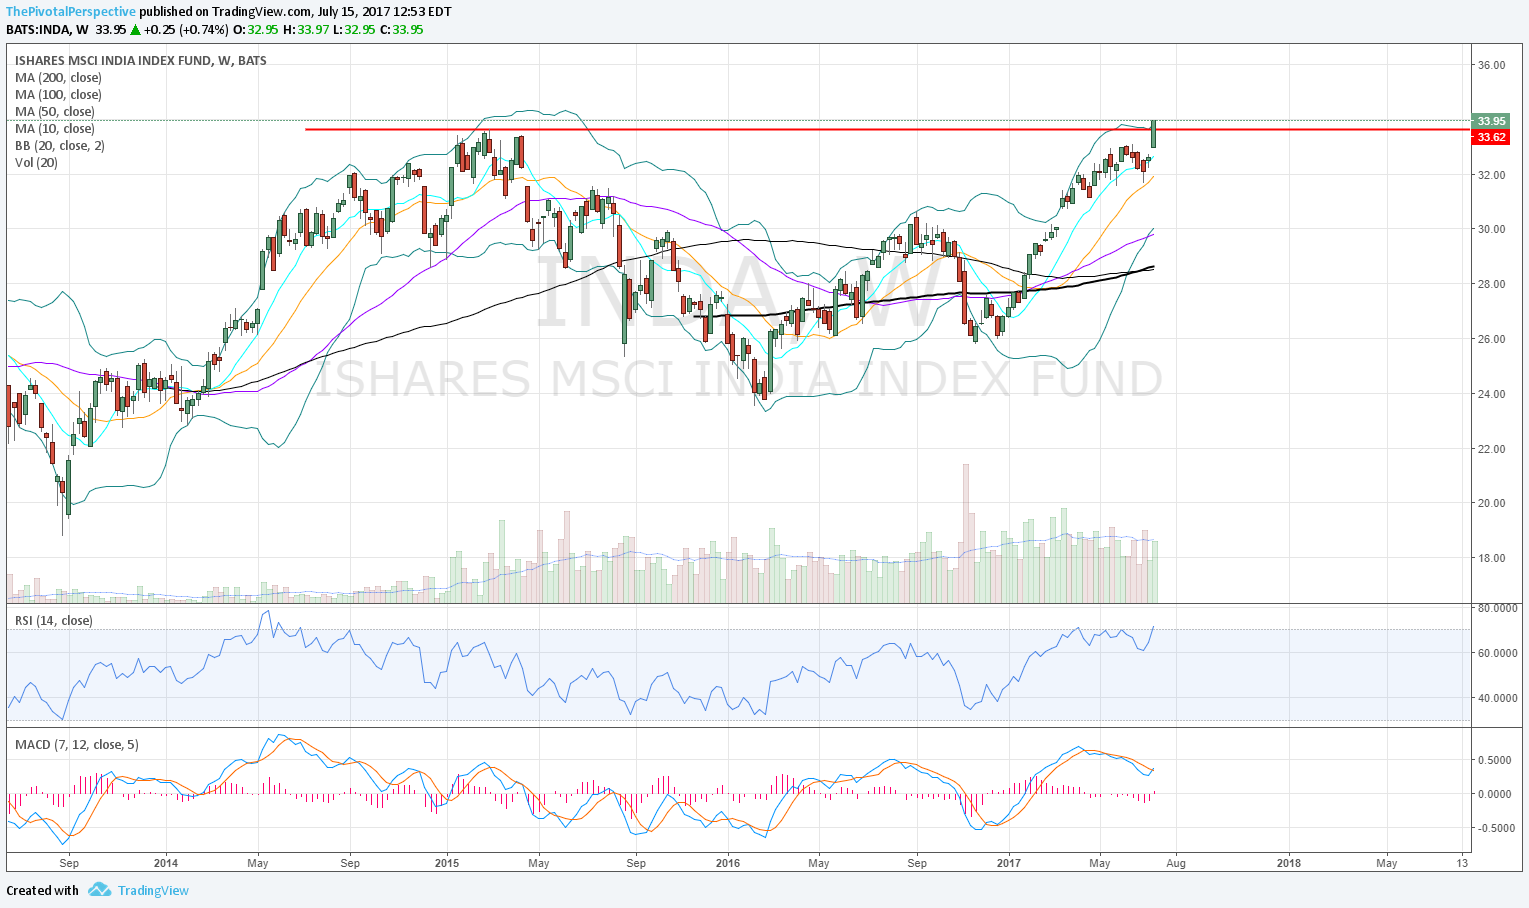
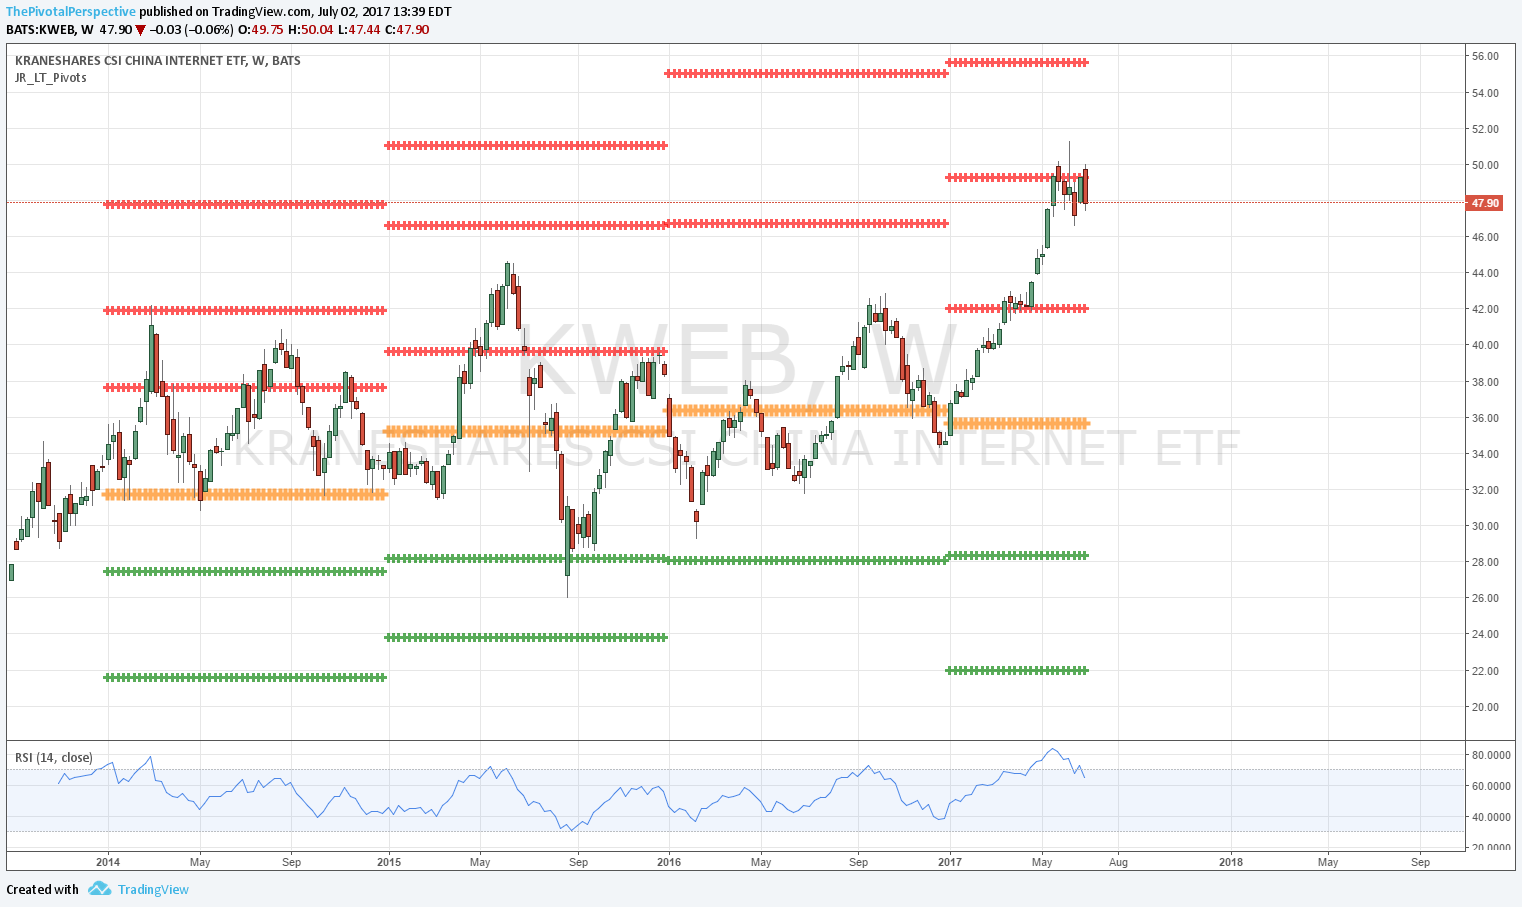
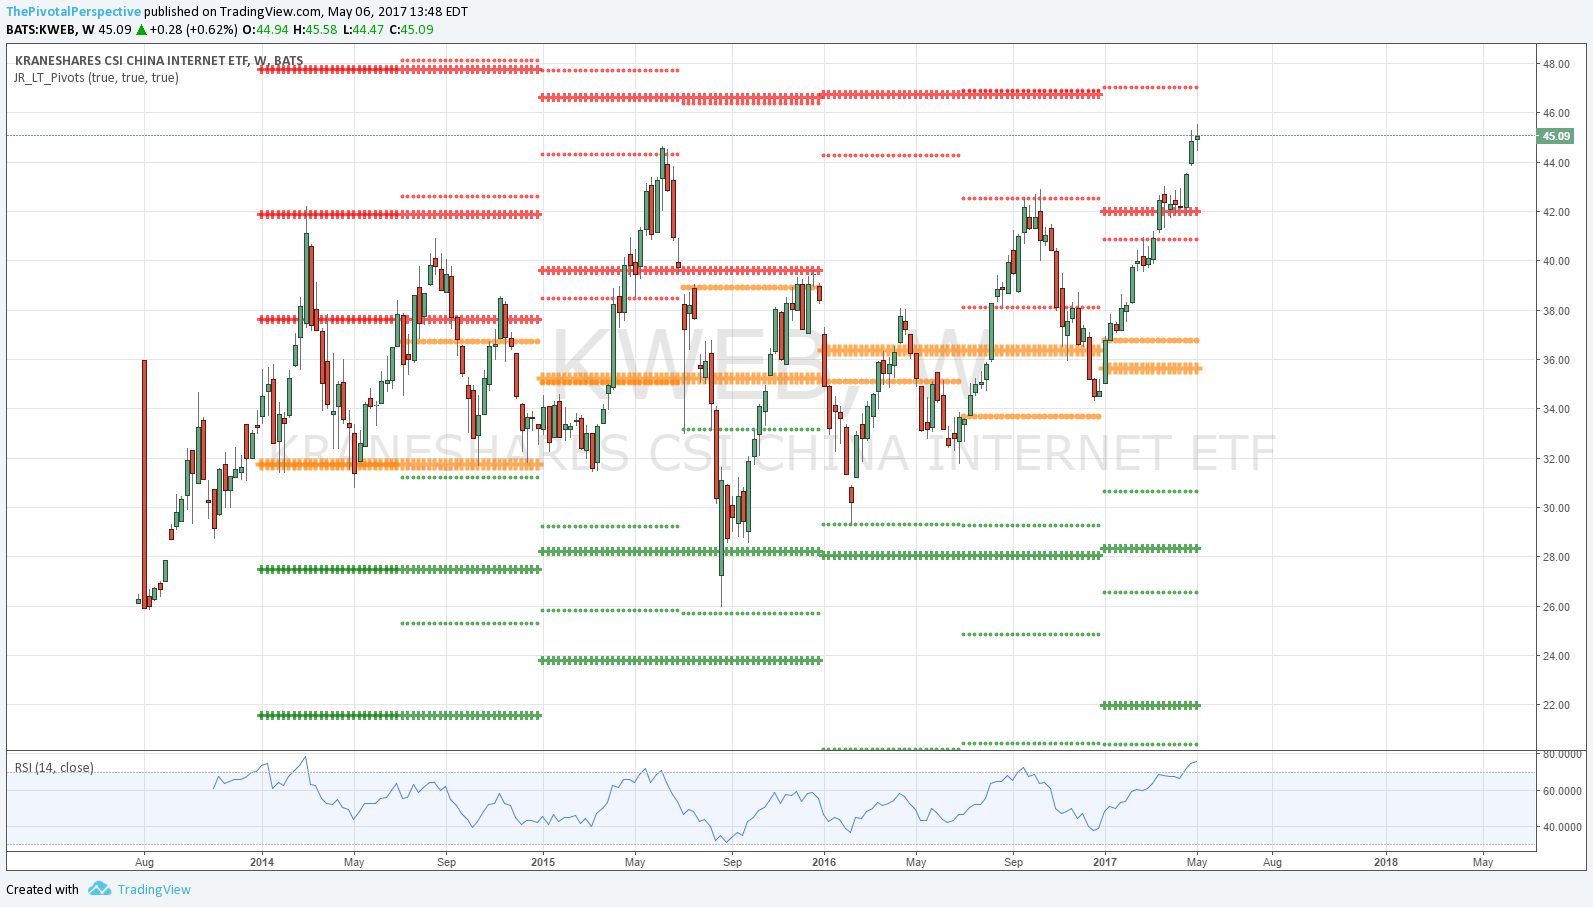
This year the story so far is India and China tech. I am kicking myself for not playing KWEB because I even posted on that end of Q4 2016, but life got busy in January 2017 and I just didn't have the same time for usual chart analysis. INDA is doing great at 19.5% YTD and portfolio has caught some of that move, but saw on finviz that small cap India ETF SCIF is up over 40%! This means in ETF land the best things to own have been India small caps, China tech, India in general, USA tech, and EEM. This is while Trump favorites financials and USA small caps have done very little. 

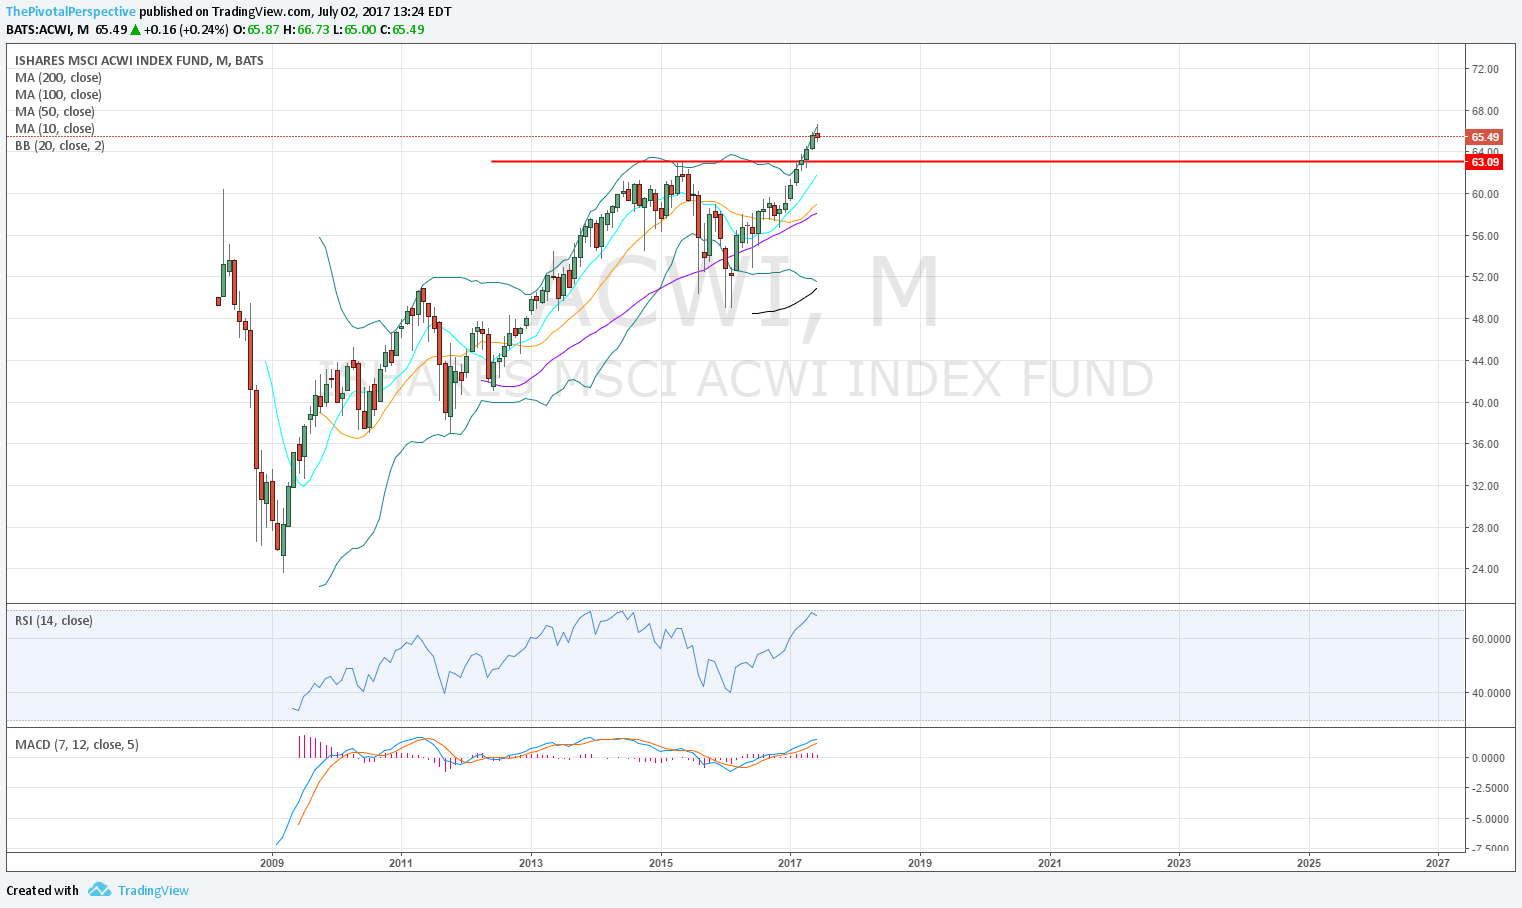
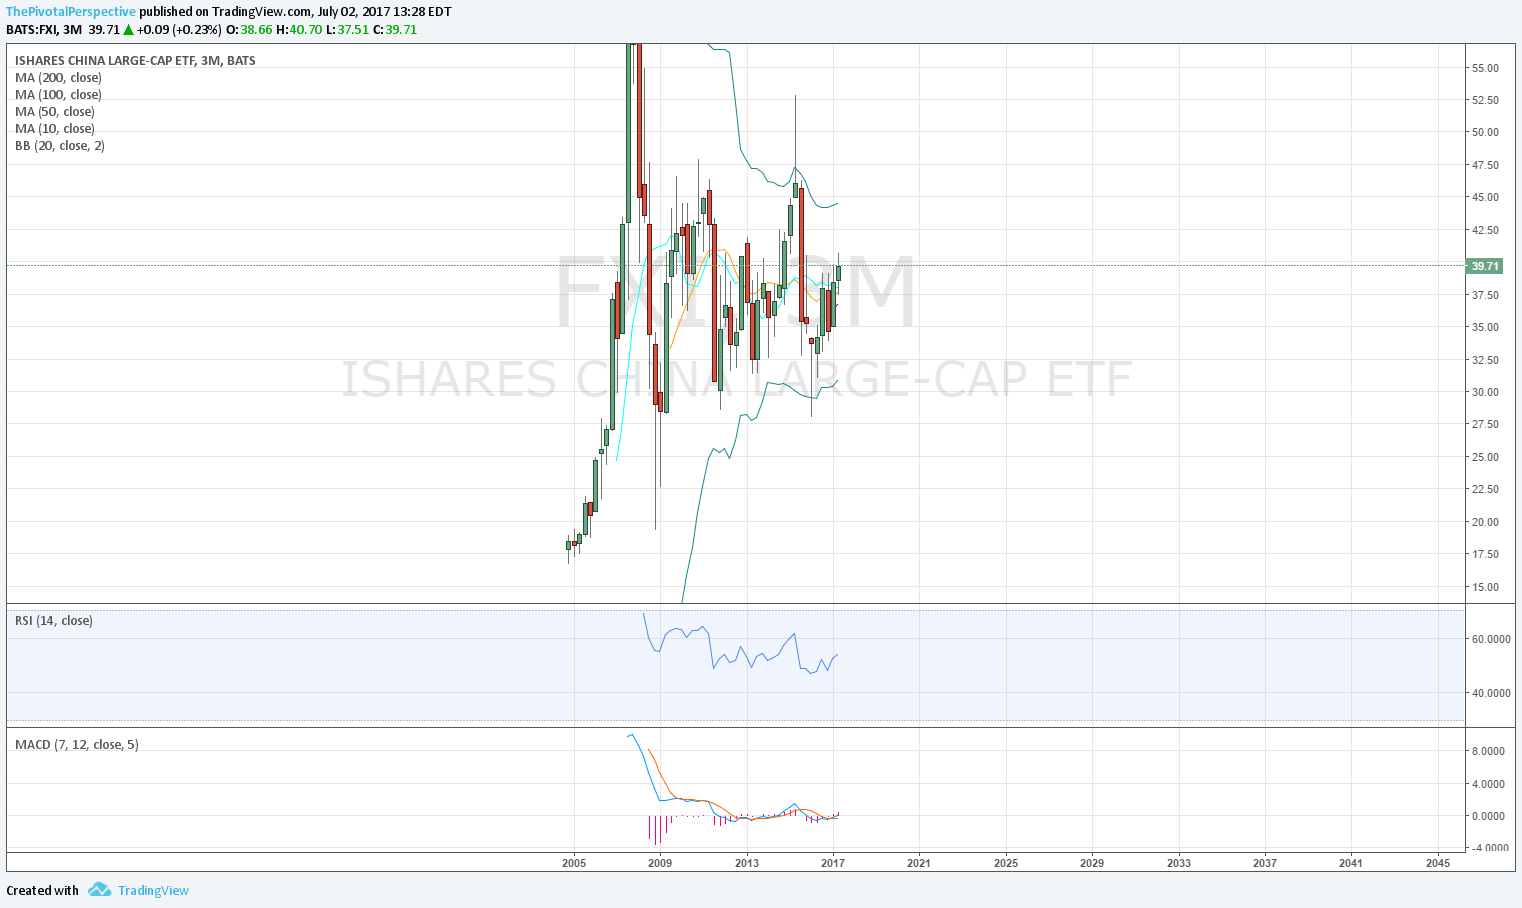
 In general the indexes I track are: ACWI, FXI, SHComp, EEM, INDA, RSX and EWZ, and recently added KWEB to that list. I don't really use ACWI as a trading vehicle, more like global counterpart for NYA/VTI. 

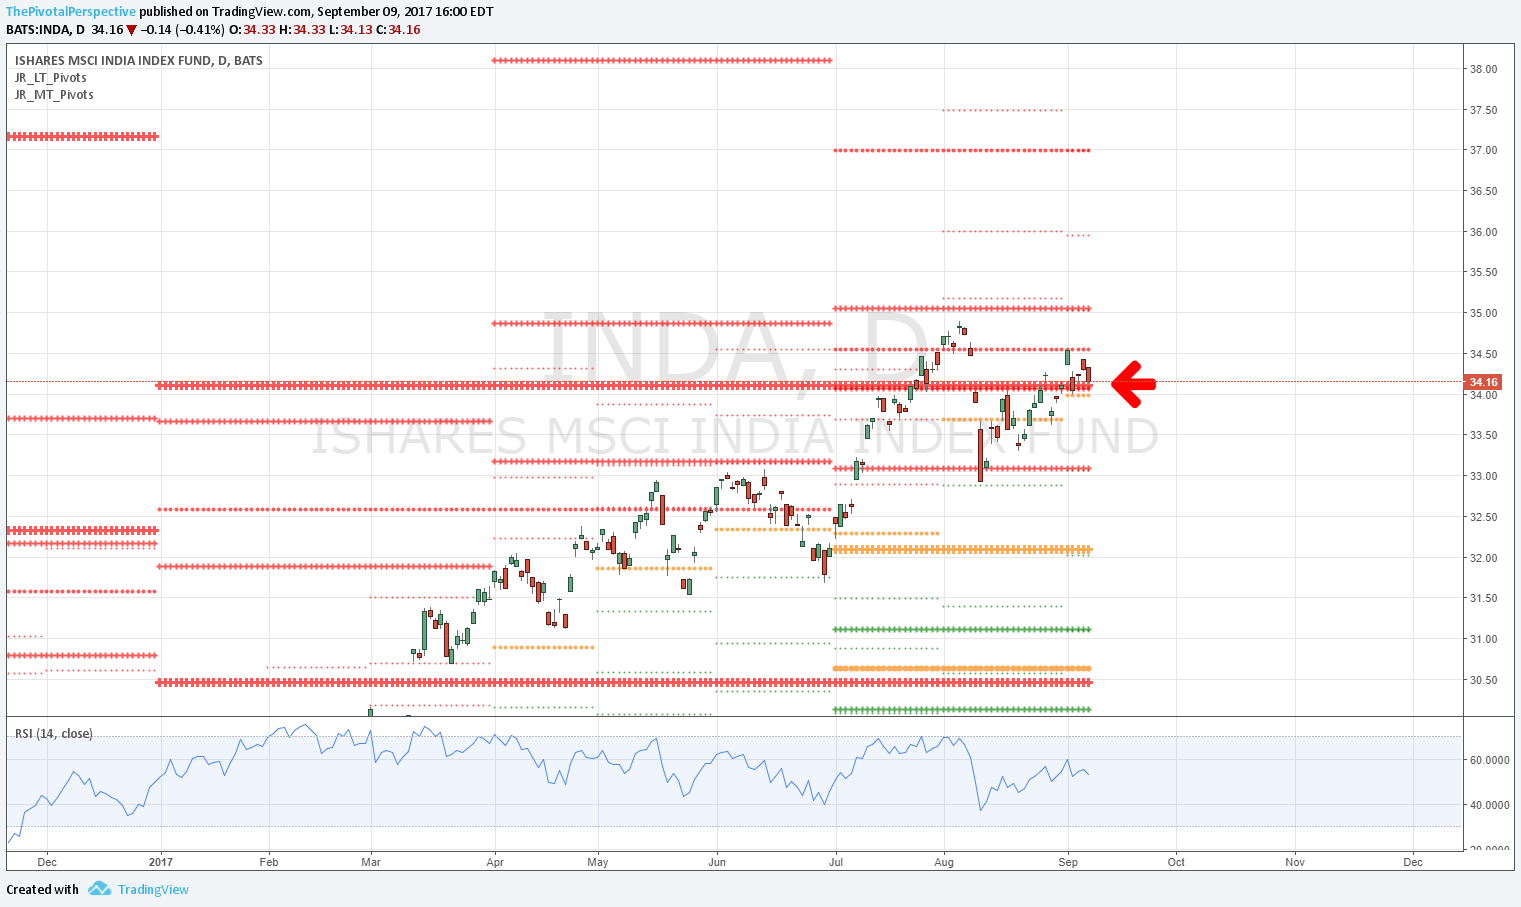
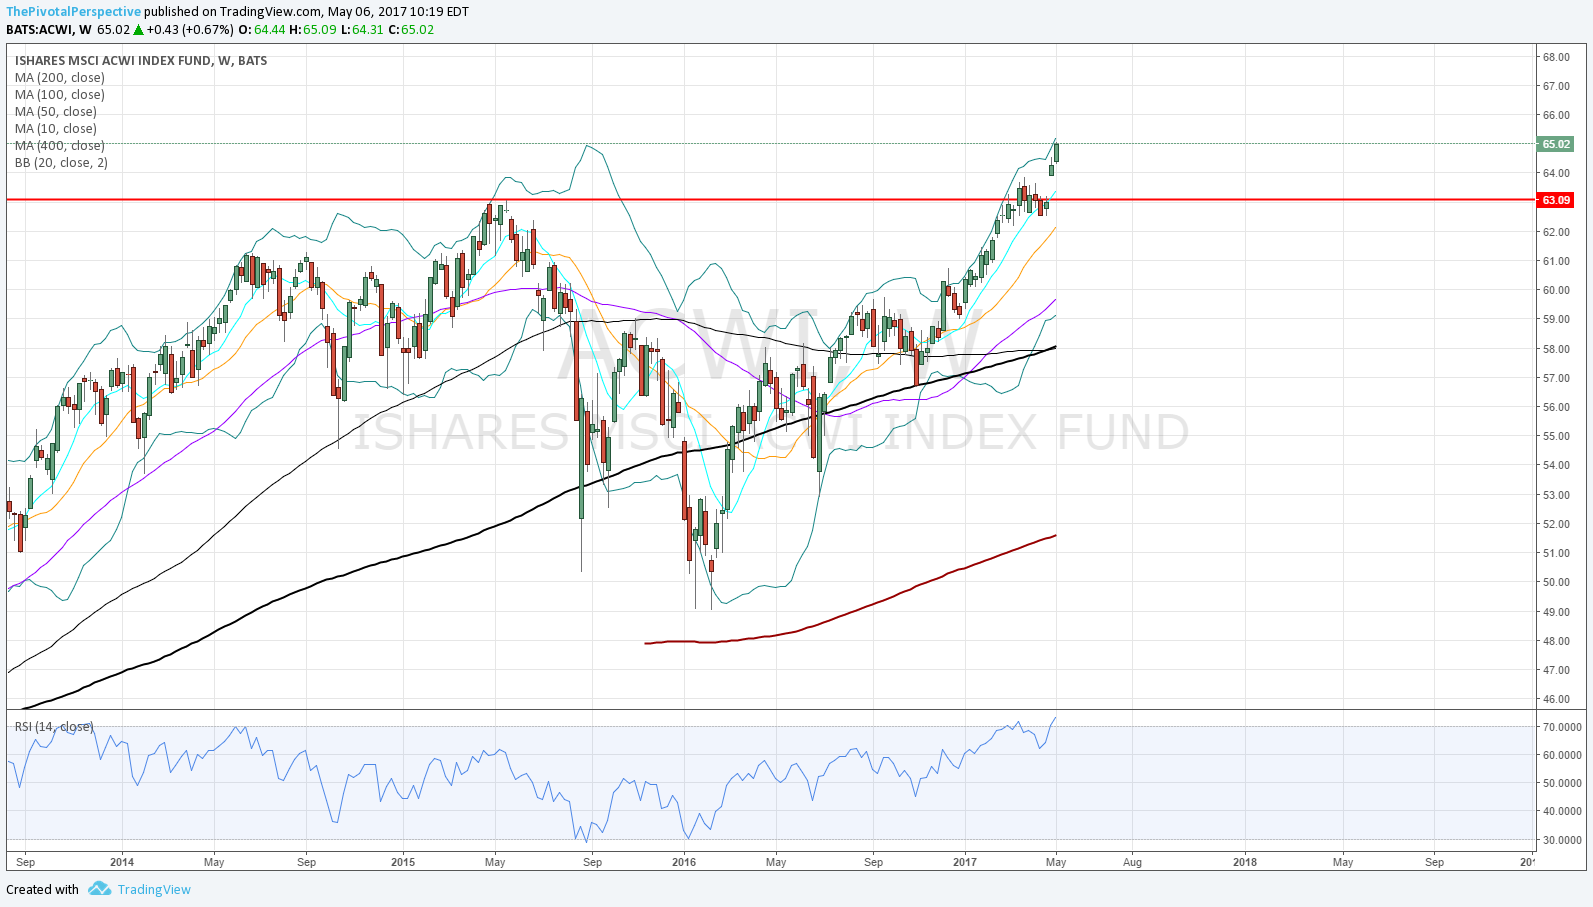
ACWI, INDA & KWEB lead
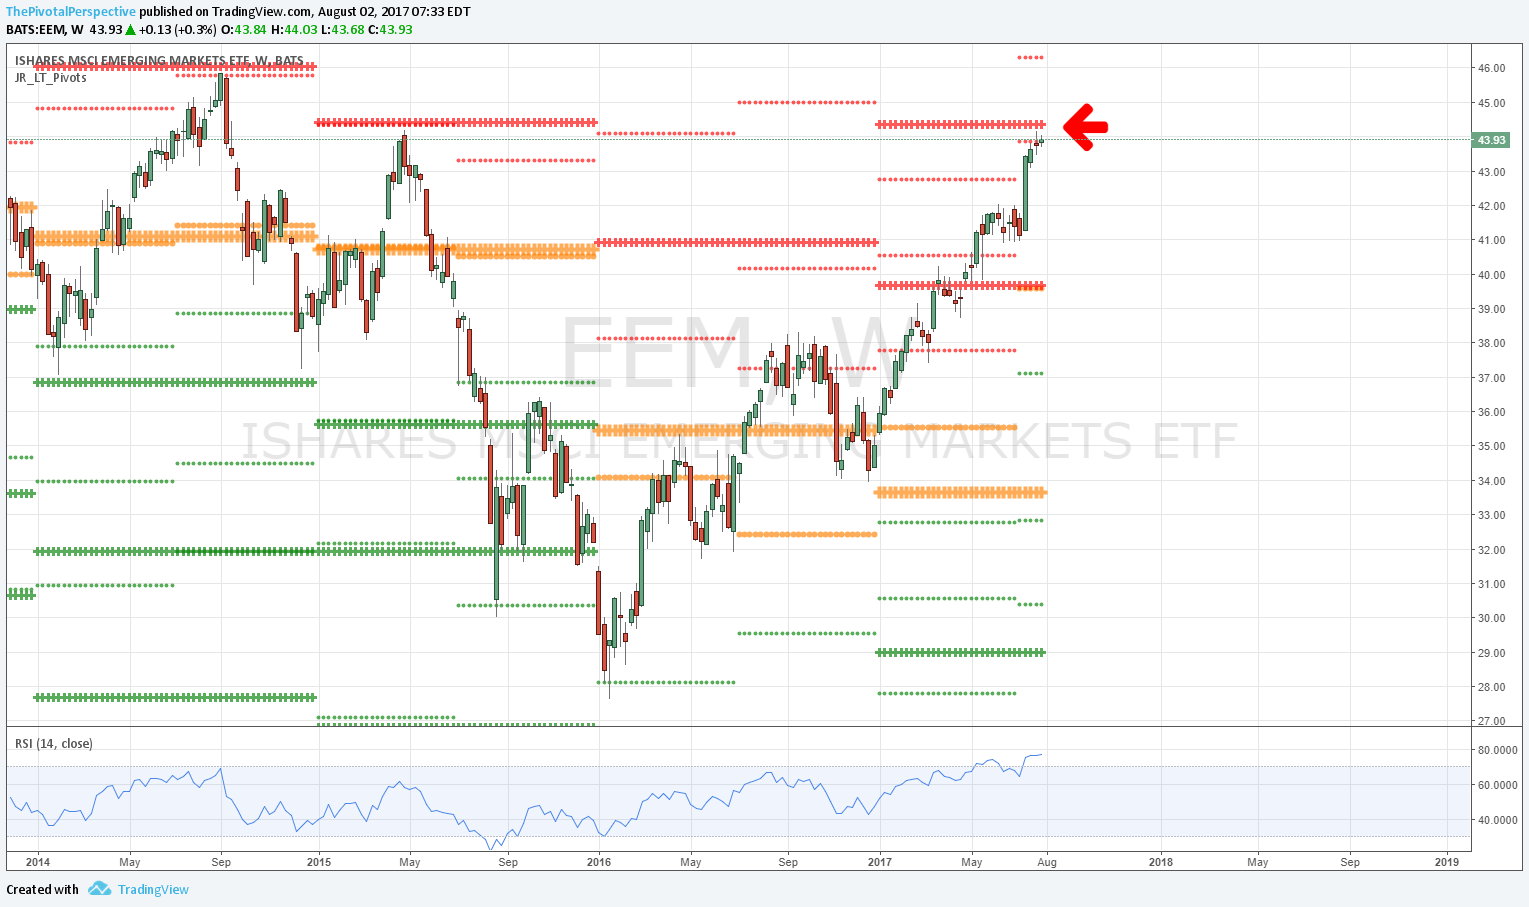
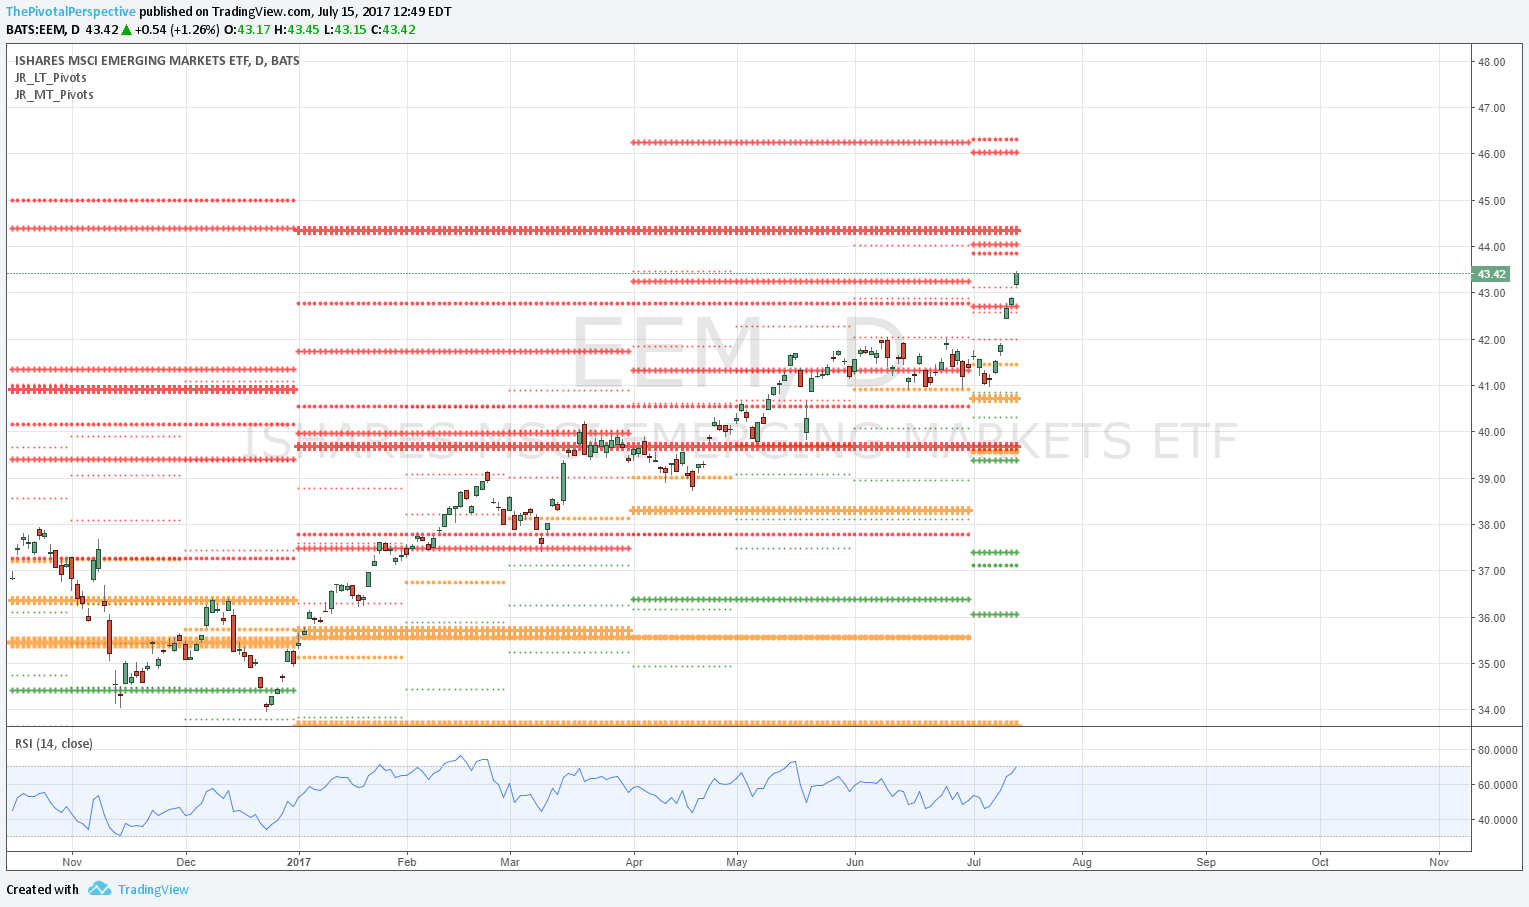
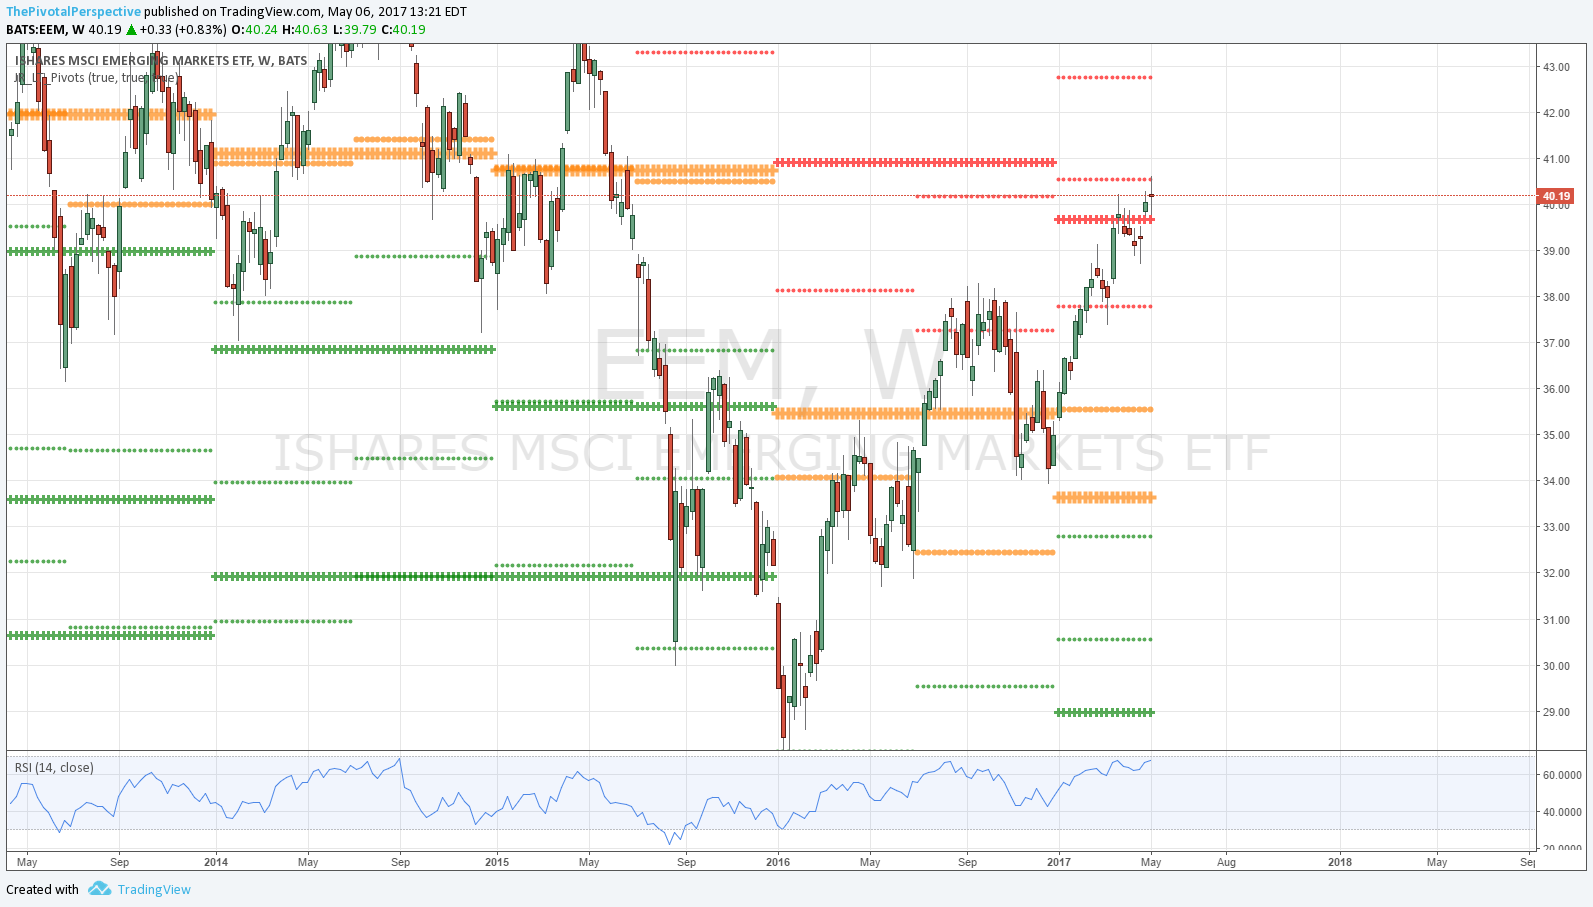
EEM also strong
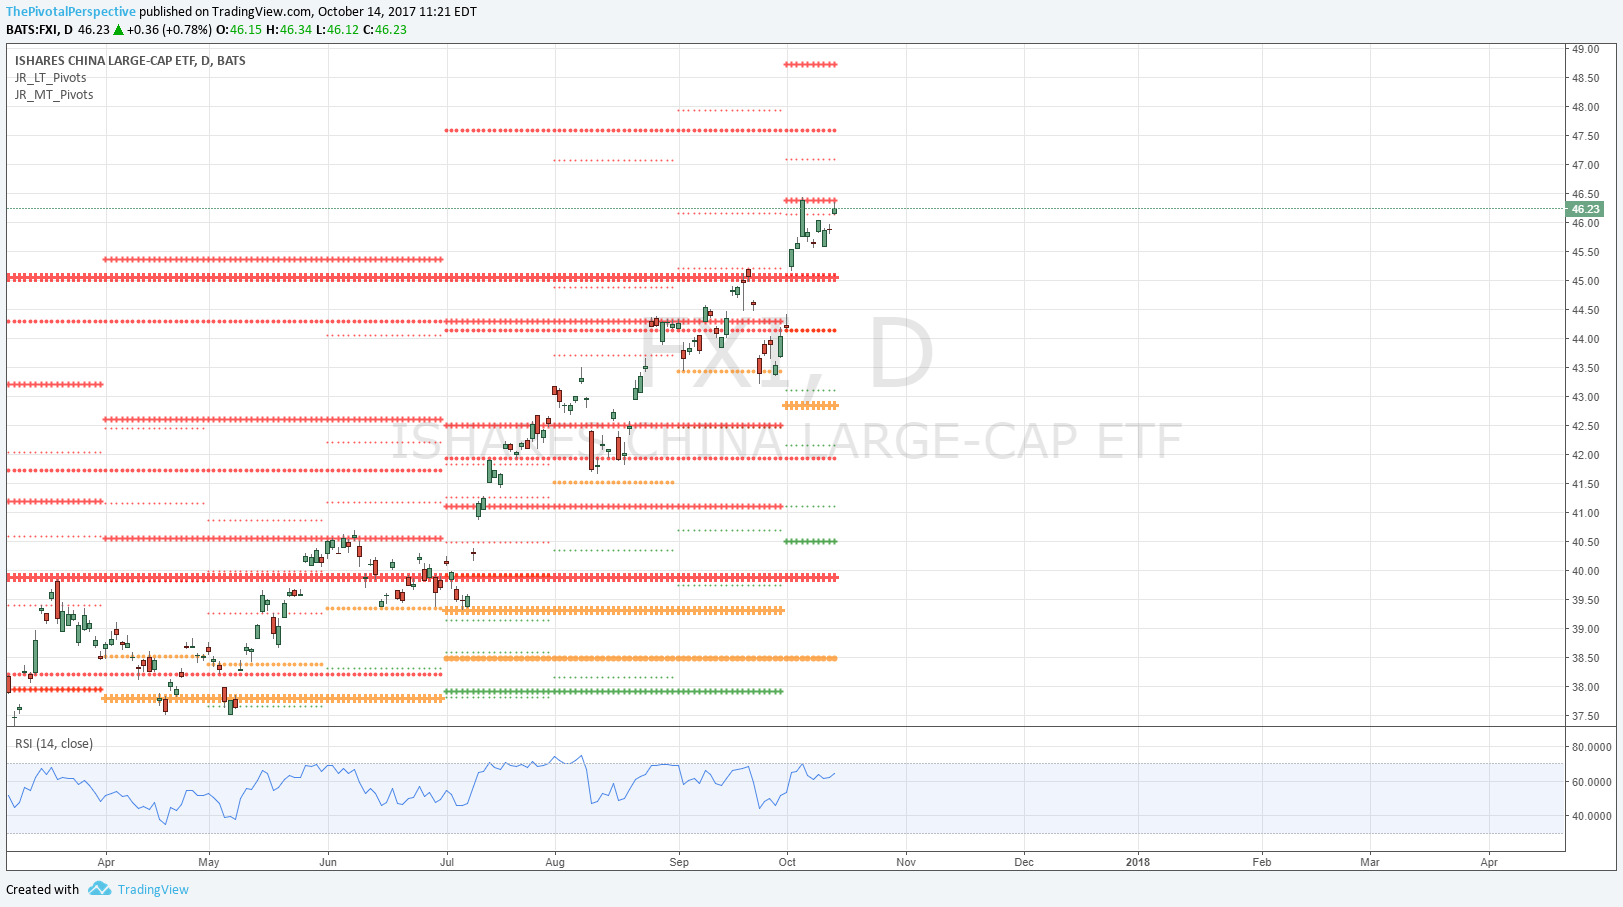
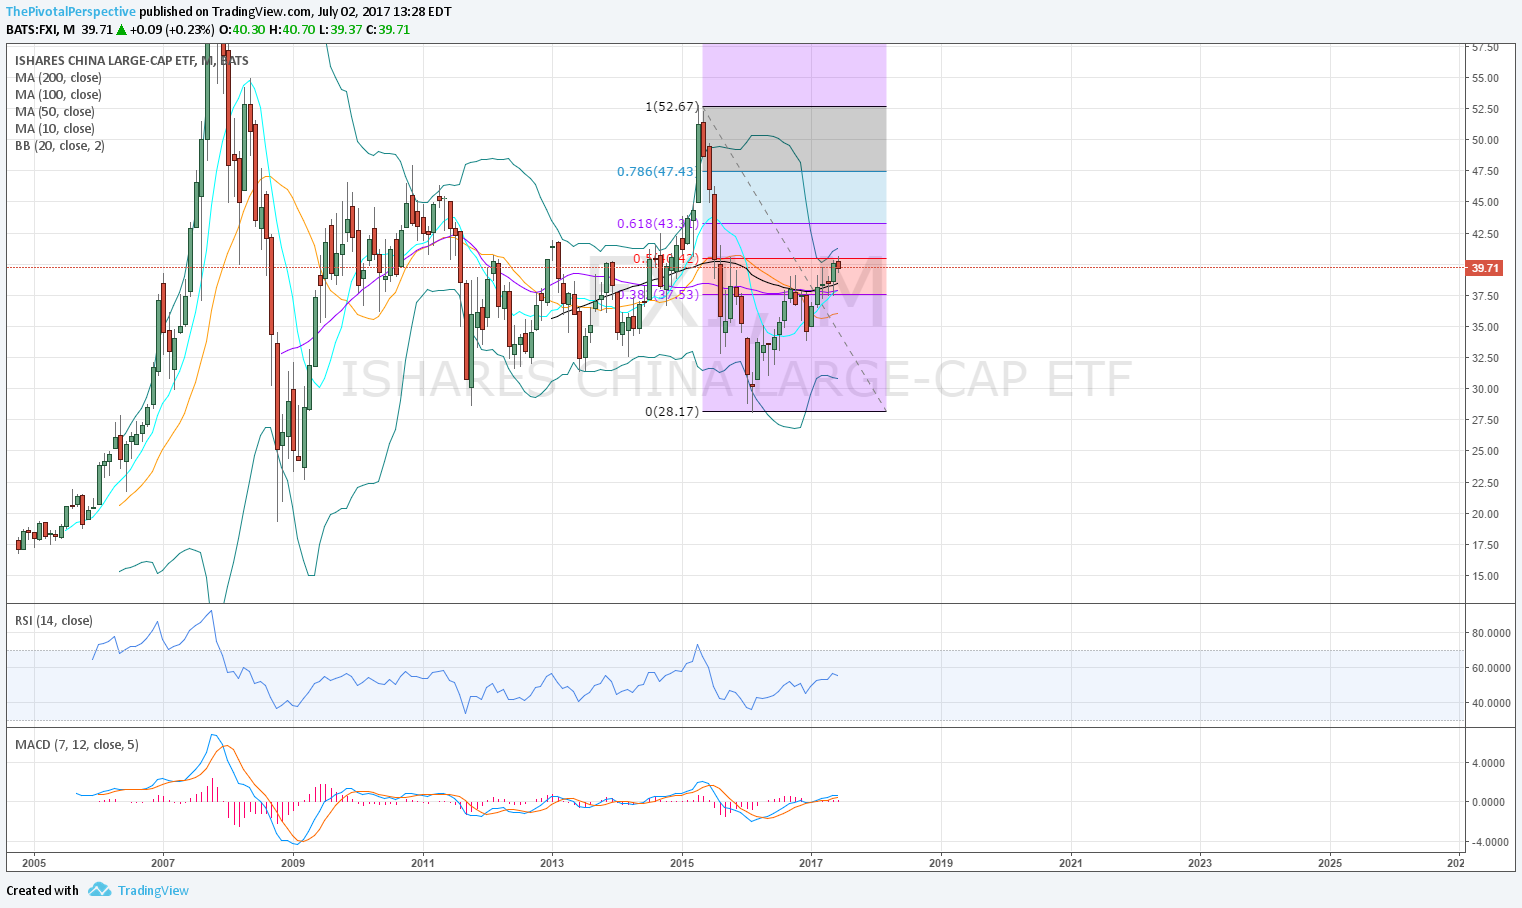
FXI weaker but testing Q2P
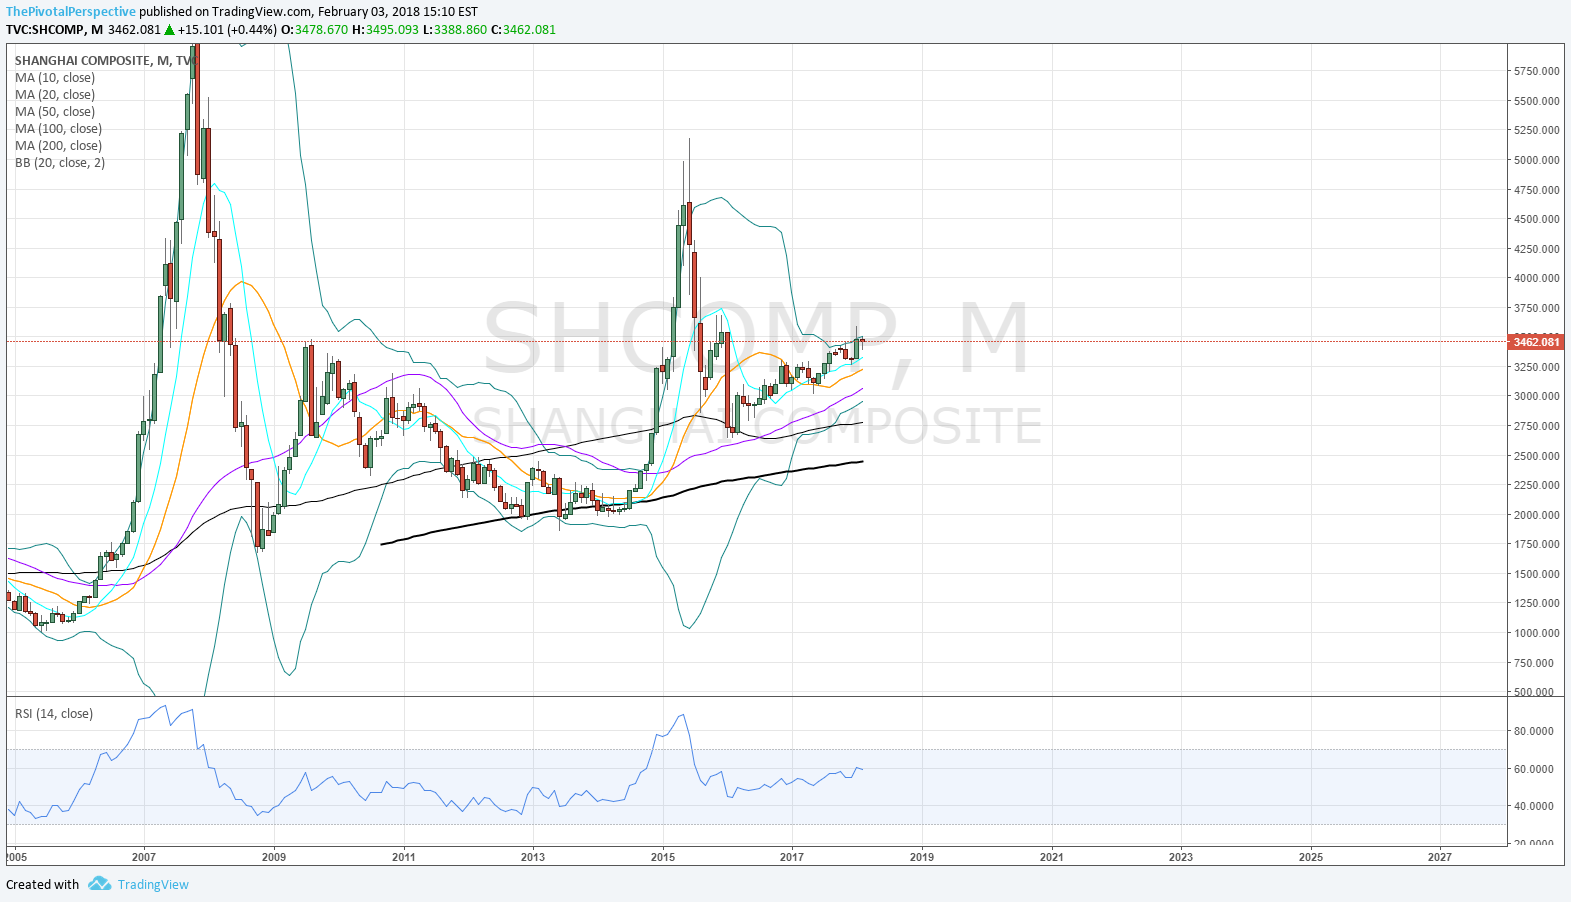
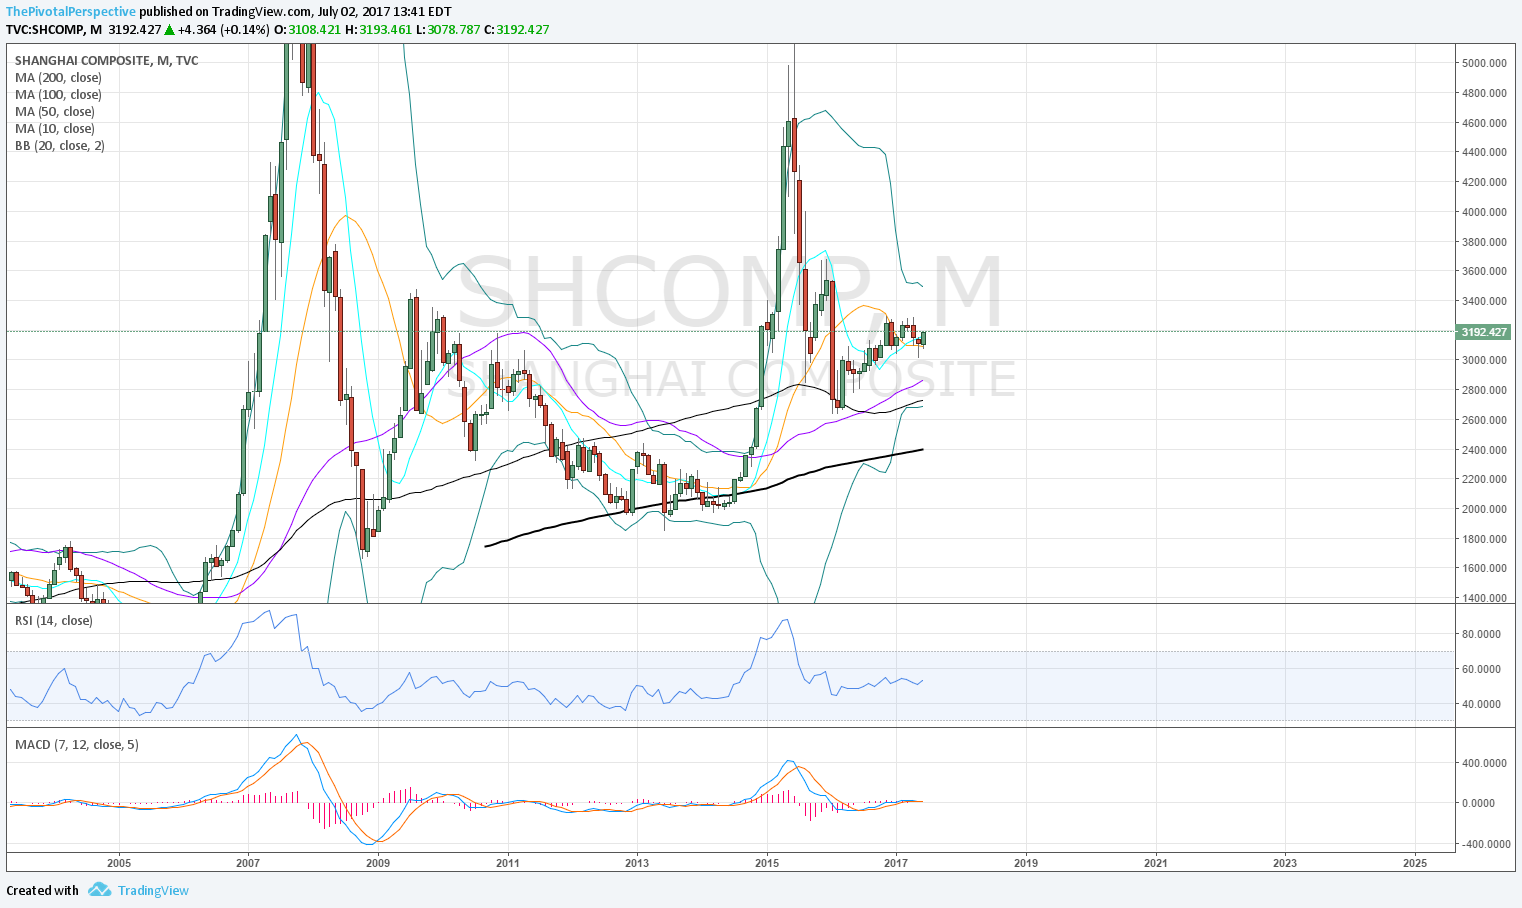
SHComp testing YP / 1HP combo - any lower and below all pivots, already 1 failed bounce
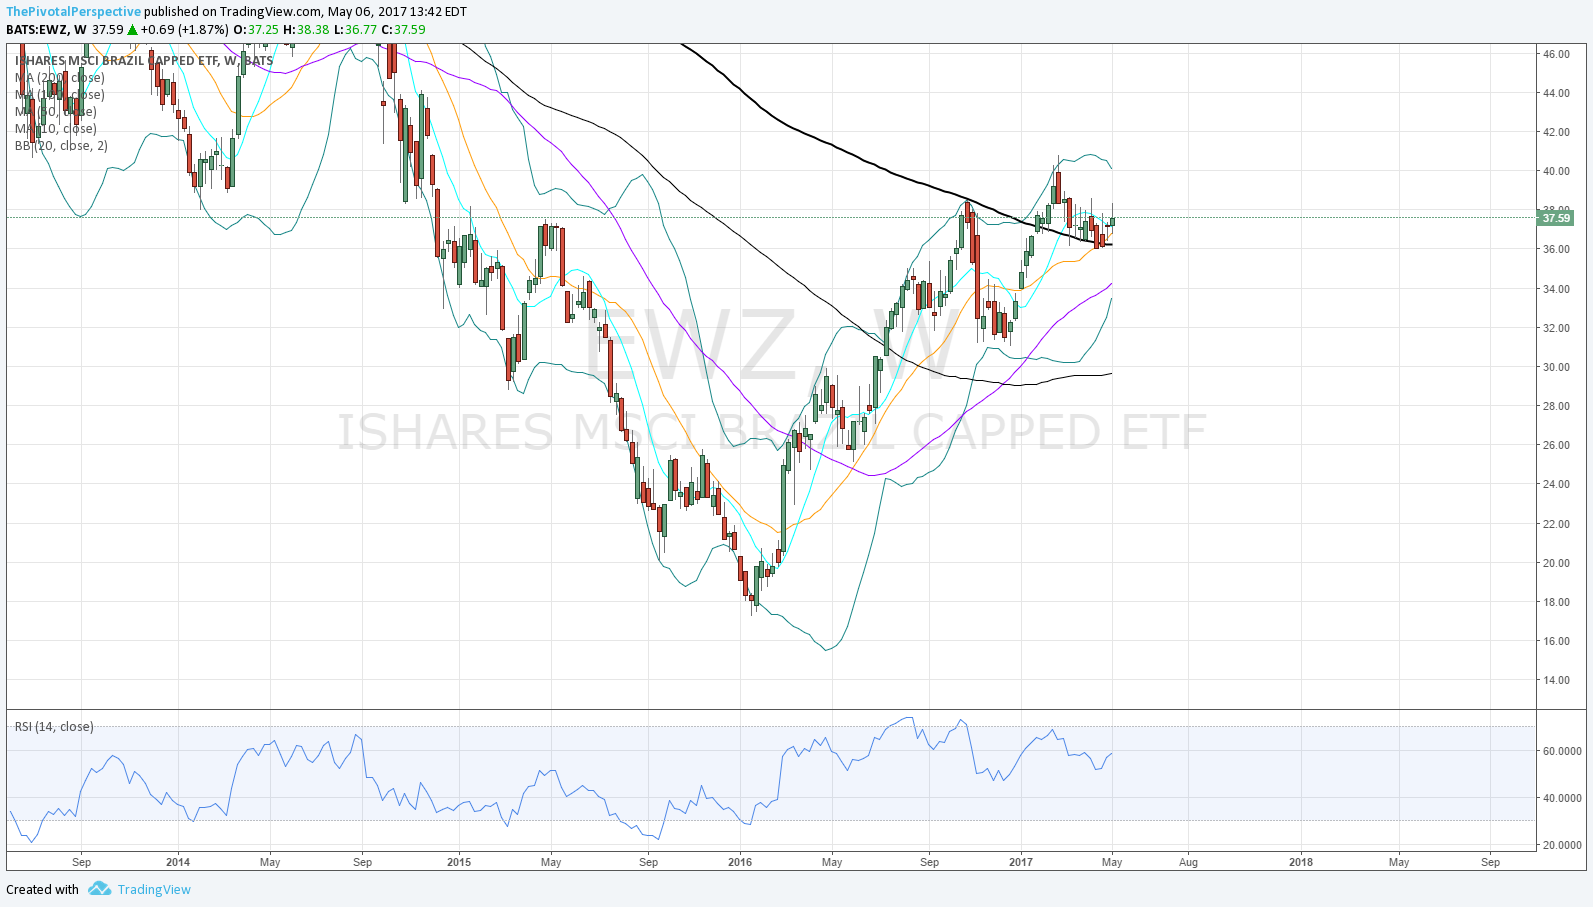
EWZ better than RSX but struggling at resistance and looks ready to drop
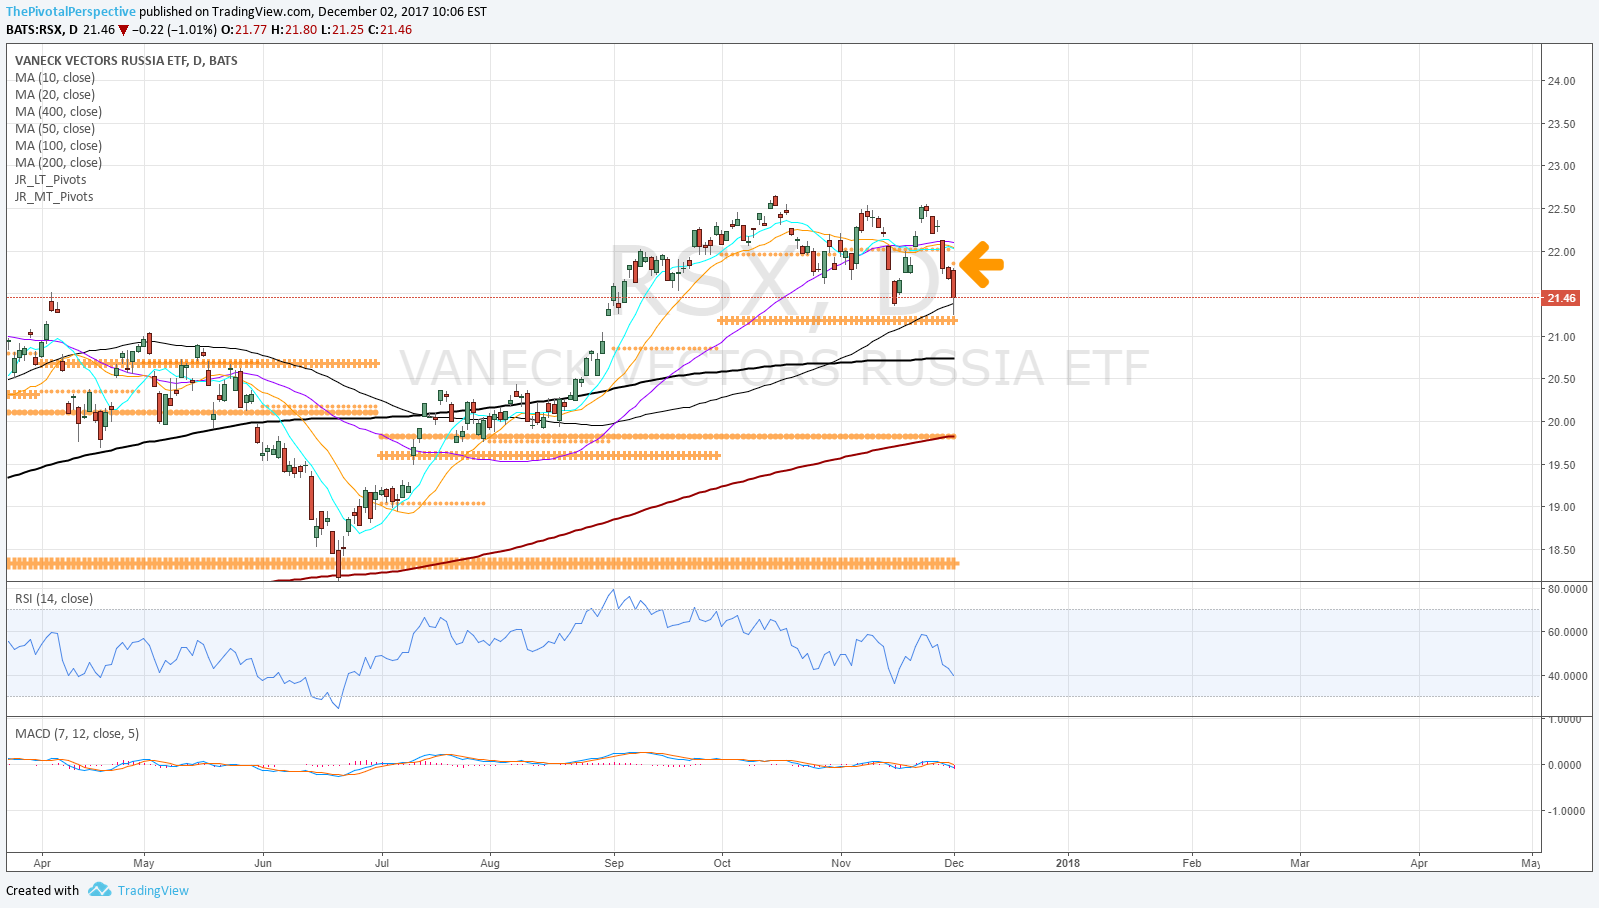
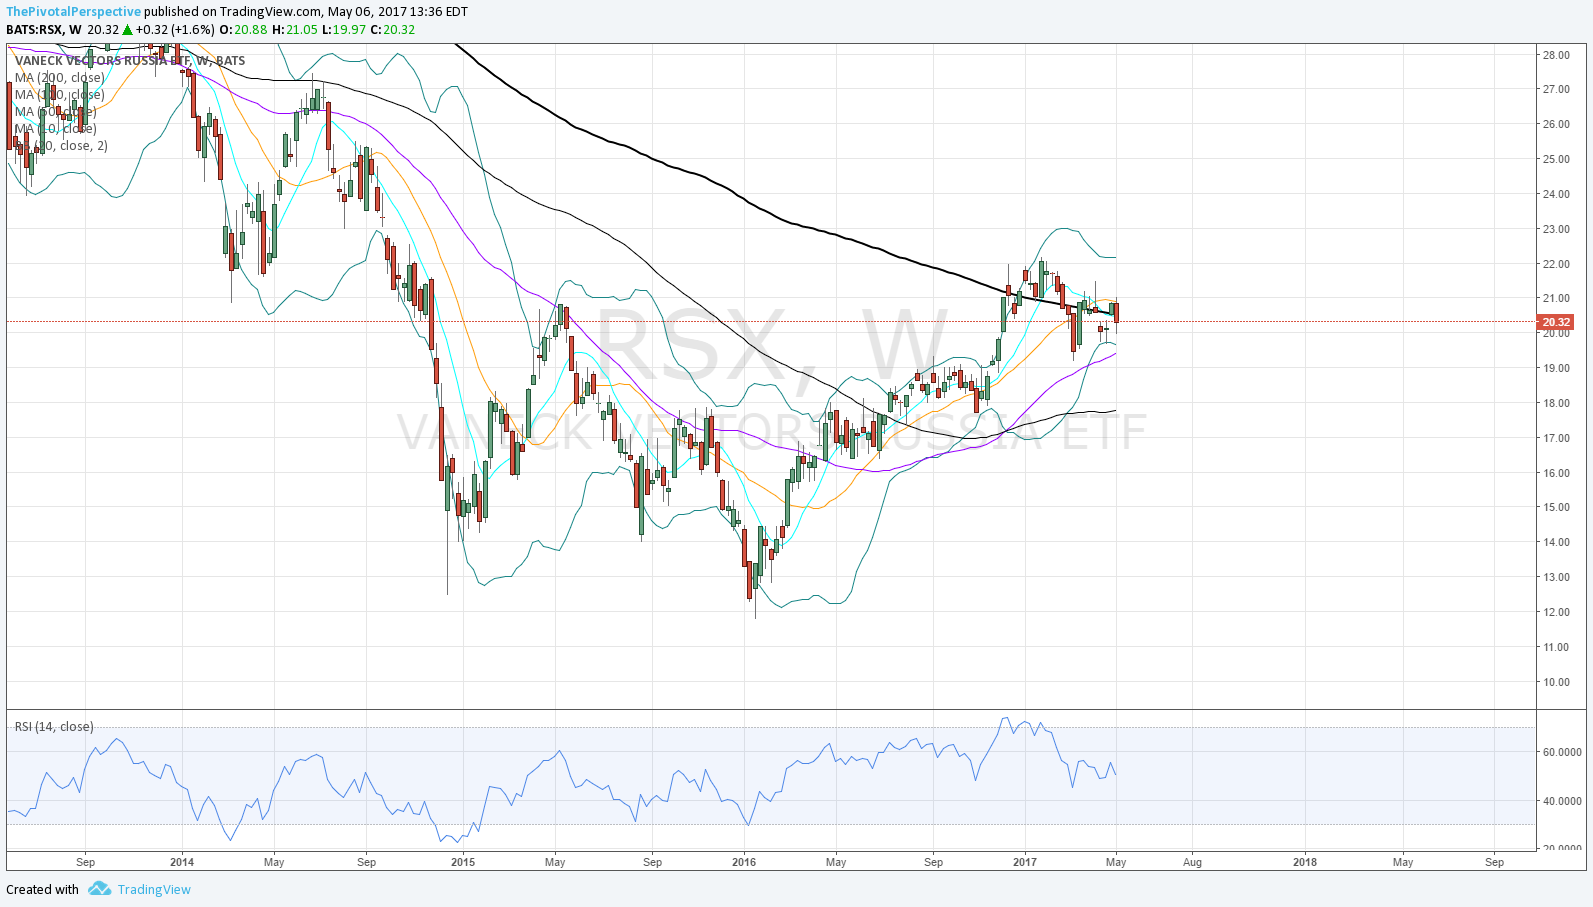
RSX below Q2P, still fighting back to hold 1HP again - some chop around this area along with weekly 200MA

Charts for each are a weekly with standard technicals, weekly pivot, and a daily pivot chart.
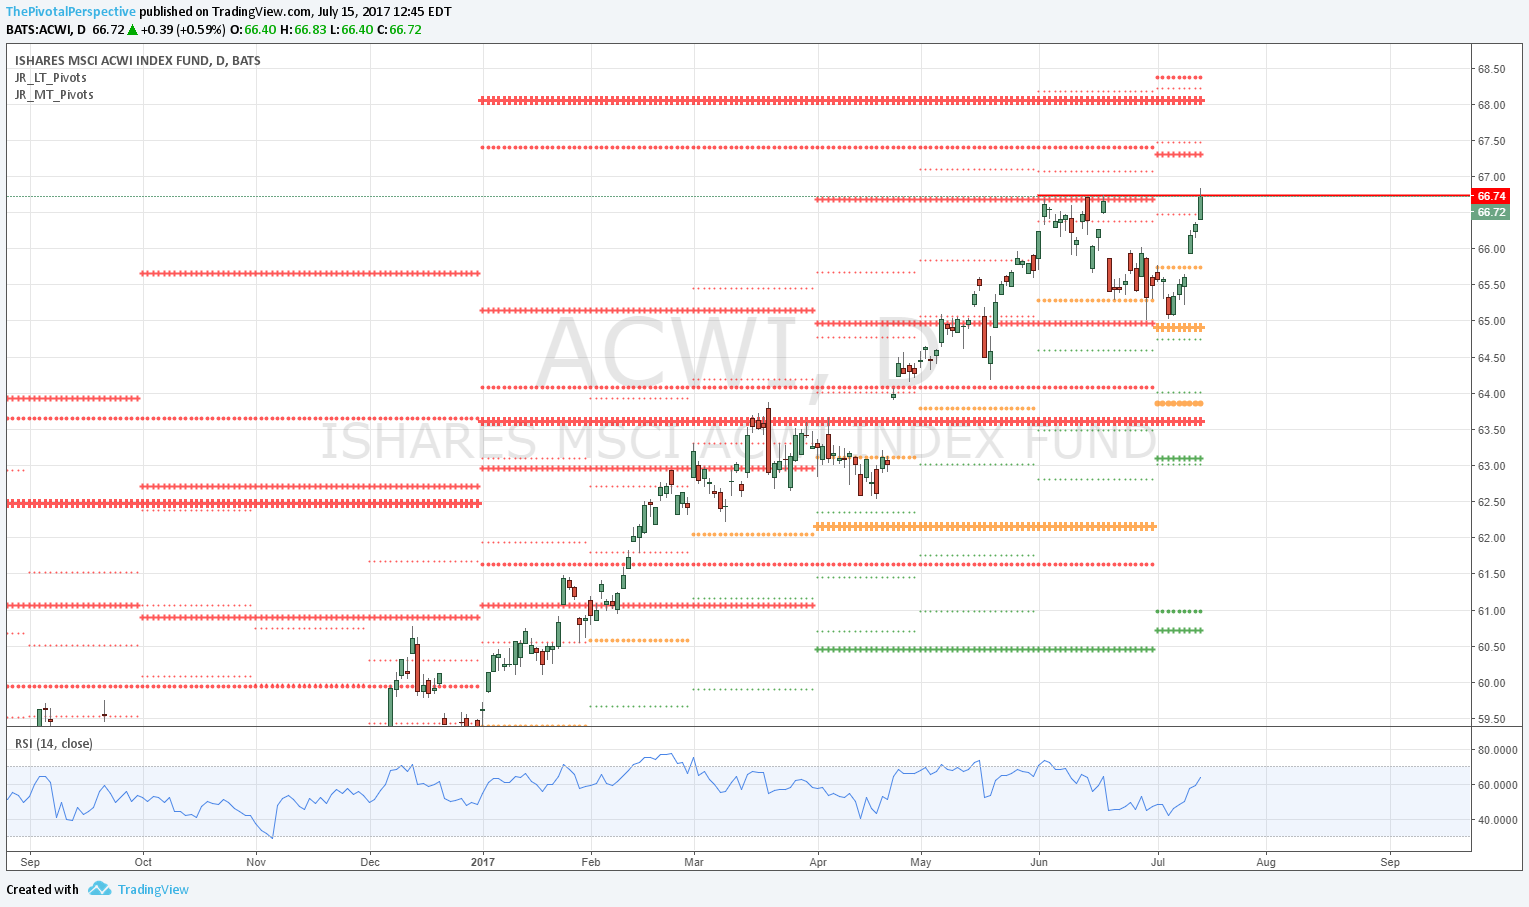
ACWI
Wow, powering up and very nice new highs on 5/5. Above long term resistance YR1 and 1HR2. Q2R1 only concern here along with daily RSI OB, but the weekly charts look like 2nd week above major breakout which should have more to run. 

6 70 ACWI W.png
6 71 ACWI W.png
6 72 ACWI D.png

FXI
Weekly 200MA in thick black tried to lift but failed. Still above rising weekly 20 though.
Top on YR1, and below 1HR1 as well - weaker.
Slight break of Q2P but decent recovery on 5/5. Also note massive selling from that YR1 level.

6 73 FXI W.png
6 73 FXI W.png
6 75 FXI D.png

KWEB
New highs.
Weekly chart lift above YR1 looks good.
Daily chart testing Q2R1 but may clear.

SHComp
Weekly chart from 100MA through 20MA no bounce and down to 50MA. 
Testing YP / 1HP combo!
Daily chart already shows one failed bounce from YP.
Any lower and SHC is below all pivots. 

6 79 SHC W.png
6 81 SHC D.png

EEM
Weekly chart above rising 200MA, much better looking than FXI.
Pivot charts above YR1, also more bullish.
EEM doing fine, but any more weakness in FXI would drag this lower too.

INDA
Should be able to reach 2015 highs given strength thus far.
Nicely above YR1.
Daily chart also above all pivots. 

6 83 INDA W.png
6 84 INDA D.png

RSX
3 tries above that falling weekly MA and 3 breaks. 
But 1HP not giving up yet. 

6 85 RSX W.png
6 86 RSX W.png

EWZ
Above the weekly 200MA, but weak bounce could easily drop back down.
1HR1 resistance for several weeks. 
Daily chart broken Q2P 3 times only to have 3 comebacks.
Not giving up but looks ready to drop. 

6 90 EWZ D.png

Global stocks

Global stocks have been great sources of trading and investment opportunities. In 2015 while USA indexes were sideways China had a terrific rally and then huge collapse. These moves were trade-able on ETFs (thin volume but there). EEM had a huge drop in the 2nd half of 2015, and Brazil has led most of 2016 in percentage return among country / index / sector ETFs.

There are a lot of possibilities but first let's divide between developed and emerging. Developed often means Europe with a focus on Germany and then Japan; with key benchmark indexes of DAX and NKY. If you are an American retail investor, then the choice is EWG & EWJ versus hedged versions. I tend to not mention these so much even though I have at other times had a significant focus on Japan - the main reason is these tend to be correlated with USA indexes and moves are more a matter of magnitude than direction and timing. Mostly, correlated not always. Regardless, if you are playing anything outside the USA, it is best to emphasize pivots and technicals on what you actually own versus an index. 

I'm sure there are people out there who want to include all the available country ETFs and this could be a worthwhile exercise, but I think quite a lot moves together anyway and I'd rather stick to the main vehicles. 

Moving onto emerging markets the big ones I track are:

FXI - China via Hong Kong
EEM - popular emerging index
INDA - India
RSX - Russia
EWZ - Brazil
ACWI - Global benchmark, kind of like NYA functions for USA indexes
Shanghai Comp via XGY0 on trading view, close enough, and tradeable through ETFs

We could also get into China tech cos and corresponding ETFs because they are significant in market cap but let's save that for another day. 

The main point is if we are positioning and selecting 1-2 USA mains, 1-2 USA sectors, 1-2 global indexes, 1-2 currency commodity positions, then a selected 0-3 as shorts then we are at about 10 different vehicles maximum. I'm sure most people have more but to me this right for an active trading account. 

For each global vehicle - weekly technical chart, weekly long term pivot chart, and daily pivot chart. 

FXI
Monthly chart at several MAs clustered, so an interesting area to watch: 20MA 37.52, 50MA 37.92, 100MA 37.85.

FXI W
Long term pivots show short cover / speculative buy chance on the February lows, then partial long term buy in 2nd half above the 2HP. 

FXI D
Monety was made in July and August; chasing in September, the 3rd month above the monthly pivot, got you in at highs. Since the election it sold off but now come back to about even. 

EEM M
Despite the percentage strength of most of 2016, thi sis under falling MAs on the monthly chart (all falling slope except 10MA). 20MA currently 35.40 interesting to watch as we head into the monthly close. 

EEM W
Responding very well to pivots with 2014 high, 2015 high, and the 2015 and 2016 lows all on long term levels or near enough. 2HP in 2016 has acted as support and EEM was able to clear the YP and then hold. Post election break but coming back - key level to watch here at 35.45.

EEM D
And there is the YP on the daily chart with a falling 20MA right on top. That said, rising D200 has basically held after trading only 3 days below. No signal long or short here, interesting level to watch. If anything I'd try shorting against the YP since the 20MA and 400MA are both falling, but with risk health and safe havens weak I would not be surprised at attempt to clear. 

INDA M
Modi's cash exchange not working so well, but maybe this is a buy chance. 

INDA W
Getting out of the way of YP rejection saved some pain here. Back above 2HP would be a positive though. 

INDA D
Even if 2HP clears, most daily moving averages against a rally except recently stabilizing 10MA. 

RSX M
Crashed with oil and has had decent rally enough off lows, but not too zippy in the second half. 

RSX W
Attempting to stay above YR1. 

RSX D
Issue with shorting the YR1 is still above all pivots and all rising MAs. Considering other global indexes, RSX could be long 11/15 and now seeing what happens. 

EWZ M
Incredible percentage rally but stopped running into falling 50MA (also weekly 200MA). 

EWZ W
First sign of strength in early 2016 was a bottom above long term support, where everything else was testing or breaking YS1s. Currently trying to stay above YR1 after breaking 2HR1. 

EWZ D
Note bar of election under NovP where it has been above, and below 2 MAs. 

Shanghai Comp
Quietly holding M50MA along with M100, back above M10 and testing M20 at 3470.
 

SC W
Partial buy possible from 10/10 week above 2HP for the 2nd time. 

SC D
Pivots and MAs agreed in August that failed, but next time has been a very nice trending move. But with RSI mostly overbought from 11/11, no new entries up here.