CNBC tends to go on about Dow new highs, but to me the real story here is global stocks, and most especially sizzling China and India. These have been aided by the plunging $USD and Yellen's dove rate hike talk.
I try to keep an eye on these as they are great trading vehicles, but only post occasionally due to time constraints. Still, on this site I've frequently mentioned: ACWI, FXI, EEM, SHComp, KWEB (recent addition), INDA, RSX and EWZ. Let's take a look.
A more thorough approach would consider the base indexes, as most of these except SHComp are going to have the $USD involved. $DXY has been dropping like a rock and approaching YS1 at 94.86. If this holds then the steam may come out of global indexes, but currency trends seem to persist more than stocks and larger timeframes look terrible so I'm not too worried about DXY strength taking away recent gains from INDA and EEM.
Everything except SHComp rallied big, and even RSX and EWZ recently back above all pivots. That said RSX and EWZ weekly charts are not in uptrends like the others (RSX high 1/2017, EWZ double top 2/2017 and 5/2017, still well under those highs) so could be considered interesting hedging trades against EEM and INDA longs. RSX and EWZ also impacted by oil which will be something to watch if using those as shorts.
Bottom line here is that FXI, EEM, KWEB and INDA just had *massive* buying to quickly propel them to convincing new highs. This kind power move outside weekly and daily Bollinger bands doesn't tend to immediately reverse, even if daily RSIs are apporaching overbought.
PS - Did I mention? INDA position 7/5, EEM 7/10 for 40% of portfolio.
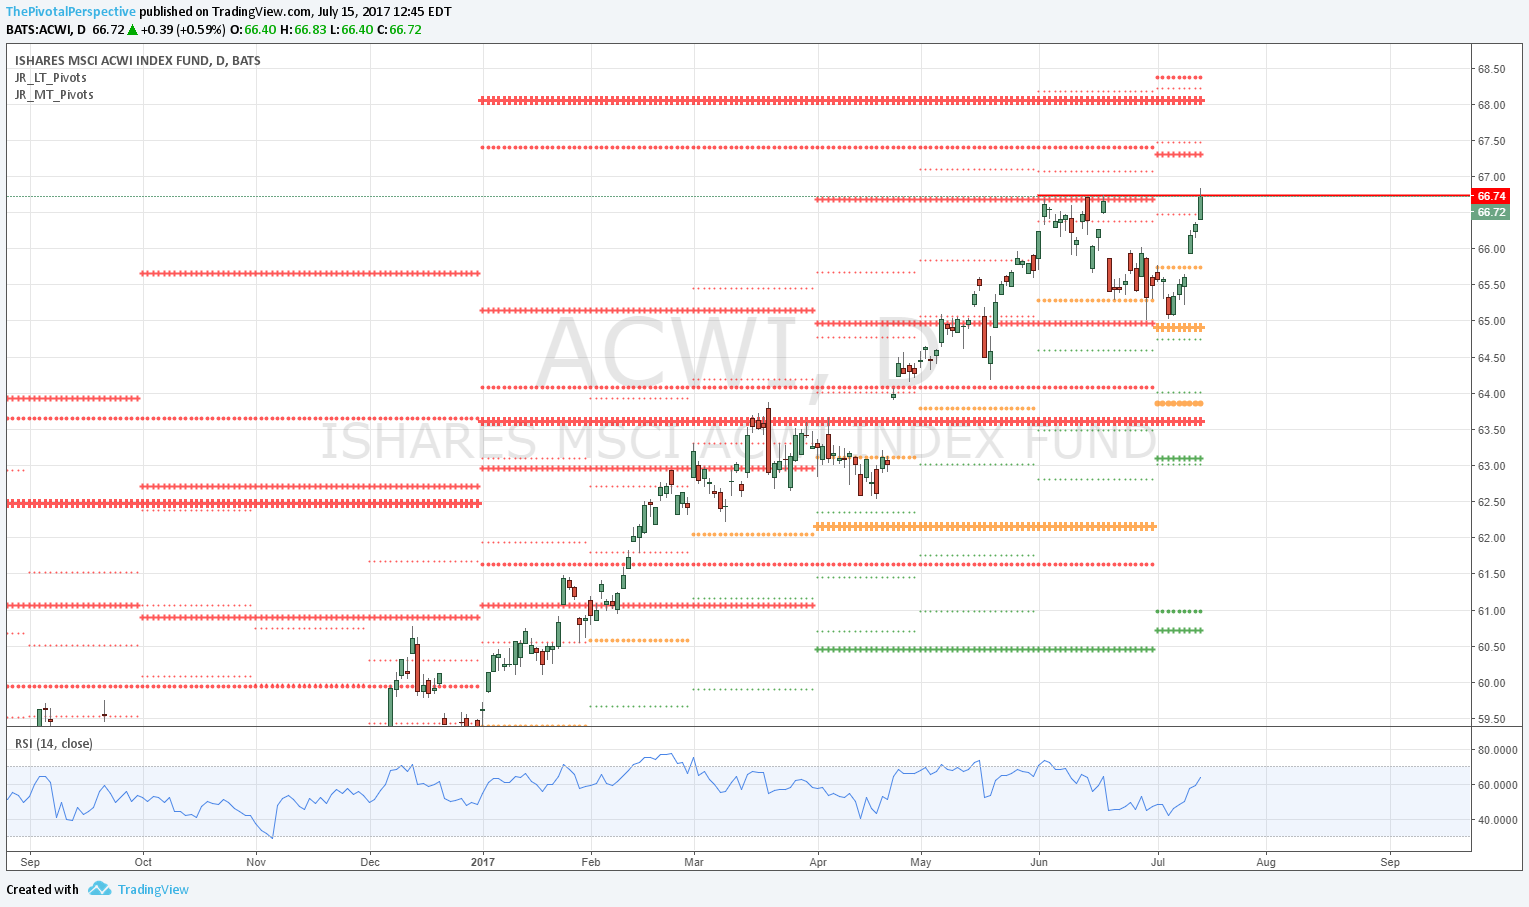
ACWI
Double top but otherwise all clear for higher levels.
FXI
W: Wow - blast off. This is not the kind of move to immediately reverse.
D: Already at 2HR1!


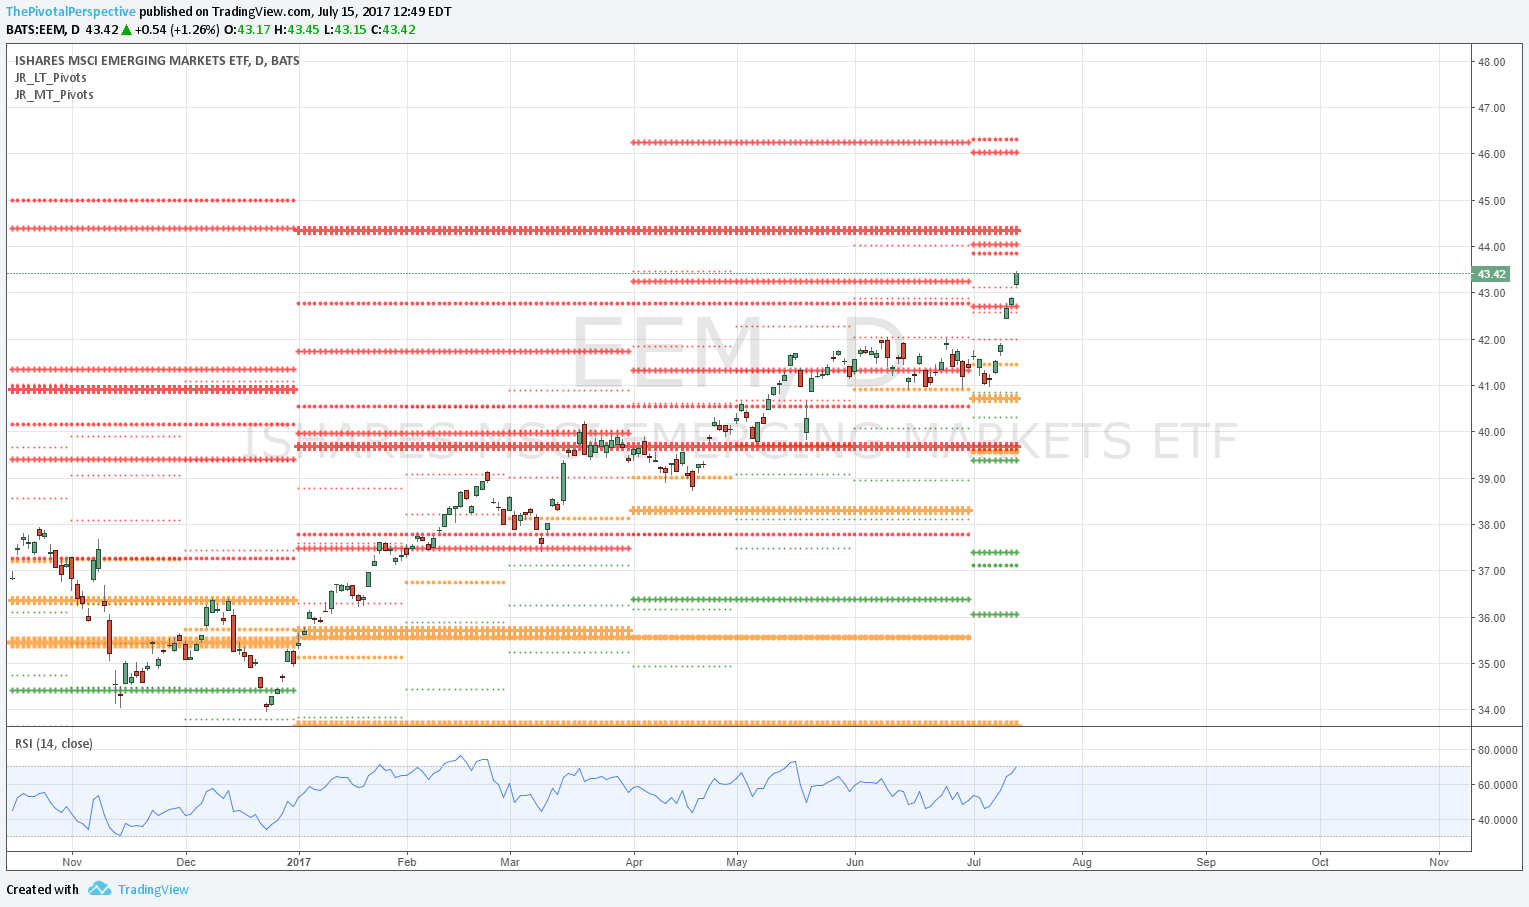
EEM
W: Another power move up. Should test 2015 highs.
D: Going for YR2, 2HR1 and Q3R2 cluster.

SHComp
OK but still in range. Less zippy.
Daily chart YP hold after 2 minor breaks was definitive.


KWEB
W: Impressive.
D: Tougher reentry setup banging against YR2.


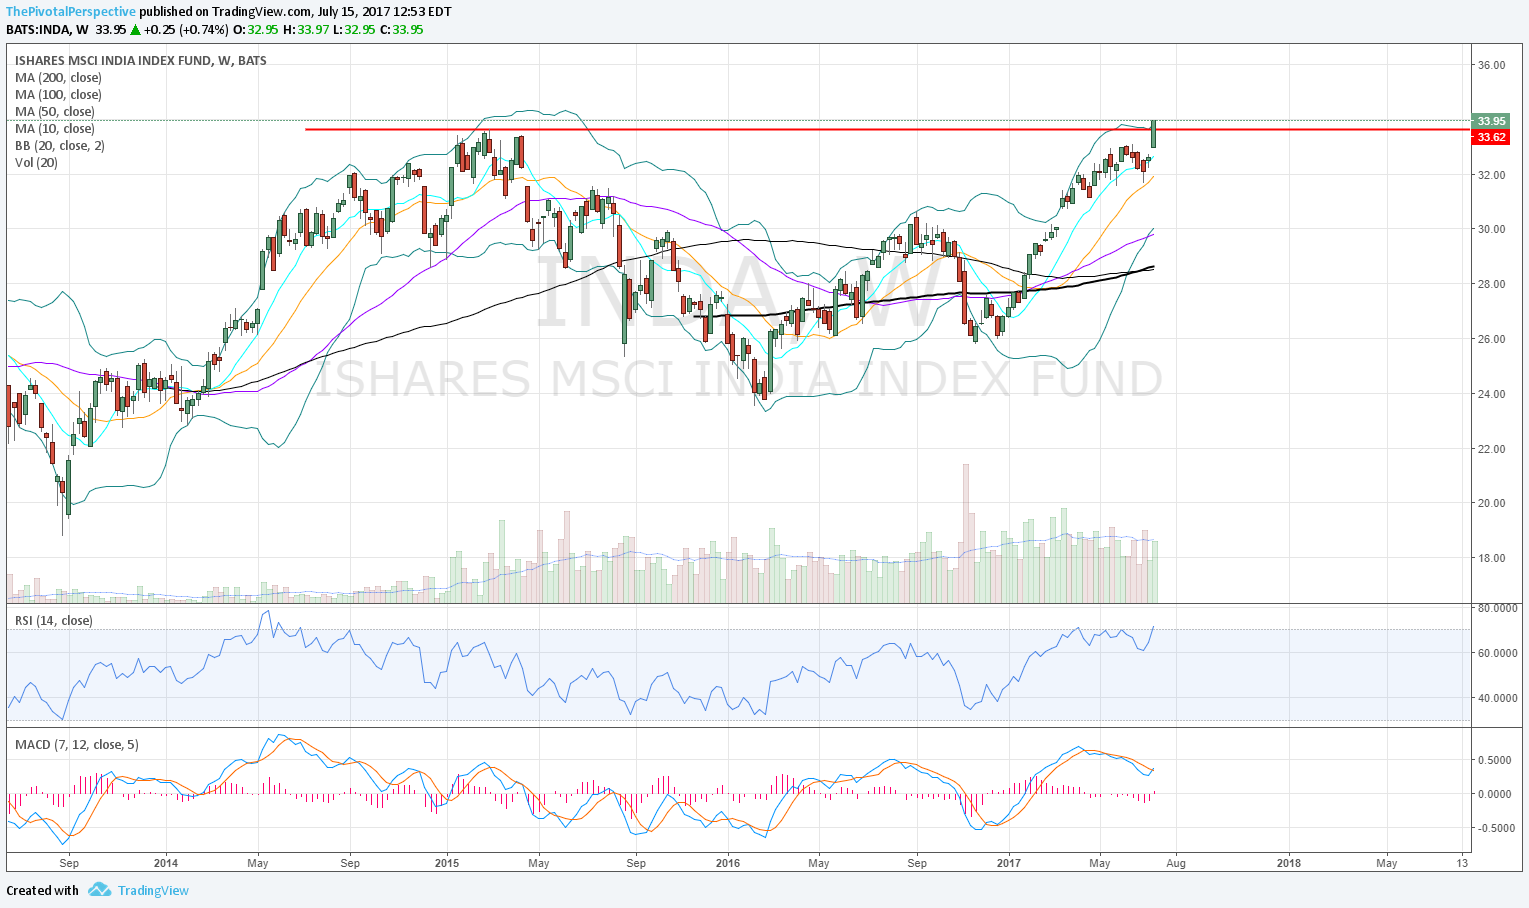
INDA
W: Going up!
D: Already at YR2!

RSX
This had a huge lift as well.
YP smart money buyers doing very well, and recently back above all pivots.


EWZ
Also back above W200 and other moving averages, but you cannot really call this an uptrend yet. About sideways for a year.
Daily chart above all pivots - made it to JulR1.

