Time limits me to tracking these 8 - it would be more thorough to do base index plus ETF & futures for each.
It is pretty striking how good most of them look. While a few are at Q4R1s, several have cleared YR2s, YR1s etc and KWEB has even cleared YR3.
EEM lifting above 2014 highs and looks ready to jet; INDA had a bit of trouble on YR2 but came right back and also is popping.
ACWI (often mirrors NYA)
W: Powering up.
W: Above YR2 from mid Sept.
D: Almost at Q4R1.
Sum: Looks like higher into year end; near term reaction from Q4R1 possible.


SHComp
W: A bear might be looking for 3000-3200 but that's not happening now. Breakout above earlier 2016-17 highs.
W: Between long term pivot levels.
D: Above all pivots, can't complain. Notice that YP test fought back in a big way in May and steadily up from there.


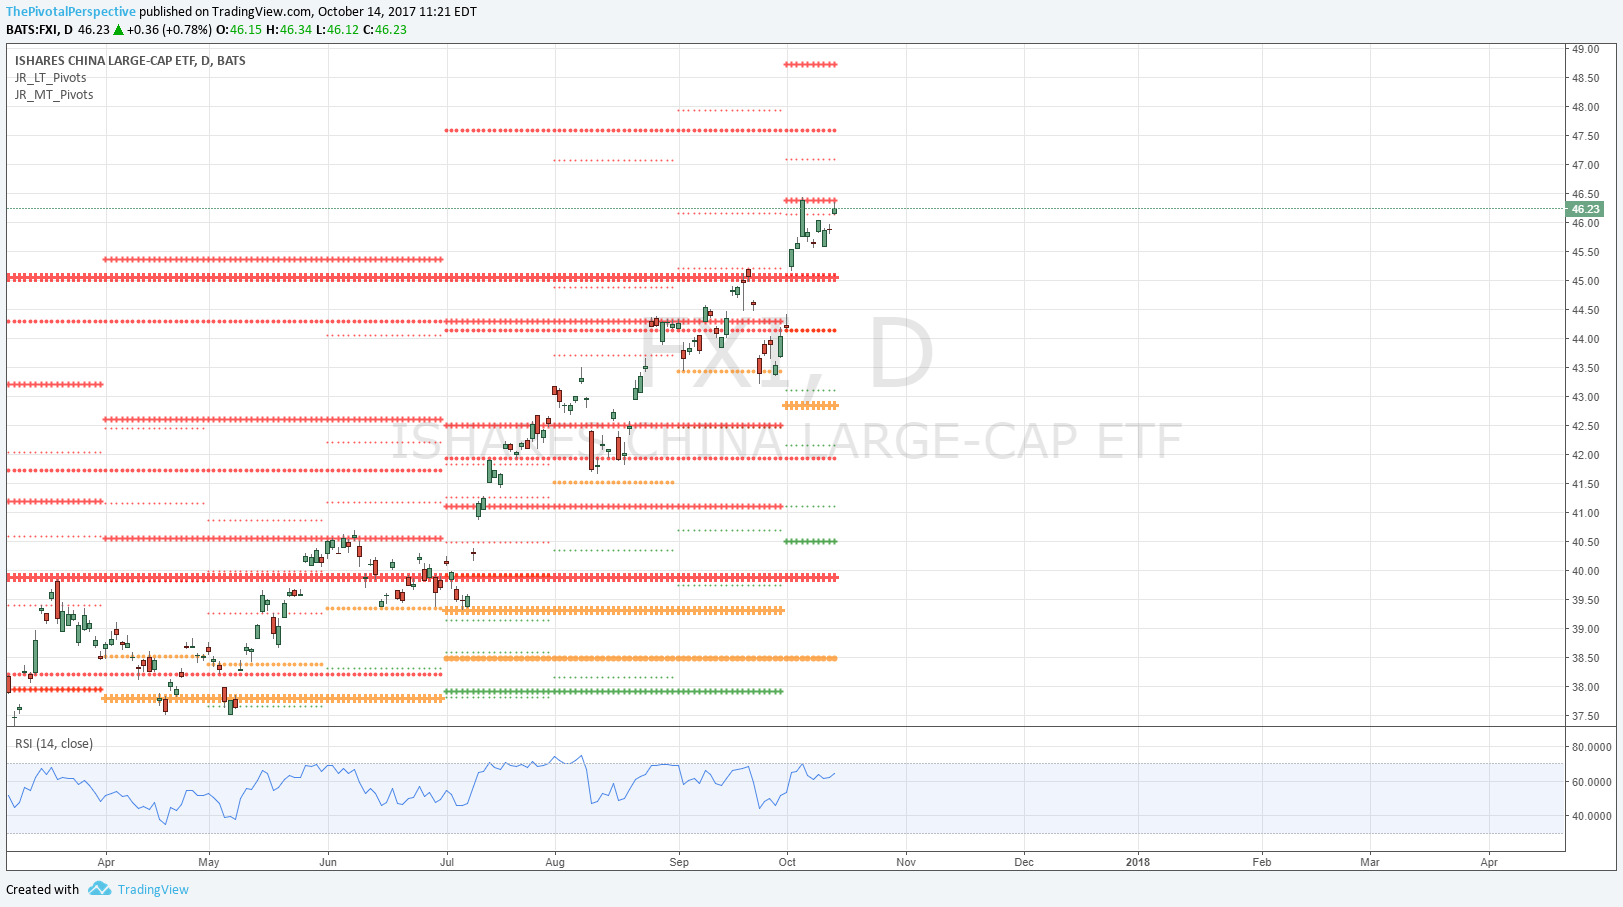
FXI
W: Powering up.
W: Above YR2
D: At Q4R1 2nd time.


KWEB
W: After 65%+ YTD this is not the place to position but still powering up above 10MA with no glaring RSI divergence.
W: Above YR3!
D: At OctR1 but this can be held above YR3 with max low Q4P.


EEM
W: Breakout above 2014H!
W: Above YR2, above 2HR2.
D: At Q4R1.


INDA
W: Raced back to highs after deeper drop.
W: Just a little higher would look great, but already a bit above 2HR1.
D: Back above YR2, testing 2HR2 & Q4R1 area. Recovery of Q4P and OctP was good buy chance if not in on Q3P earlier.


EWZ
W: Also bounced back nicely from rising 10MA.
W: Clearing YR1.
D: YR1 a few chances to turn into resistance but didn't.


RSX
W: Also lifting above prior highs.
W: Rally from YP hold is now about +20%
D: Steady up, above all pivots from 7/25 on.


