I tend to ignore Europe just because most of the time it is correlated, and then you have to factor in currency. But I like tracking other stocks because of the potential for larger percentage moves. Several of these have had huge moves both up and down in the last few years.
Sum
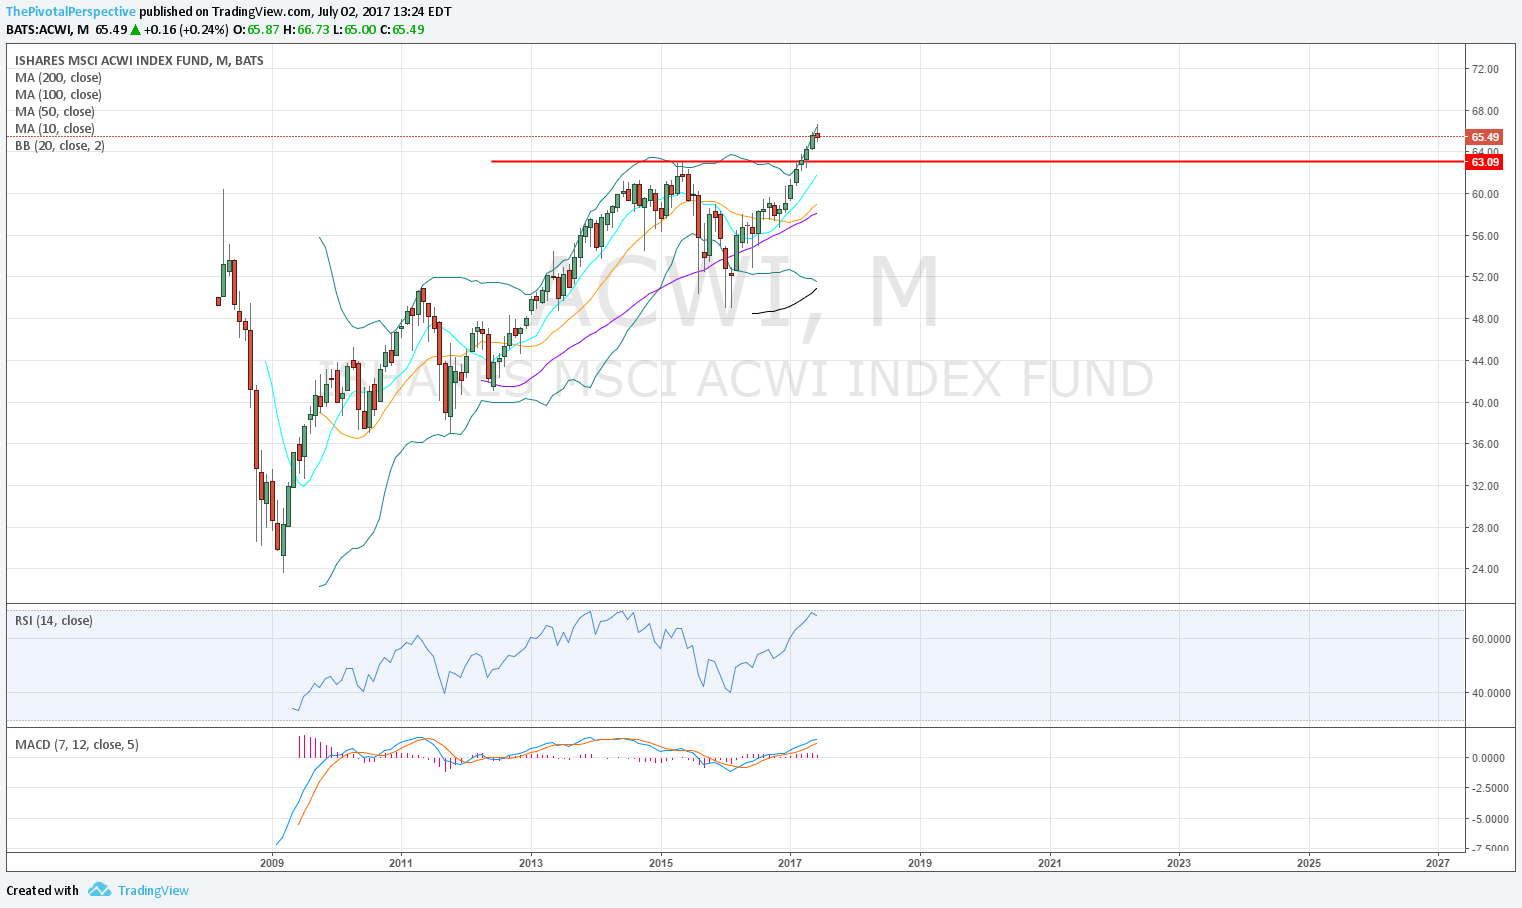
ACWI: looks fine
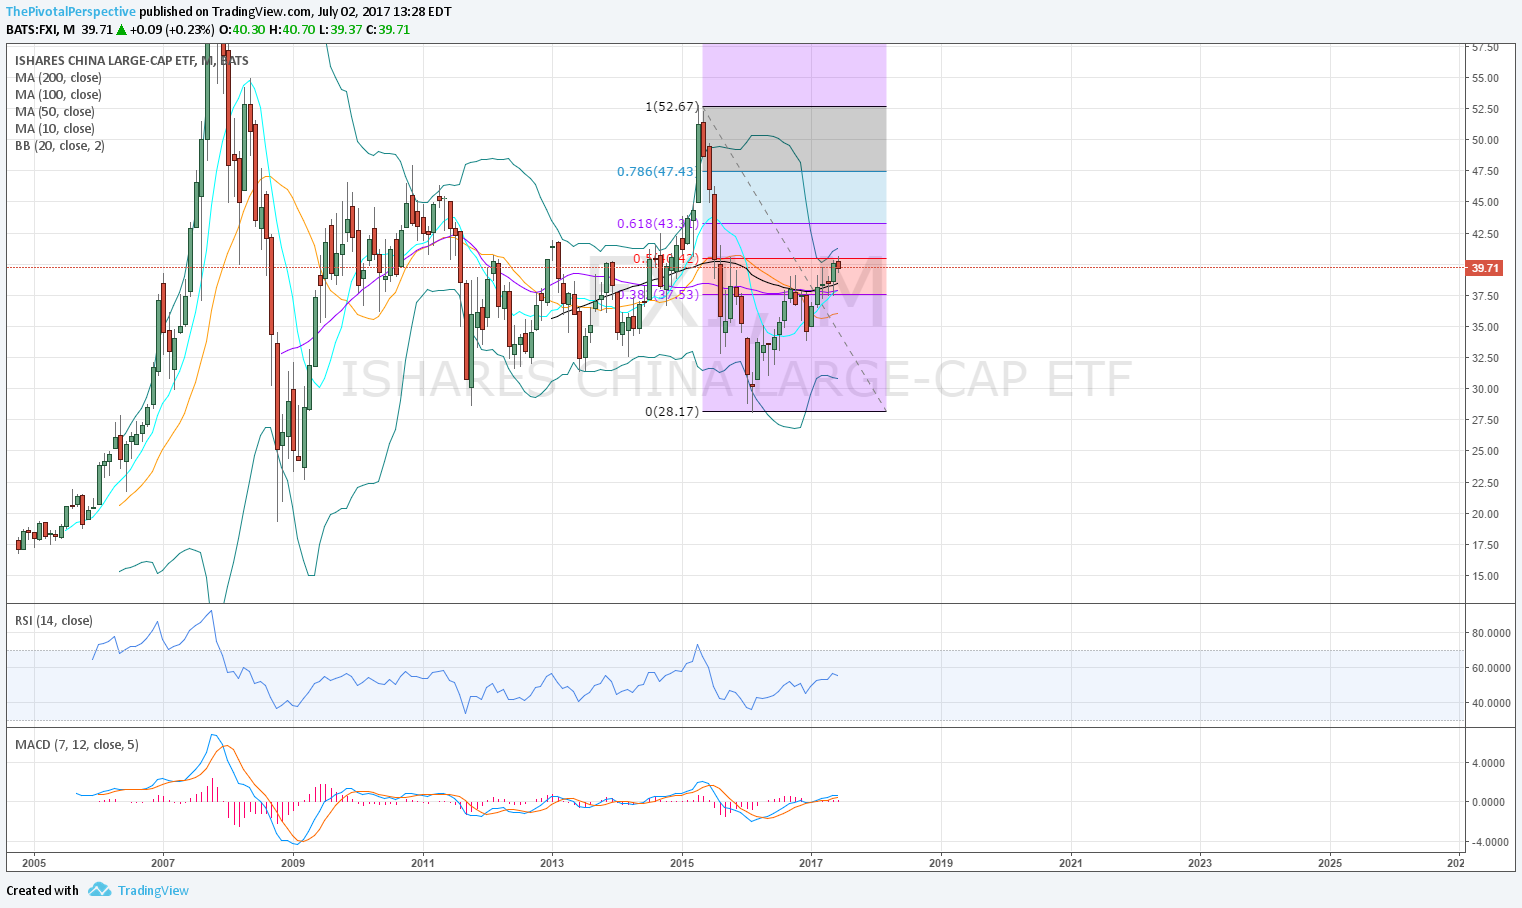
FXI: At YR1, possible hedge against EEM based on this level. Also at multi-year Fib.
EEM: Better than FXI, also at key Fib.
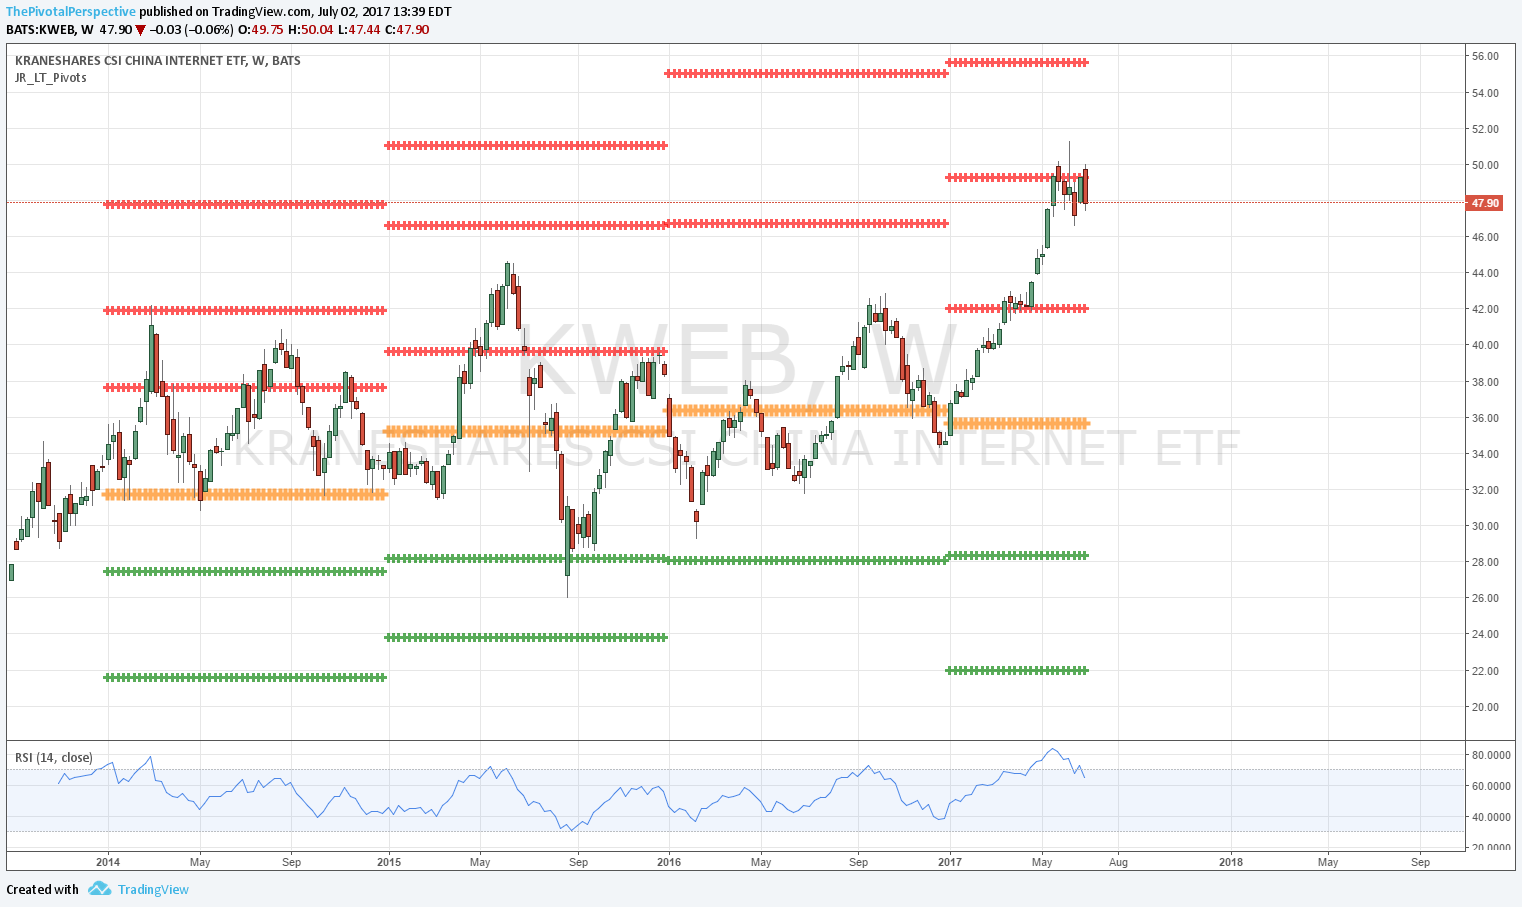
KWEB: Selling at YR2 and monthly chart vulernable to more drop. Avoid for now.
SHComp: Charts look fin.
INDA: Considering on long side again.
RSX & EWZ: Both in congestion zones on long term charts, but still above YPs. Likely better choices on long side.
ACWI (benchmark)
Q: Top of BB may have a reaction lower, but still looks like strong trend and lots of potential for up.
M: Small red bar, buyers may jump right back in. Weak selling with RSI near 70.
W: Between yearly levels.
ACWI sum: Global index idea still looks good per this benchmark.


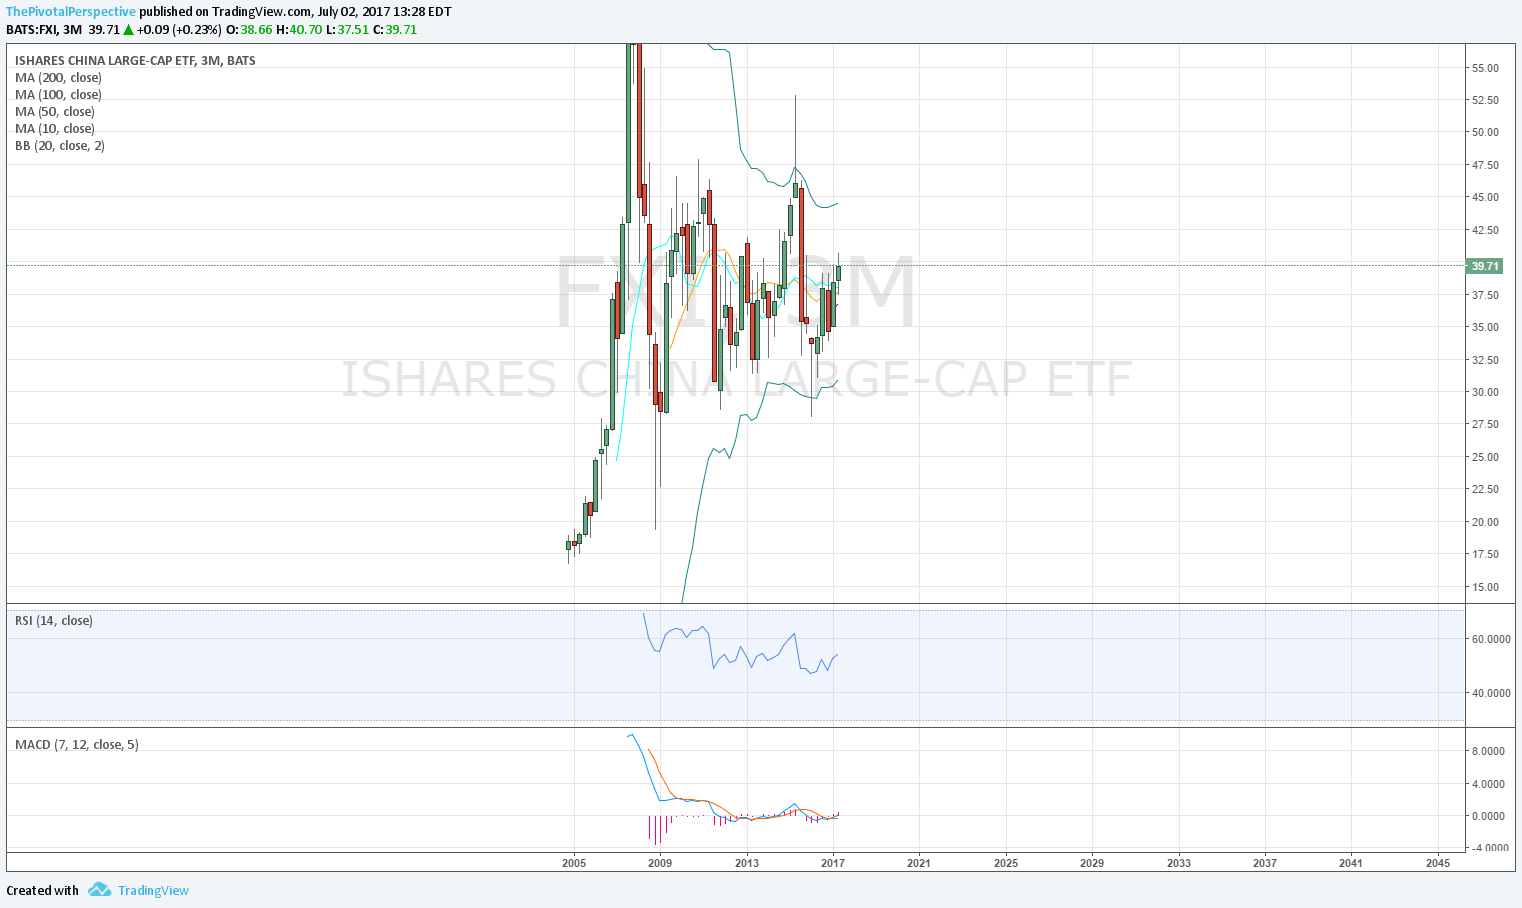
FXI
Q: Above flat-ish MAs, weaker lower high. Could go either way.
M: Not much edge on direction here but 50% of 2015 drop to 2016 low is it so far.
W: 3 weeks of selling at YR1.
FXI sum: Long term charts seem like they could go either way, but weekly pivot chart showing selling from YR1 makes this more bearish.

EEM
Q: At 61% multi year Fib!
M: Same Fib here, weak up - pullback easily possible.
W: Between levels.
EEM sum: I think still long term potential for up, and looks better than FXI. At key Fib and smaller up monthly chart is a test.


KWEB
M: A reason I locked in gains is that massive wick on monthly bar totally outside the BB.
W: Clear selling at YR2 for several weeks.
KWEB: Still look this idea - but for now this is avoid.

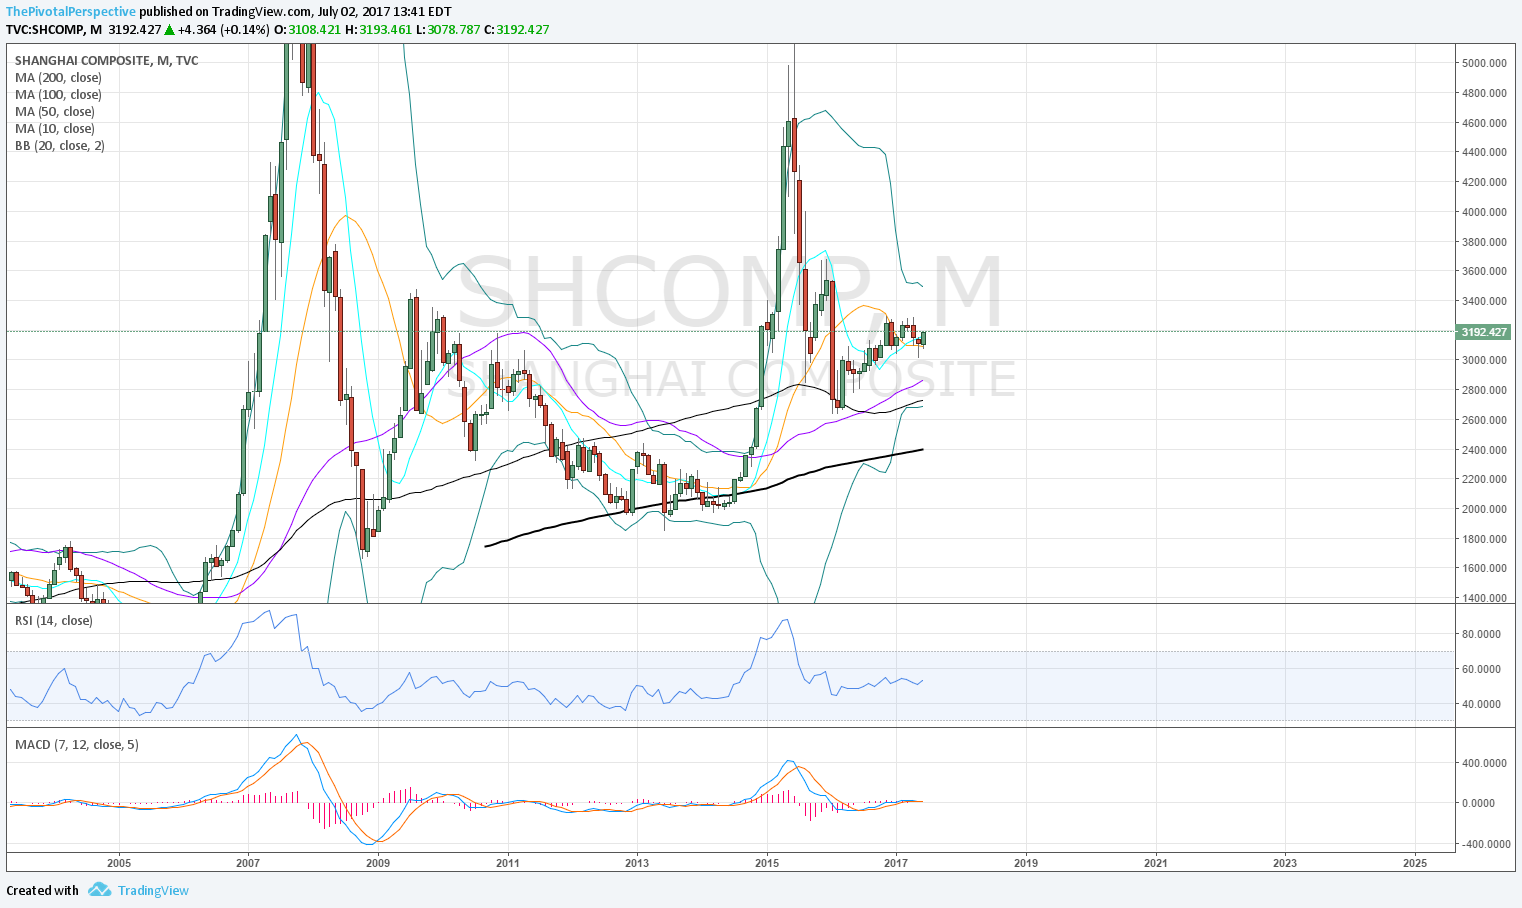
SHComp
Q: Not too bad, above all MAs except 10MA, weak selling with buyers stepping in. Could rally.
M: Room to rally.
W: YP held despite several times it could have broken.
SHComp: I don't trade this too often but charts look fine here.


INDA
Q: Currency issues seem to have prevented a new high. India indexes are much higher than 2015 tops.
M: This looks more to me like pause in uptrend rather than reversal, but needs to stay above the last month's close for this judgment to maintain.
W: Working off RSI OB in healthy fashion. Long consideration.


RSX
Q: Congestion, below falling 20, above rising 10.
M: Congestion, below falling 50, above rising 20.
W: Held the YP!
RSX sum: Probably will open below 2HP and Q3P despite bounce off YP. Congestion better to avoid until more clues on which direction is the larger move.


EWZ
Q: Below falling 20MA, above 10MA.
M: Below falling 50MA, above rising 20MA.
W: Between levels, partially due to very wide 2016 range.
EWZ sum: Not much edge here.


