Another post on my timing system. Recent post here.
At the end of each month I generate dates more likely of notice for the next month. Here are the last 3 months of those dates. Very occasionally I will add a date as the month unfolds but if I do that it is always in advance in the Total market view.
July dates first posted 6/24/2018 Total market view:
7/4 (then edited to 7/3 on 7/1 TMV)
7/10 (then edited to 7/10-11 on 7/1 TMV)
7/25
7/27 (added in 7/22 TMV with specific call for volatility spike)
August dates posted 7/29/2018 TMV
8/2
8/6-8 strong
8/17-20
8/27 added
September dates posted 8/26/2018 TMV
9/6
9/13
9/20-21
I haven’t been doing direction on these too much (as I used to do at a hedge fund) but occasionally will add things like “prefer up for risk” as I did for 9/20-21 in the 9/16 TMV, or “volatility spike” for 7/27 (both nailed btw).
So without further comment, here is a simple SPX chart with lines on all these dates. For all dates I’ll count +/- 1 as a close hit but no more; +/-2 is too wide.
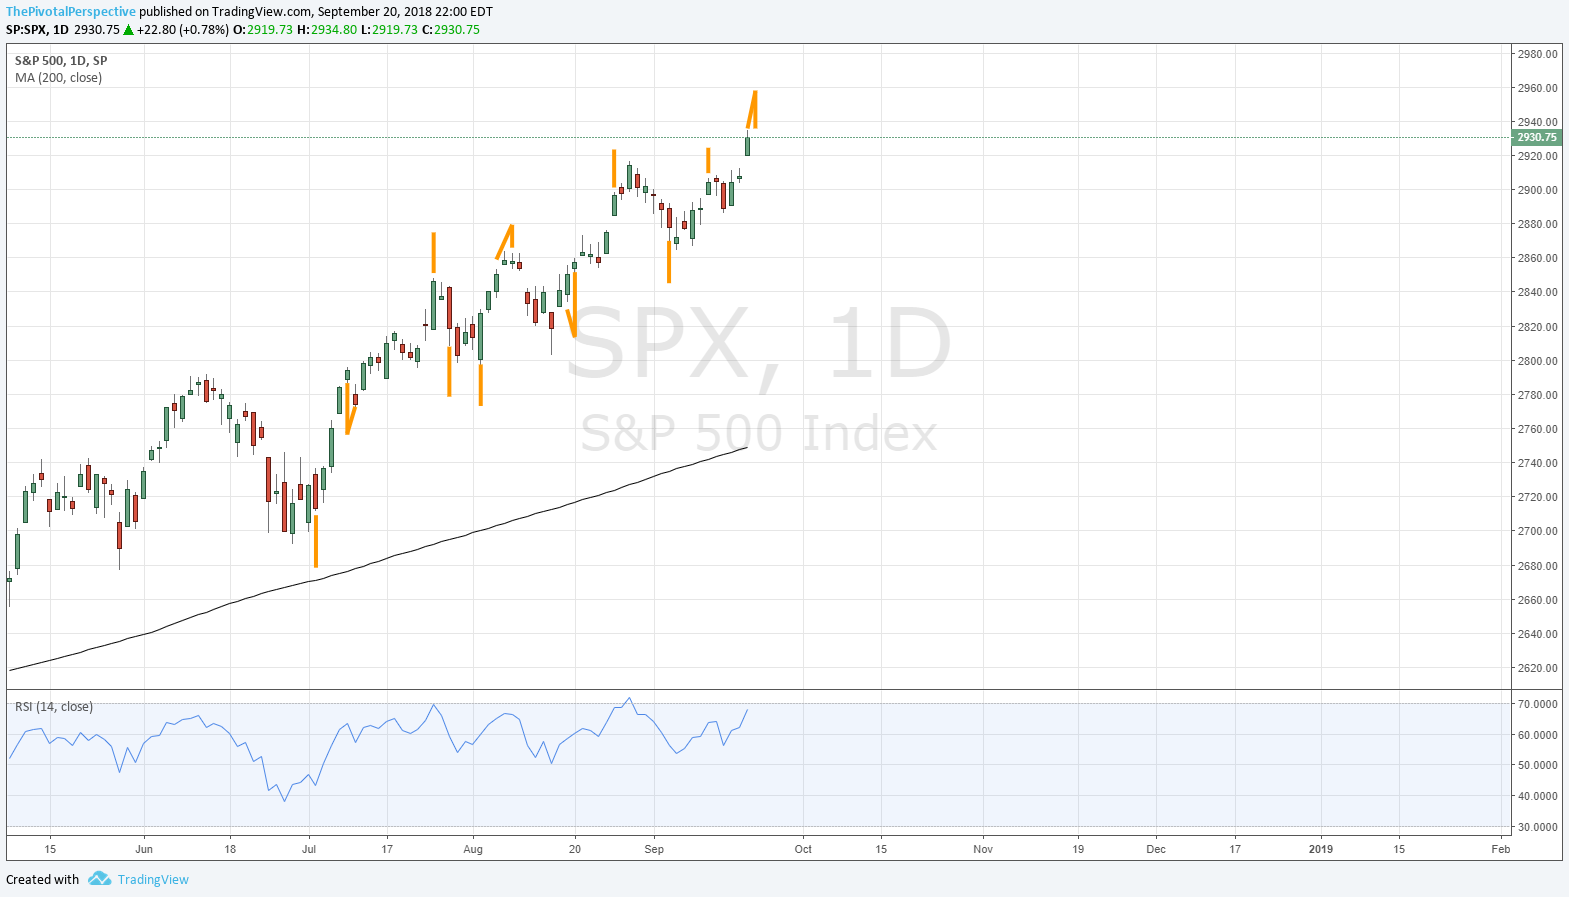
7/3, pullback low and low of month 7/2
7/10-11, pullback low 7/11
7/25, high of month
7/27, volatility spike 7/27-28 and stock pullback low 7/28
8/3, pullback low and low of month for SPX
8/6-8, trading high 8/7
8/17-20, non event
8/27, close but not quite, 8/29 key high of month
9/6, pullback low and low of month 9/7
9/13, non event
9/20-21, up for risk as called and potential trading top
All timing dates and timing model calls will go on Twitter from here…