Today I've written out a full analysis instead of posting charts. I suppose this is not quantitative for today's math & backtesting environment, but this is how I do things. All indicators are tools that translate numbers into visuals. In general these indicators are assessing trend, the potential of that trend, and the possibility of reversing that trend. Divergence is especially important to the latter and works on the idea that trends slow before reversing.
I am talking about moving averages (MAs), Bollinger bands (BBs) and Relative Strength Index (RSI). Here's a little bit more on each.
For moving averages, I use standard 10, 20, 50, 100, 200 and 400 on all charts. In MAs the first thing that matters is whether price is above or below; then the slope of that average; then some judgment of how recently or how many times it has been tested. The latter is more subjective but when I see a good example will point it out.
The next tool is Bollinger bands. Bollinger bands can get tagged often enough, and usually it is not enough to turn the market. What works especially well is divergence - this means a high in price that is outside the band, followed by a higher high in price that is inside the band. The indicator is saying that although the actual price is higher, the time and magnitude of the move is less. As with moving averages, slope matters.
Lastly relative strength index or RSI. There are several factors in RSI analysis and I've posted elsewhere in more detail. In an uptrend overbought (ie 70+) is not enough to turn the market - it is divergence that is threatening. Although when you have OB quadfecta on quarterly, monthly, weekly and daily charts that is enough to limit upside and increase risk of a drop.
Sum
In general USA main indexes (and sectors of interest) are in uptrends, above all moving averages as they have been for several quarters and months. So the issue becomes trend reversal or upside potential. It seems likely that upper bands will continue to act as some resistance for most USA mains (see notes below on SPY, DIA, IWM and VTI). QQQ is the exception, continuing to power up, but I think that becomes vulnerable to a profit-taking or re-balancing move.
Safe havens look supportive of risk assets; but I'll change my tune with TLT above both quarterly 20MA and monthly 50MA (TBD). Even so, the more broad AGG is already under these levels. GLD is slightly under its monthly 50MA as well.
I think institutions and technicals agree - global stocks are the place to be, and right now INDA is leading the pack followed by EEM. Strength in these somewhat depends on DXY weakness. I'm not sure that will continue, ie DXY looks mildly positive to me.
There are some quarters where quite a lot looks very clear like Q4 and October where quite a lot looked bearish for both TLT and GLD. I don't have very strong opinions here but key points are:
- Safe havens currently supportive of risk assets, though would not take huge moves to look more bullish (and thus bearish for stocks).
- Suspecting upside limited for USA stocks which points to range; if we see multiple USA indexes powering outside bands again i will cancel that conclusion.
- QQQ current USA main index outlier - does that continue or reverse? Last time QQQ was outlier was end of 2016, when it was clearly weaker than others; in that case catch up was bullish.
- XLF does not look so great.
- Some global stocks are running into monthly bands but in general have far more room to go higher; current favorites INDA and EEM.
- DXY stall has helped global stocks rally this year, but some up looks possible. This could be factor in hedging INDA and EEM longs.
- No opinion on oil, mixed indicators.
So here we go on quarterly (Q) and monthly (M) charts on USA main indexes, safe havens, sectors of interest, and global stocks.
SPY
Q MAs: all above, rising slopes.
M MAs: all above, rising slopes.
Q BBs: upper BB rising sharply, near tag.
M BB: outside band 2/2017, close inside band 3/1.
Q RSI: strong! 77.56, exceeded prior 2014-15 highs.
M RSI: 2nd month slightly above 70 - TBD.
SPY looks strong but potential upside resistance at the April monthly BB; also watching if monthly RSI drops back under 70 again which would be more threatening.
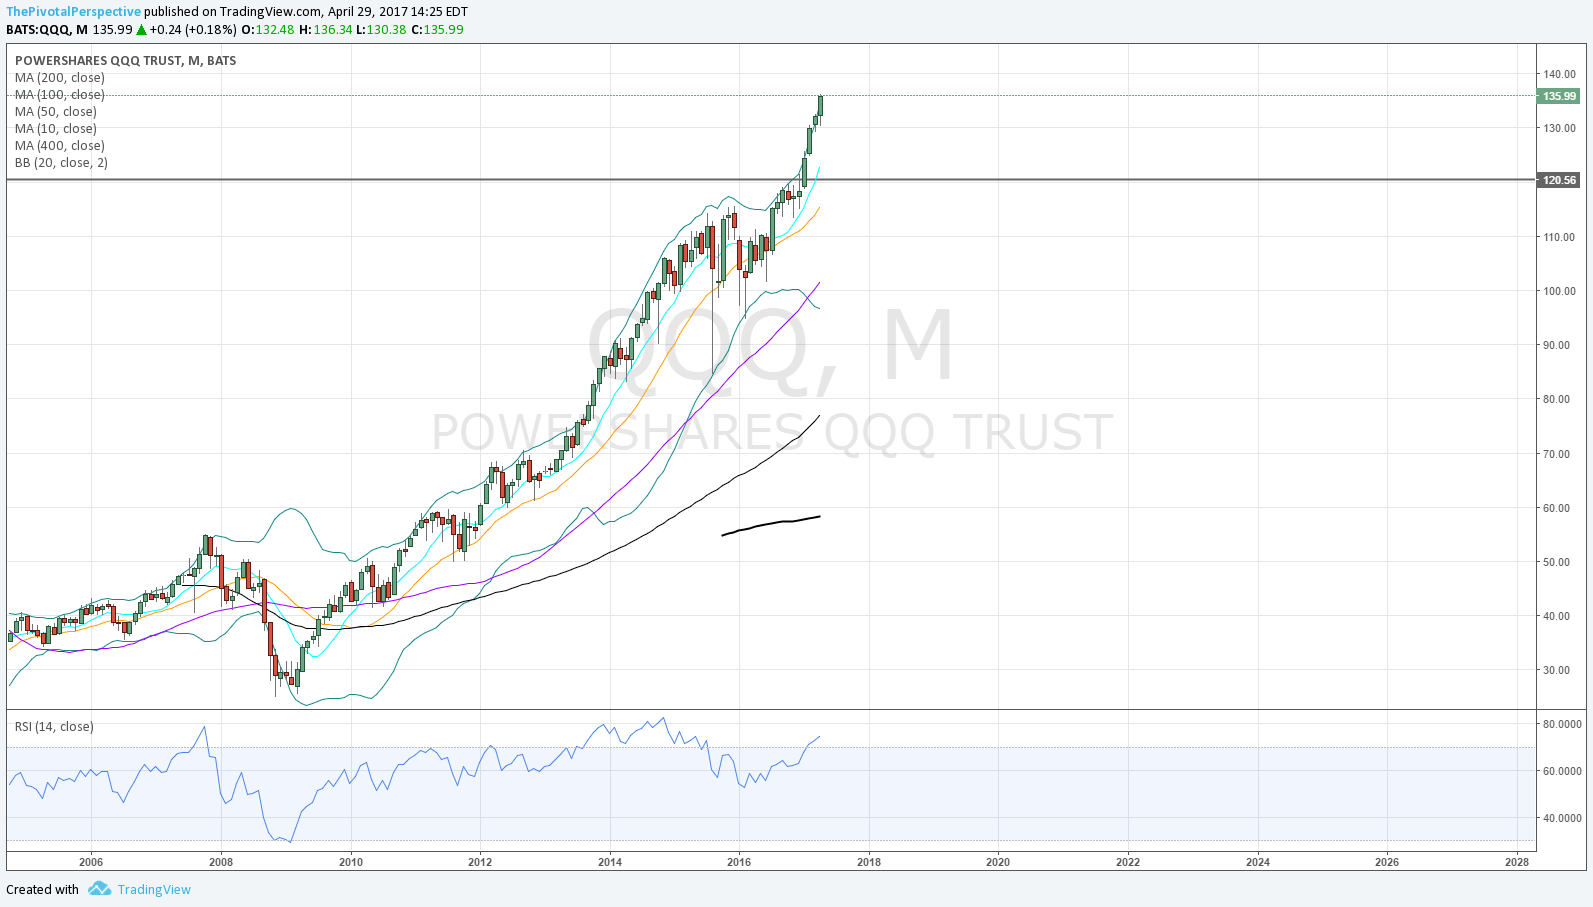
QQQ
Q MAs: +
M MAs: +
Q BB: pushing band, which will be sharply higher in Q2.
M BB: 3rd month close outside band - rare.
Q RSI: 80.7, matching 2015 highs.
M RSI: 72.6, better to stay above 70.
QQQ looks incredible here but at some point a profit taking or re-balancing move might drop price back inside the monthly BB. This cannot be ruled out for Q2.
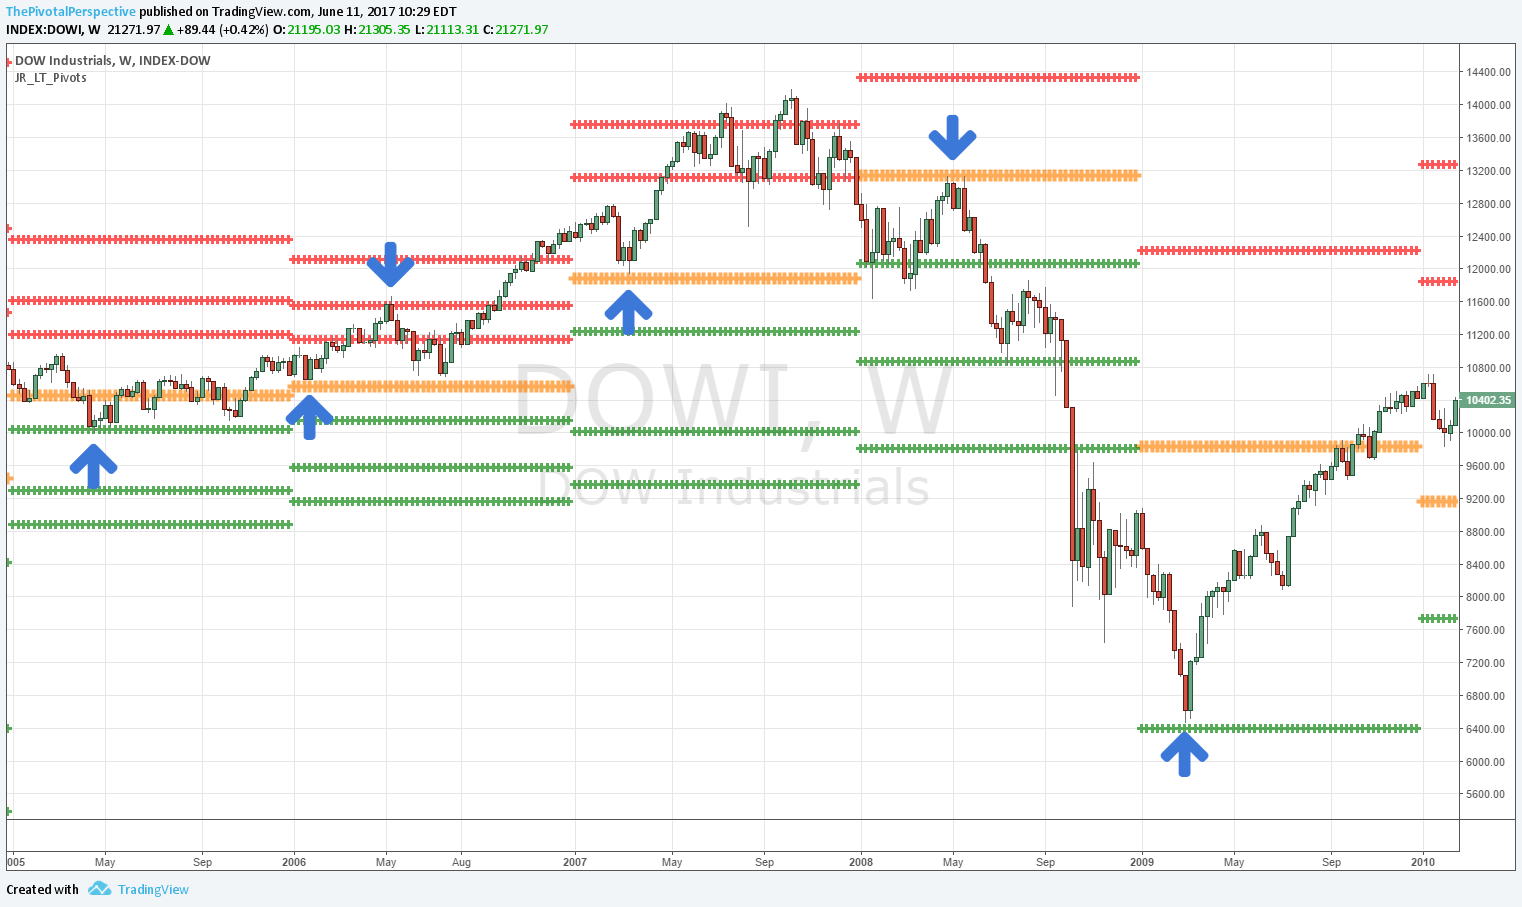
DIA
Q MAs: +
M MAs: +
Q BB: was pushing outside band and closed just inside, band higher in Q2 but likely resistance
M BB: closed outside in 2/2017, down bar inside band 3/2017, likely resistance.
Q RSI: 76.39, above 2014 highs.
M RSI: above 70 each month of 2017 thus far, to watch.
DIA issue is quarterly and monthly Bollinger band resistance. These levels will be higher in Q2 and April but still to watch.
IWM:
Q MAs: +
M MAs: +
Q BB: near tags 2016 Q4 and 2017 Q1, likely resistance.
M BB: pushing band with some resistance each month since 11/16; band near highs of month each bar of 2017.
Q RSI: at 70, alert for selling - not above 2014-15 highs.
M RSI: 66, not overbought like other.
IWM has had highs near its monthly Bollinger band each month this year and unable to push outside it like each other USA main index (SPY, QQQ, DIA, VTI). In this sense it is relatively weaker. But does that mean leading down or catch up higher?
VTI
Like SPY in nearly all respects but monthly RSI right on 70 makes it more inviting for selling.
*
Safe havens
TLT
Q MAs: broke 10MA in 16Q4 after closing above each bar since 14Q3. Q20MA testing; more bearish for TLT if below that, potentially bullish above.
M MAs: below 10, 20 and 50MA. 50MA has leveled off after climbing most of this decade. 2/2017 managed to lift above but level looks like resistance 3 of last 4 bars. Below 50MA means visit to 100MA currently 113 and climbing.
Q BB: Overshoot and drop back inside was part of the top and drop last year.
M BB: We will probably see visit to lower band, adds to downside view.
Q RSI: Less likely to reach extremes compared to stocks.
M RSI: RSI divergence at the top; no buyers at 50 area.
TLT is testing its quarterly 20MA which is near enough to its monthly 50MA. If these levels act as resistance then things are more bearish for TLT.
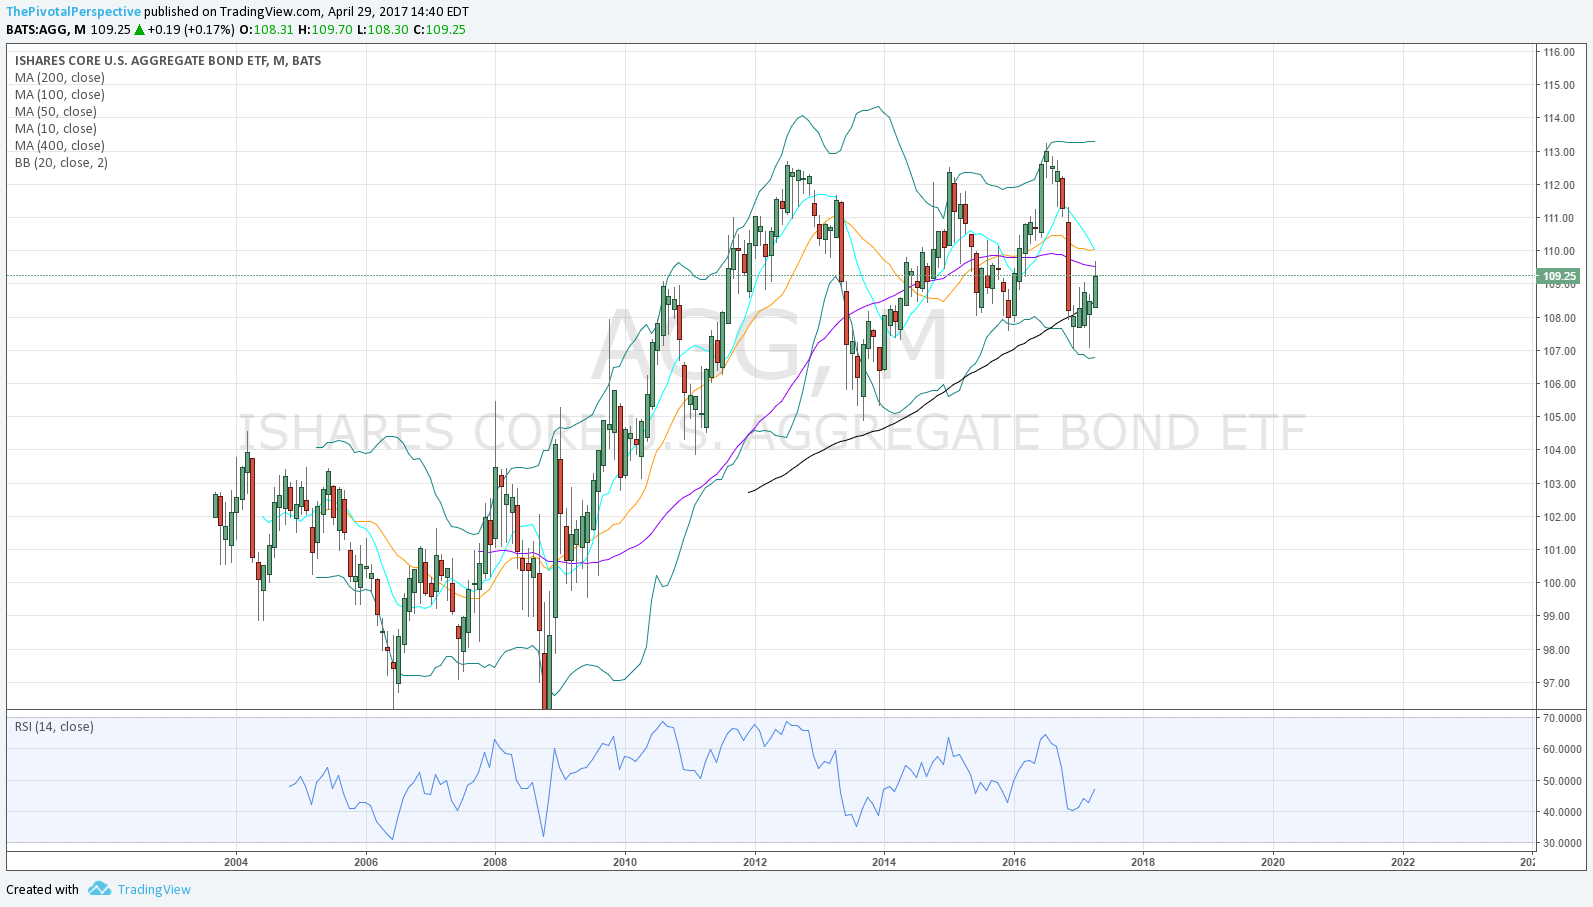
AGG
Q MA: below 10 and 20.
M MA: under 50 since 11/16. 100MA not support.
Q BB: part of 2016 high
M BB: part of 12/2016 low and recent test
Q RSI: like TLT, less likely to reach extremes
M RSI: less likely to see extremes
AGG has stopped going down the last 4 months, but bounce has been weak and think limited upside or down more likely.
GLD
Q MAs: reclaimed 10 but with negative slope, below sharply falling 20 which was resistance at 2016Q3 highs.
M MAs: below 10, above 20, below falling 50, below 100. congestion area but leaning bearish.
Q BB: not tagged since 2012 Q1 divergence high test.
M BB: part of 2016 highs 6-8/2016.
Q RSI: last extreme 2011.
M RSI: last extreme 2011.
GLD will look better if above monthly 10 & 50MAs, currently just below.
VIX
Q MAs: below all, bullish for stocks.
M MAs: below all, bullish for stocks.
Q BB: tagged on lows what appears to be first time ever 2017Q1; potential reversal.
M BB: not tagged since 6/2016 highs and 7/2014 lows.
Q RSI: like TLT, not as likely to reach extremes compared to stock indexes.
M RSI: even less likely to reach extremes.
XIV
Q MAs: +
M MAs: +
Q BB: insane strong.
M BB: outside band for last 3 months.
Q RSI: not really enough price history for decent judgment; currently 73 better than 70.
M RSI: matching 6/2014 highs which was not the high, but near a key top.
VIX and XIV still both supportive of risk assets. VIX Q BB tag and XIV 3 months outside monthly BB both show possibility of turn, but this is where pivots come in for fine tuning.
*
Sectors of interest
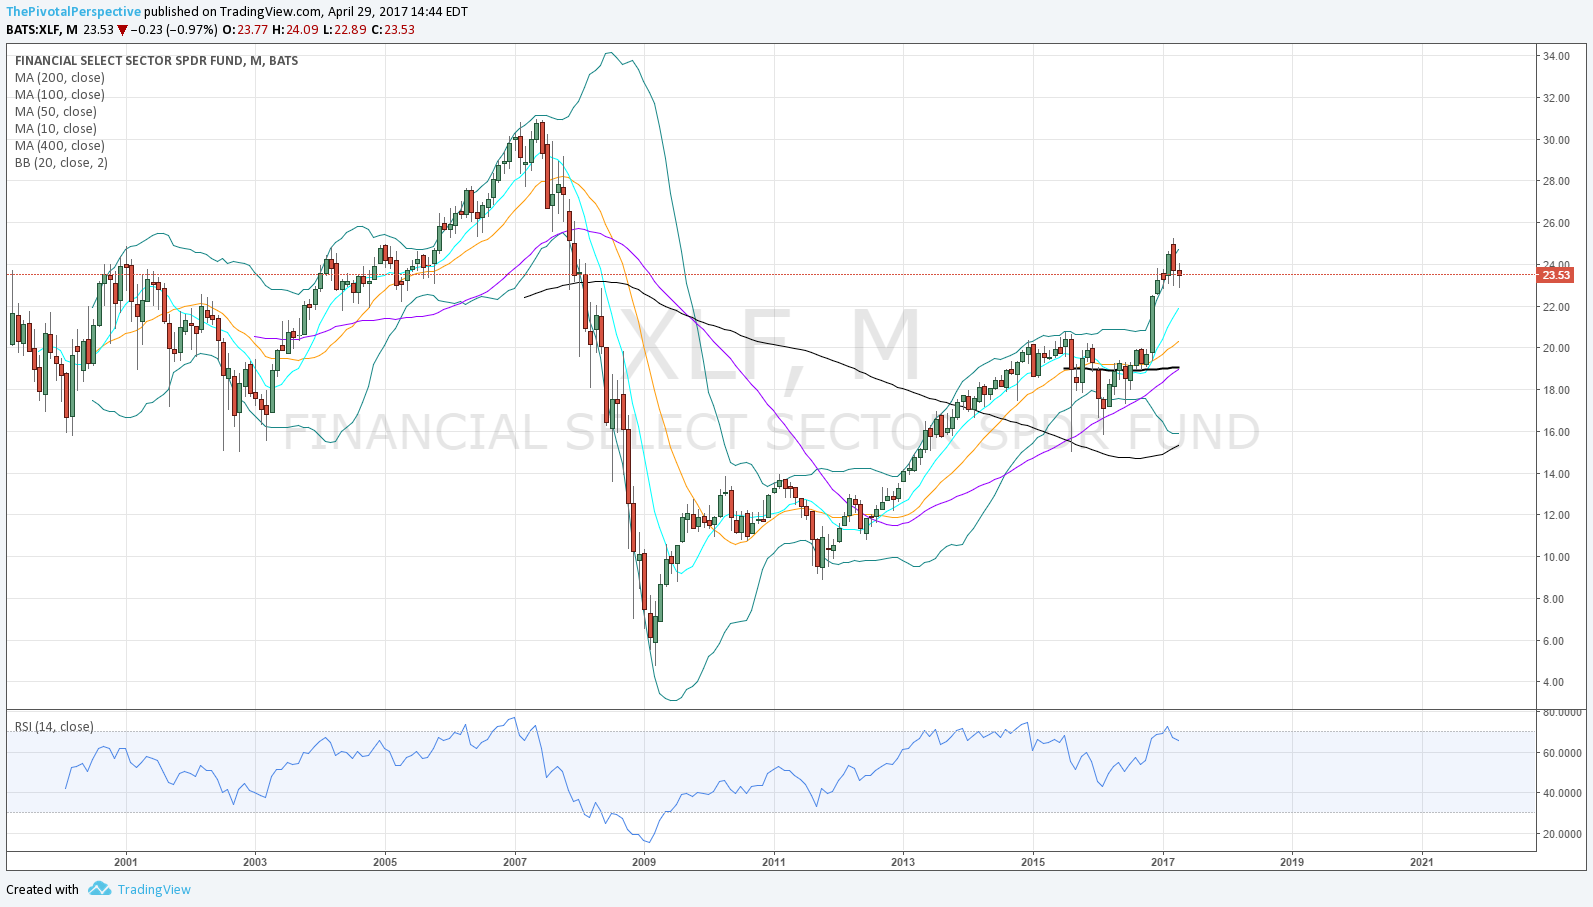
XLF
Q MAs: +
M MAs: +
Q BB: poke outside but close inside bad, possible reversal or at least resistance.
M BB: outside band 11/16 to 2/17, fell back inside 3/17, likely resistance.
Q RSI: nearing 2006 highs.
M RSI: reached 72 2/17, now 67.2, bearish.
Have to say Wall Streets favorite 2017 sector does not look so hot right now on Q and M Bollinger bands and Q and M RSIs. I don't know if this is a clue that TLT could rally.
SMH
Q MAs: +
M MAs: +
Q BB: outside band 16Q3 and 17Q1.
M BB: pushing band higher without exceeding last 6 months.
Q RSI: 80.
M RSI: 78, nearly matching 2014 highs.
SMH continuing to power up.
*
Global stocks
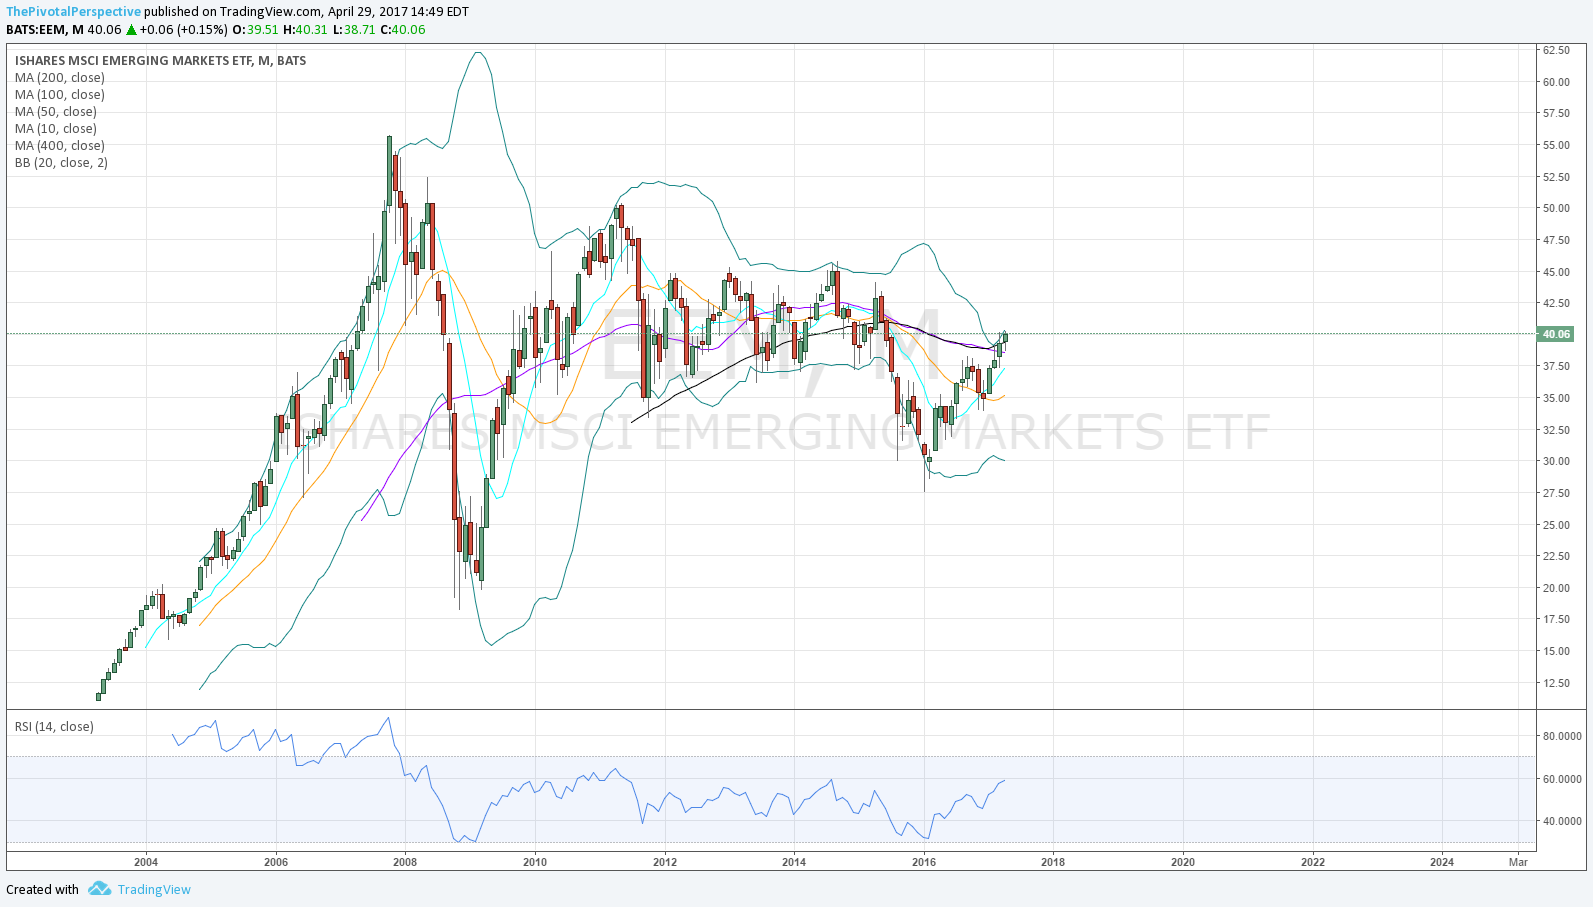
EEM
Q MAs: First close above 20MA since 2014Q2; although 20MA slightly negative slope, this is likely bullish development.
M MAs: Above all, just cleared 50 and 100 MA.
Q BB: Overshoot and recovery 2015-16 lows.
M BB: Pushing upper band, possible resistance.
Q RSI: Nowhere near extreme.
M RSI: Low of 31.75 2/2016 lows, plenty of room for up.
Although resistance at upper monthly BB possible, seems like EEM a lot of upside potential.
FXI
Q MAs: Close above 10 and 20MA first time since 2015Q2.
M MAs: Just a bit above 50 and 100.
Q BB: Part of 2016 lows.
M BB: At monthly upper band but downward slope more likely to act as resistance.
Q RSI: Nowhere near extreme.
M RSI: like EEM.
Similar to EEM, but EEM has slight edge on monthly MAs and BBs. Some of this was reason for FXI hedge against EEM long.
SHComp
Q MAs: above most, below 10MA, rising slopes.
M MAs: above all, but 20MA falling slope, could break.
Q BB: last tagged 2015 highs.
M BB: last tagged 2015 highs, sharply falling upper band likely resistance.
Q RSI: last extreme 2015 highs.
M RSI: 2015 highs all the way to 88, could have dull action for a while.
I think at some point we will see another leg down in this index, but no idea when. Creeper range could continue for 1-2 years more.
INDA
Q MAs: +
M MAs: +
Q BB: +
M BB: 1 bar outside 3/17
Q RSI: room to go up
M RSI: room to go up
INDA overshoot of monthly band but considering run XLF and IWM had and QQQ in process (3-4 months outside band) think this is not a huge concern.
RSX
Q MAs: above 10, below falling 20MA which was the 2017 high thus far.
M MAs: above 10 & 20, 50MA resistance last 2 bars.
Q BB: part of 2016 low.
M BB: upper band overshoot & resistance 12/16-2/17 highs.
Q RSI: not a consideration.
M RSI: nowhere near extreme.
RSX would look better above M50MA.
EWZ
Q MAs: falling 20MA resistance.
M MAs: testing 50MA.
Q BB: not a concern.
M BB: near tag on 2/17 highs.
Q RSI: not a factor.
M RSI: not a factor.
Close call, better above M50MA.
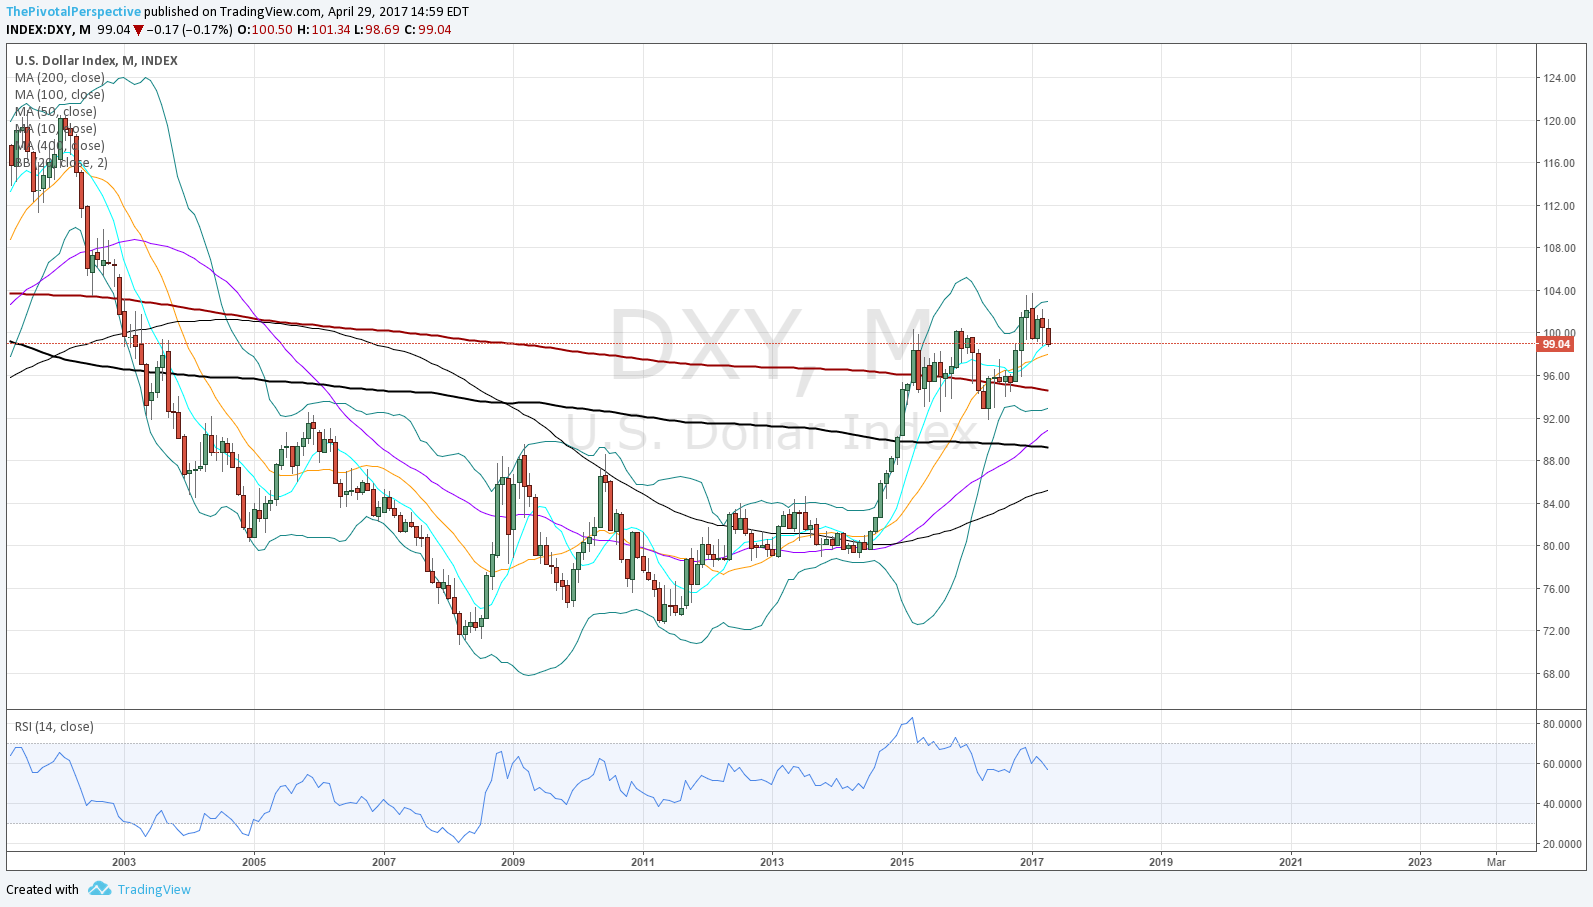
DXY
Q MAs: +
M MAs: tagged rising 10MA 3/17 which held as support.
Q BB: divergence high 2016 Q4 part of weakness 2017 Q1.
M BB: overshoot and drop part of 11/16-1/17 high; possible resistance.
Q RSI: 2016 Q4 high 67.9 could have gone higher but didn't.
M RSI: divergence high 12/16.
DXY looks to be supported but at the same time upside limited to upper band currently 102.82 and not much higher for April. DXY sideways or down will support global stocks but have to say some rally looks doable here.