Sum
Clear bearish action last week, with SPY, DIA and NYA/VTI all breaking Q2Ps with several variations having the "look of rejection." IWM had the 2nd rejection of Q2P, and already not far from Q2S1. USA leader QQQ dropped under its AprP but well above Q2P.
ES futures and DIA are close enough to levels for recovery, so we'll see what happens. If lower then levels to watch are AprS1s and IWM Q2S1.
Charts
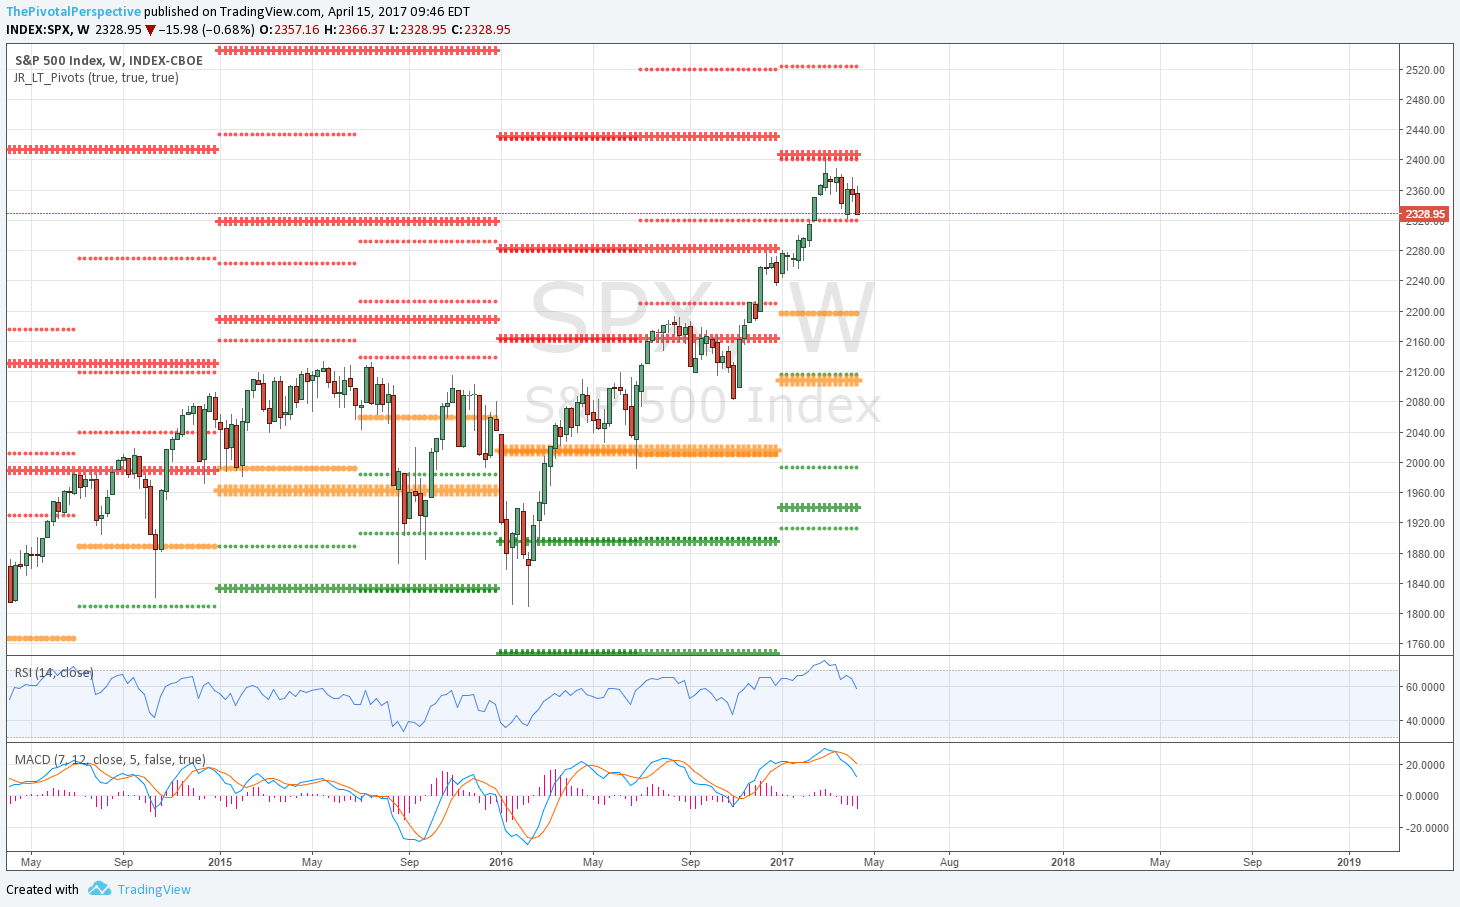
Cash index weekly charts with long term levels only
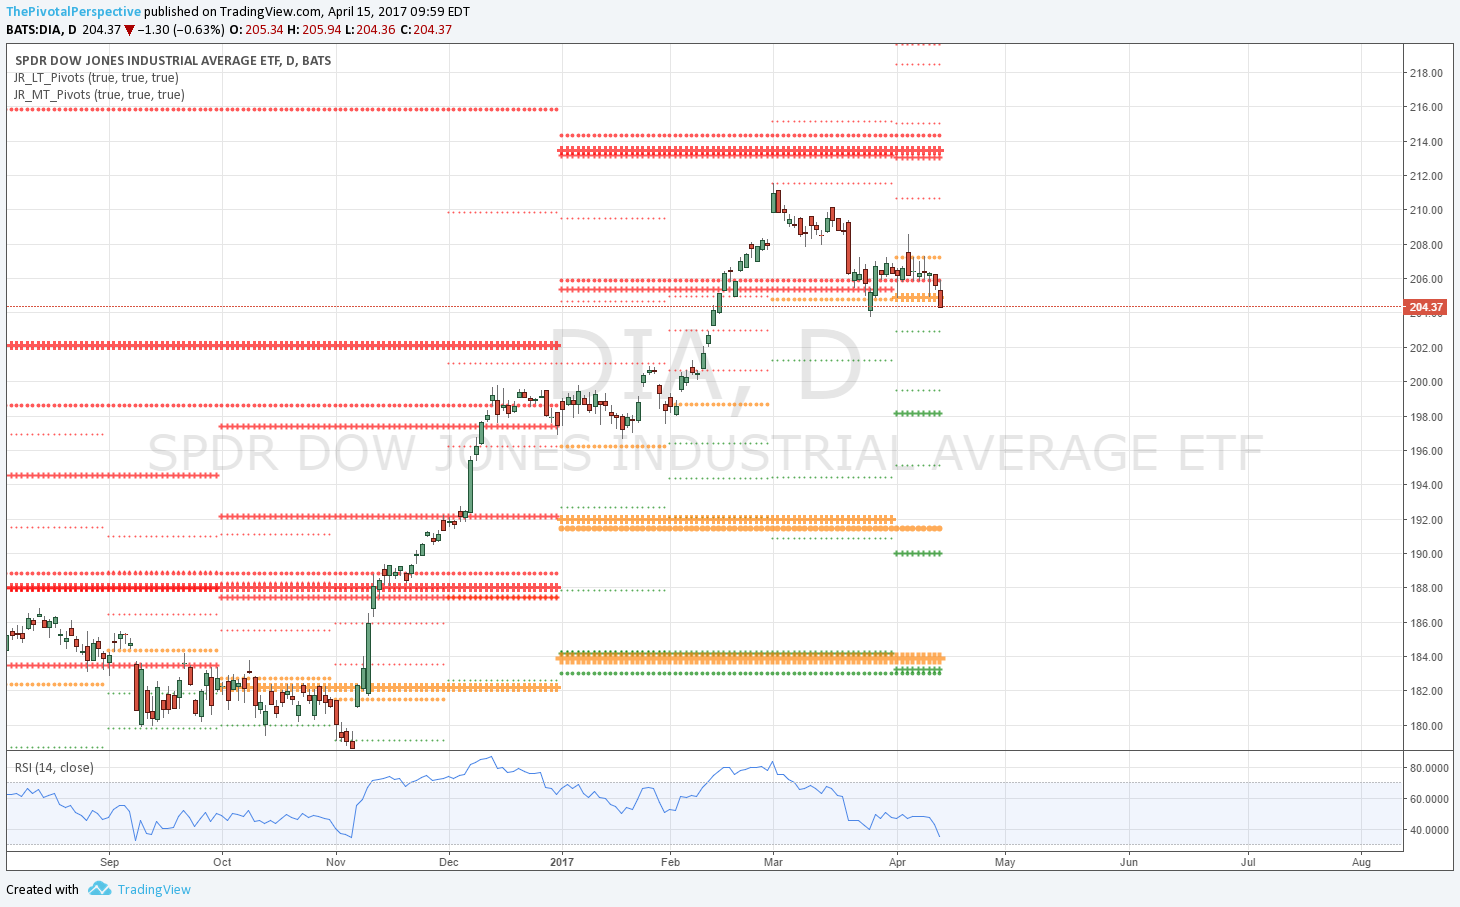
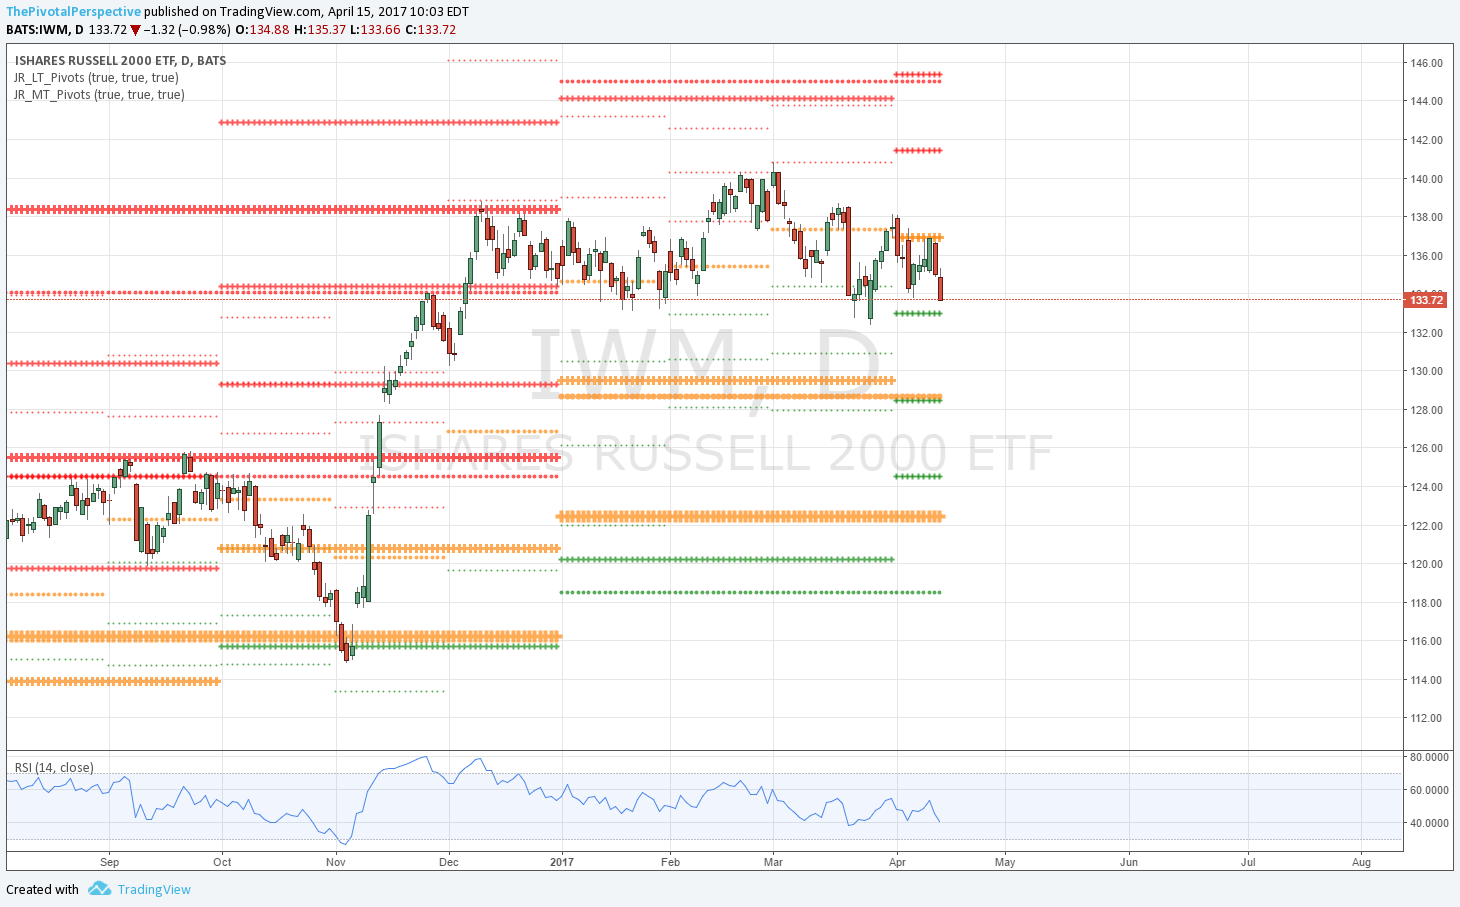
Daily ETF chart with long term & medium term pivots
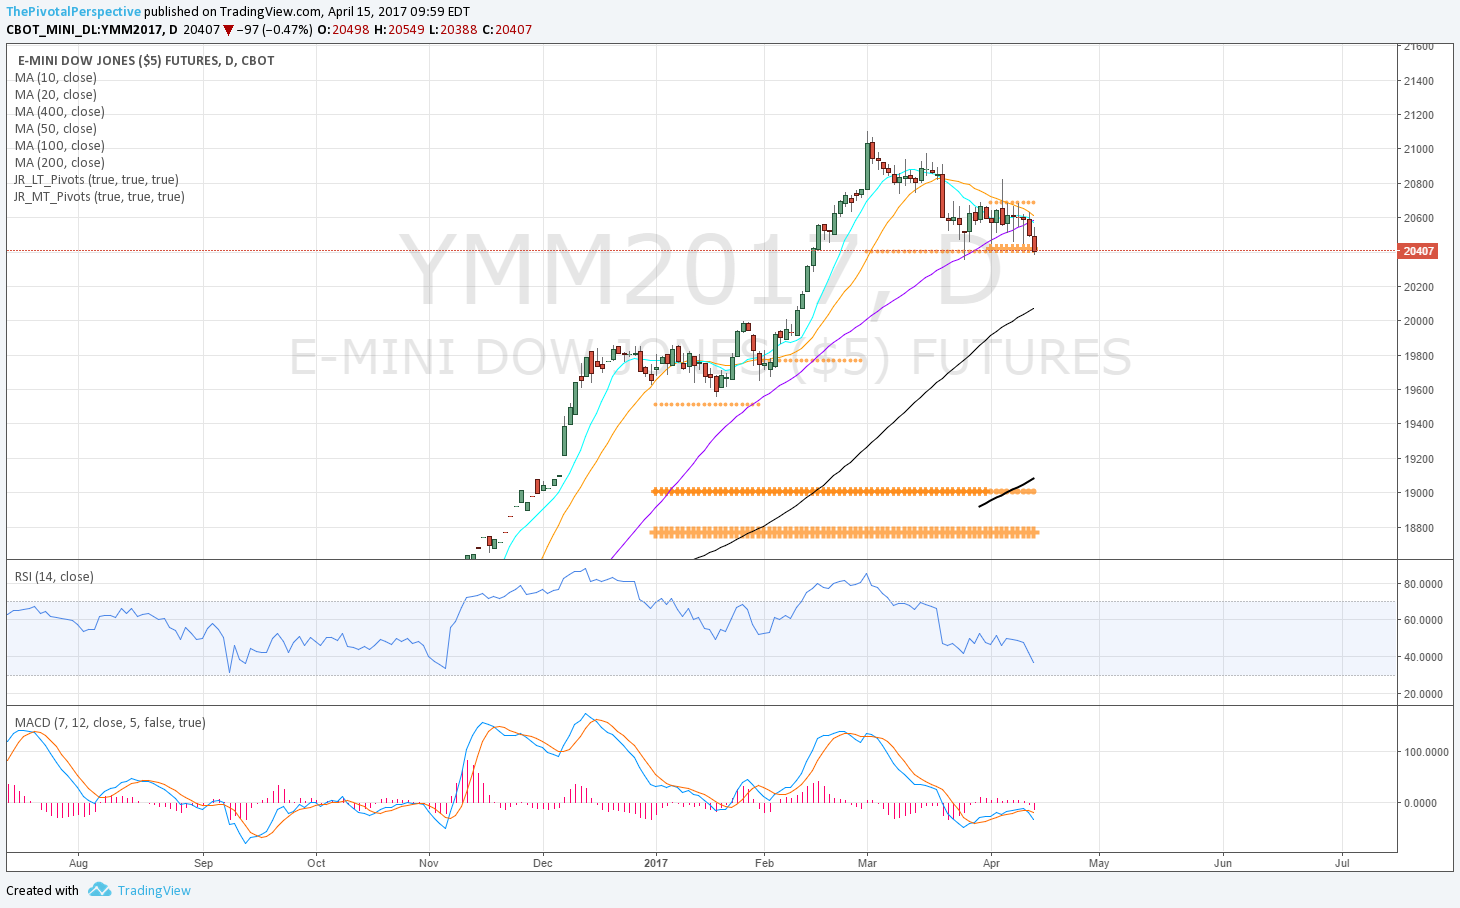
Futures current contract pivots only (no S/R) and MAs for clarity of entries (now June 17 M)
Futures "1" continuous contract with the works
SPX / SPY / ESM / ES1
SPX has held 1HR1 as support once, but the main move here is rejection from YR1 / 1HR2 area.
SPY broke Q2P, the first time below a quarterly pivot since last November. Potential support at AprS1 not far.
ESM level is structurally lower and looks more like fractional break; this could recover.
ES1 similar.
SPX set sum - rejection from SPX YR1 continues. All 4 variants broke Q2P last week, with the futures only by a few points.


NDX / QQQ / NQM / NQ1
NDX weekly dropping back under 1HR2; YR1 can now act as support.
QQQ just a few days under AprP and already near AprS1. Q2P would be a nice buy setup.
NQM still above rising D50MA which could help a bounce.
NQ1 is only sideways since March, healthy digestion of overbought conditions.
NDX set sum - USA leader well above Q2P, which would be great buy setup should we see that level. Also above rising D50MA.


INDU / DIA / YMM / YM1
INDU failed to reach YR1 area, and now has broken 1HR1.
DIA slight break of Q2P but maybe able to recover.
Both YM charts similar.


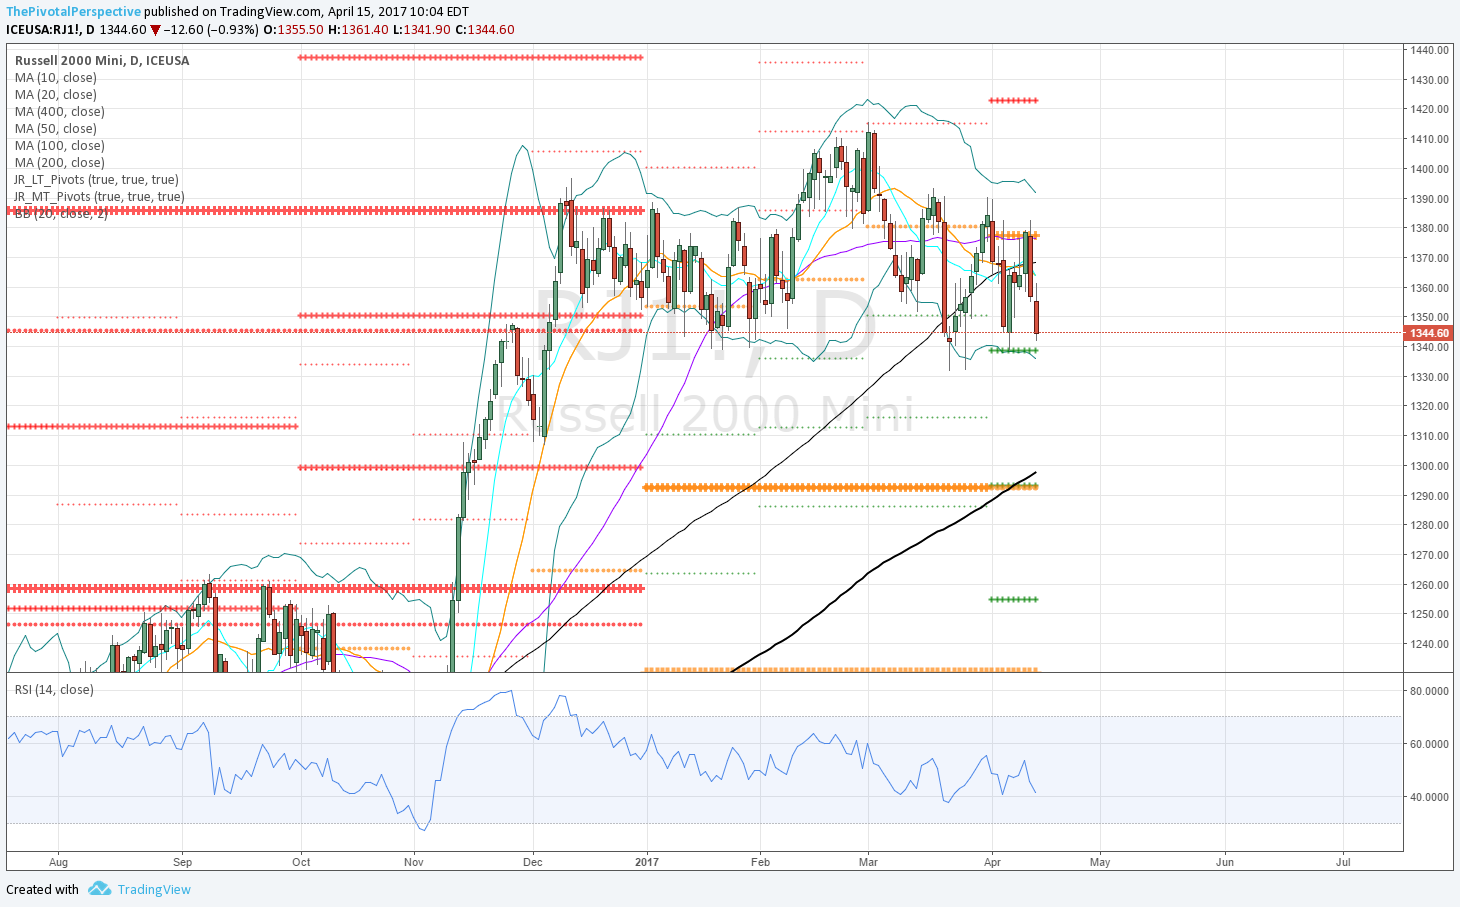
RUT / IWM / RJM / RJ1
Weekly chart far away from any long term level.
Daily chart 2nd rejection of Q2P, but already near Q2S1.
Daily chart 50MA leveled off for a while before the Q2P break.
Futures charts similar to IWM.


NYA / VTI
NYA break of 1HR1, and daily chart rejection of Q2P.
VTI similar.


