This post is important for the indicators that were present on a stock top that lasted about 2 years, the Dow top in 1956. Unlike others, this was not a huge top in the scheme of things, but this is exactly what it catches my interest.
This somewhat stymies my theory of quarterly chart RSI extreme - 1955 Q3 88.7, Q4 89.8, 1956 Q1 90.8. This is pretty close to 1929 levels, but instead of -89% all that happened was a -20% over 2 years and again off to races.

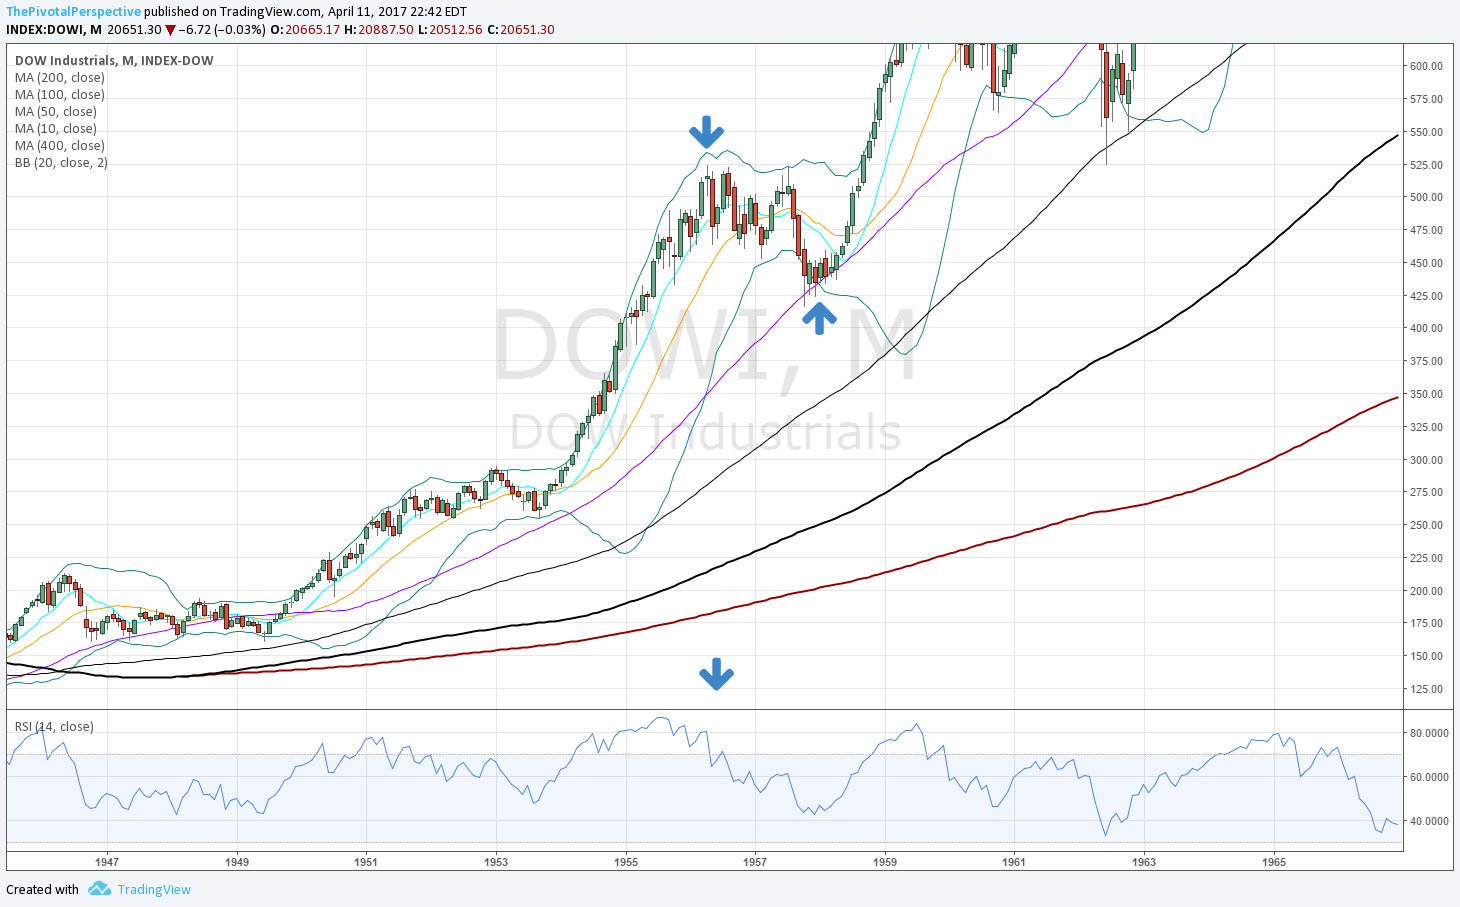
At least the monthly chart was nice enough to put in small doji-like top bar inside the Bollinger band, and then glaring RSI divergence on the high test before the pullback. But looking ahead, monthly chart handed investors the ideal buy at the multi-month hold of the rising 50MA.
The weekly long term pivots chart has a double top on YR1 in 1956 and the low on YS2 in 1957.

Sum - Sometimes everything is set up for a massive top, but all that happens is -20% over 2 years and frantic bull rally resumes.