Everyone who looks at charts knows how the 2000 and 2007 tops unfolded. Most people conclude from these tops that a period of distribution, waning momentum and RSI divergence will occur before any top of significance.
I thought it would be interesting to look at other tops to see if the conclusions most people typically reach by emphasizing the technical structure of the 2000 and 2007 tops is correct. I will approach each through standard charts (typical moving averages, RSI and Bollinger bands) and pivots.
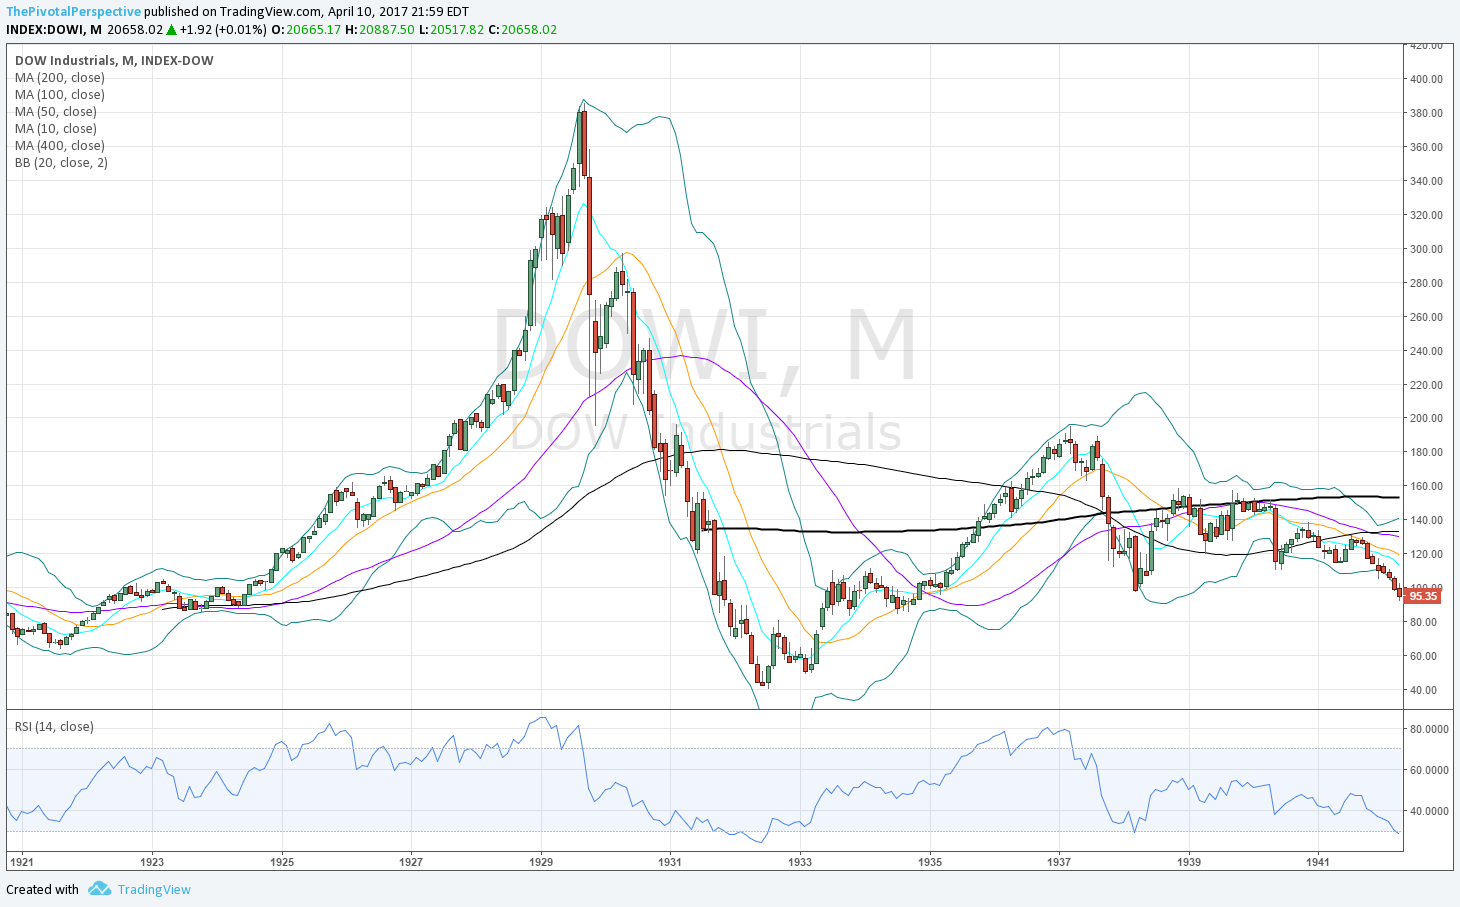
1929 Dow Industrials monthly chart
Please look at the chart below. I don't think there are too many clues here. There is a huge reversal bar in Sept 1929 after a Bollinger band divergence top, but this was also exactly the case in May of 1929 as well. There were several Bollinger band and RSI divergence highs on the way up - 12/1925, 8/1926 12/1927, 4/1928, 4/1929 - so why would you think that 8/1929 would be it?
Moving averages may have been some help. The monthly 20MA held several times in 1926 and 1927, and then the 10MA took over as support. If you bailed with stocks below the 10MA, you didn't nail the high, but at least you avoided massive damage after Oct 1929 to June 1932.
The quarterly chart is more clear. Why? RSI 90 on two consecutive quarters means the market has gone berserk. Even if the first candle with wick didn't concern you in 1929 Q1, the second sure should have in 1929 Q3. This is more an example of a blow-off top and crash than orderly slowdown, distribution & divergence top like 2000 and 2007.

The long term pivots chart shows rejection from YR2, then a break of 2HP. While rejections from levels did occur on the way up in 1927 and 1928, the simple criteria of closing below a long term pivot avoided massive damage in both 1929 and 1930.
