Q2 and April pivots

Quick rundown of the charts frequently mentioned on this site. These are "pivot only" charts meaning no support (green) or resistance (red) lines, to focus on the new Q2 (in crosses) and Apr (dots), as usual in orange.

Including the typical MAs to help with trend analysis. Keeping it simple here with ETFs only, though in reality indexes and futures levels should be factored in for full reliability. 

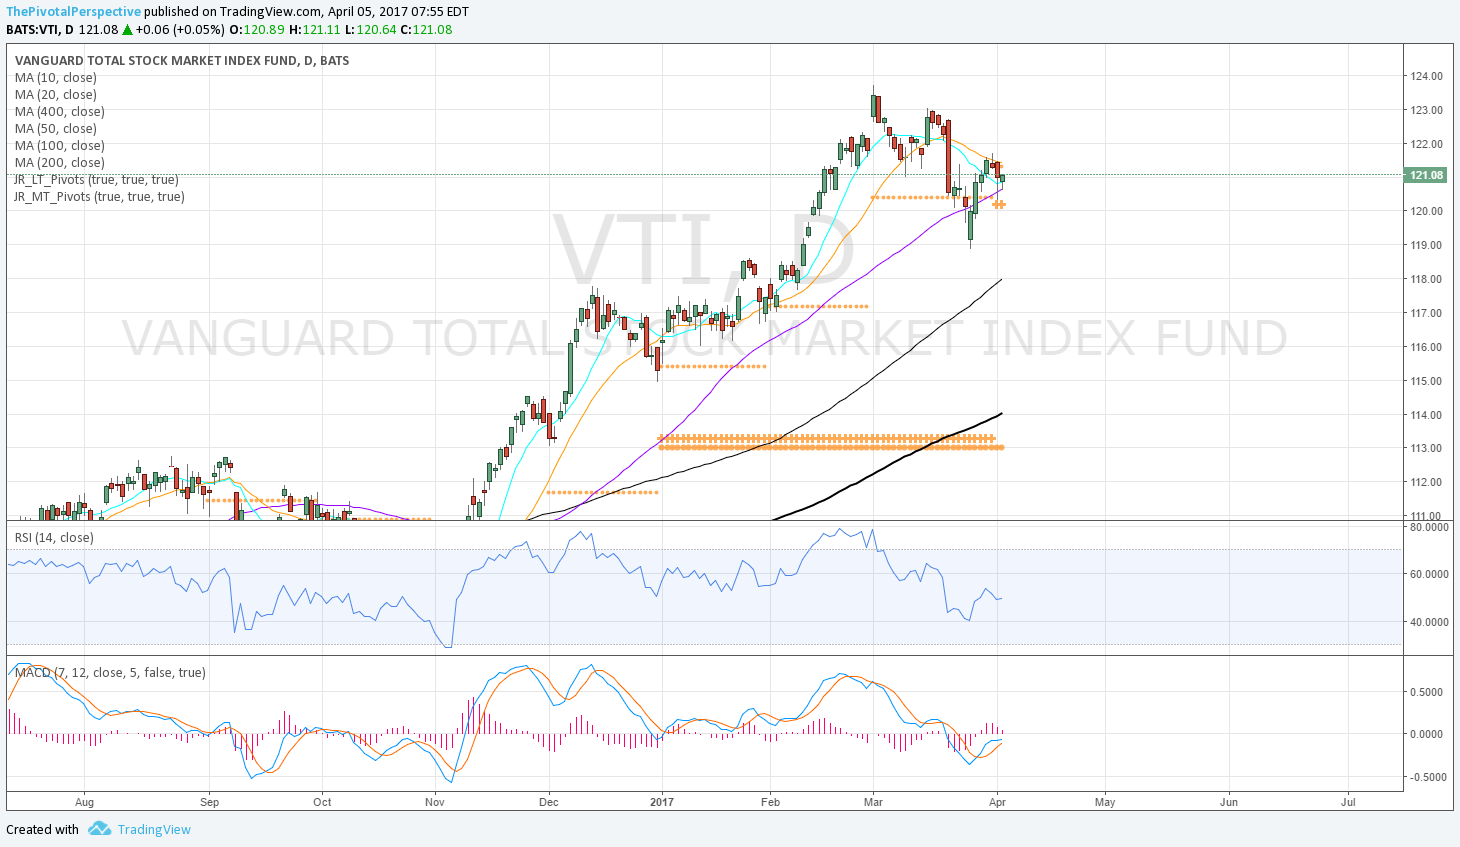
USA mains - SPY QQQ DIA IWM VTI
In some cases below a monthly pivot after being above for 4+ months would be more a threat, but I'm weighting the successful test or near tag of Q2P and rising D50MAs. 

5 2 QQQ D.png
5 2 QQQ D.png

Safe havens - TLT AGG GLD VIX XIV
TLT & AGG above Q2P first time in months is a factor, and could be a considered as a small longs (not full since still below YP and 1HP).
GLD looking good above all pivots and nice recent hold of YP.
At same time, VIX and XIV could not be clearer, green light for risk.
 

5 7 AGG D.png

Dollar
Huge hold of YP and near D200MA test - what a setup on 3/28. Now above YP & 1HP, below Q2P and AprP. DXY stall has allowed global stocks to rally so the global longs want to see DXY stay under Q2P and better under AprP as well. 

11 DXY D.png

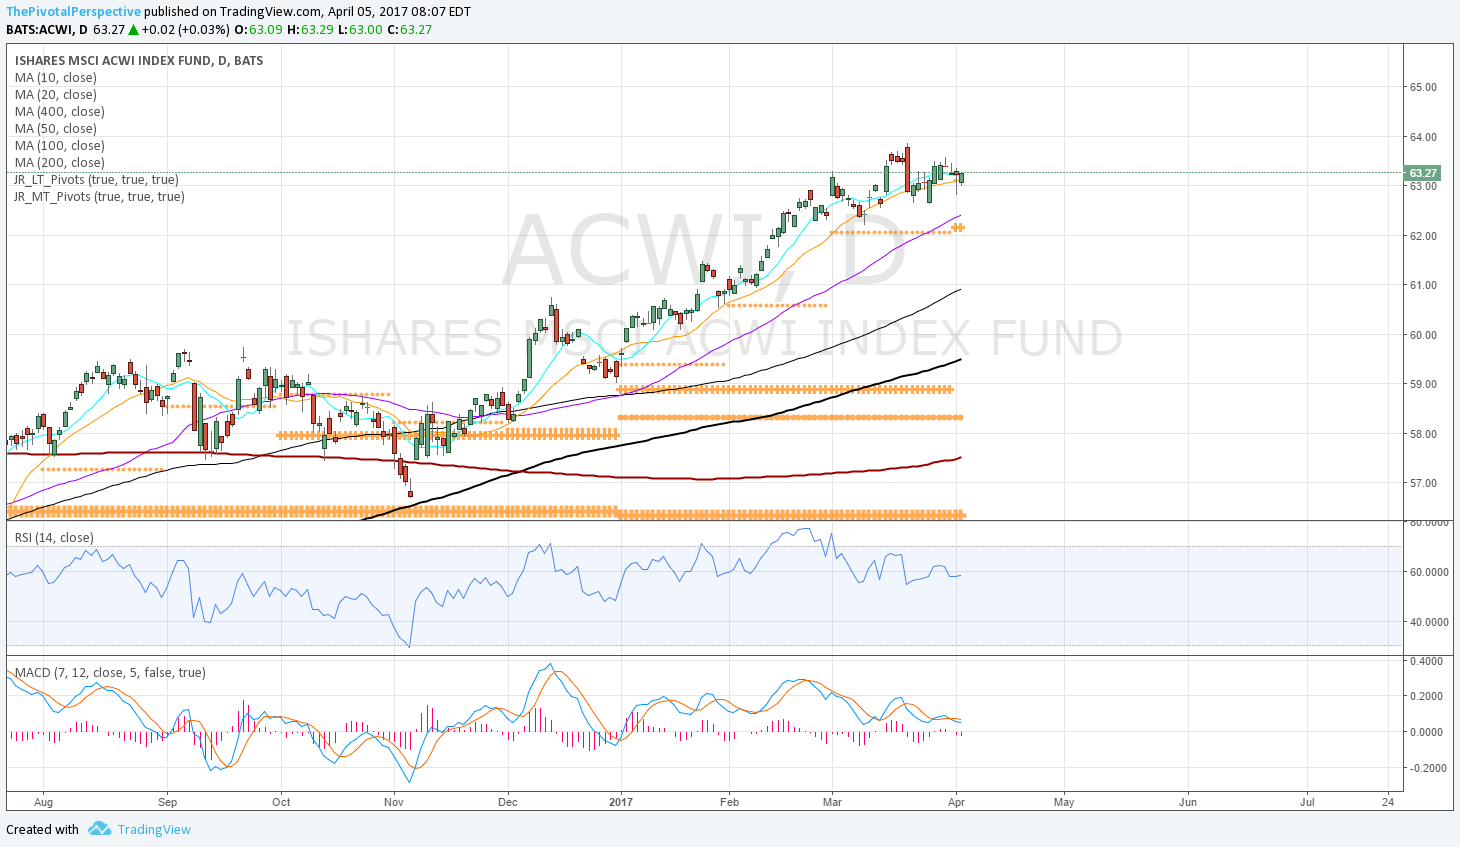
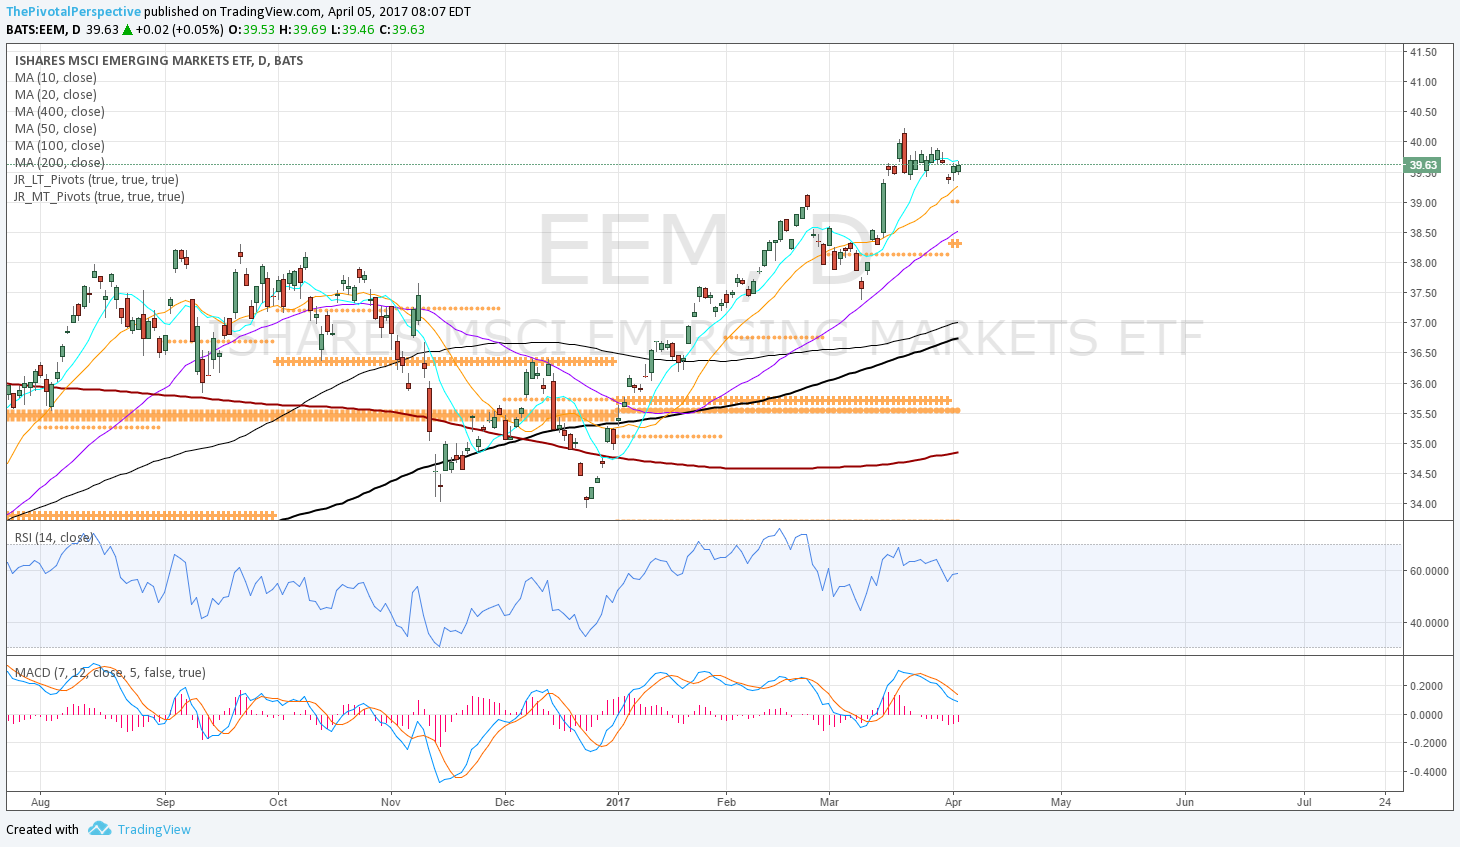
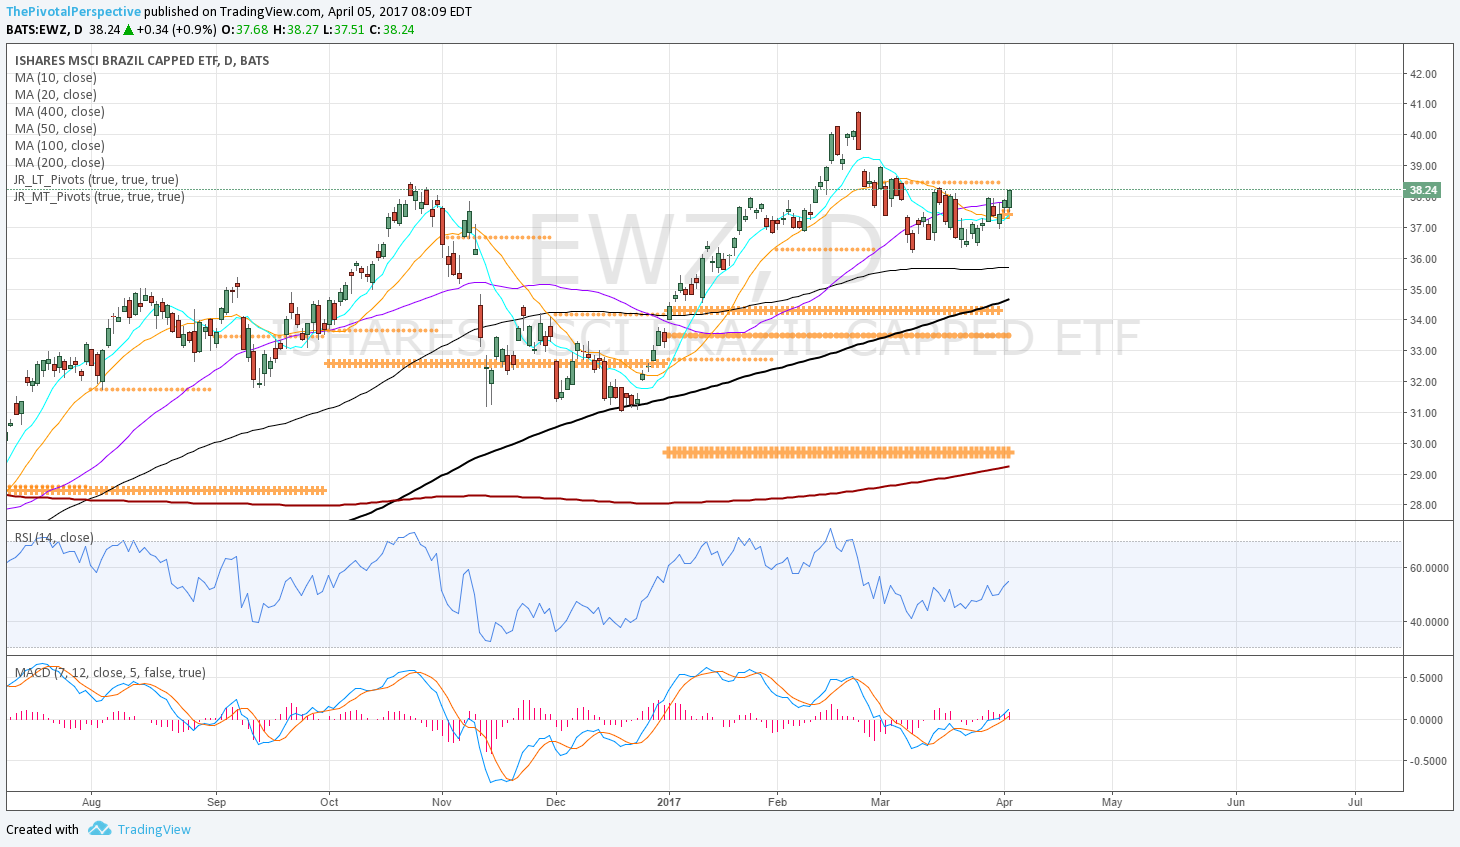
Global stocks - ACWI EEM FXI SHComp FXI RSX EWZ
On a tear, all above all pivots! Hard to remember seeing this when most USA indexes have not met this condition. Really I was late to this move as rotation began in January when already fully long USA stocks but at least in INDA before the big pop and currently global overweight. 

5 13 FXI D.png
5 14 SHComp.png
5 15 INDA D.png
5 16 RSX D.png
5 17 EWZ D.png

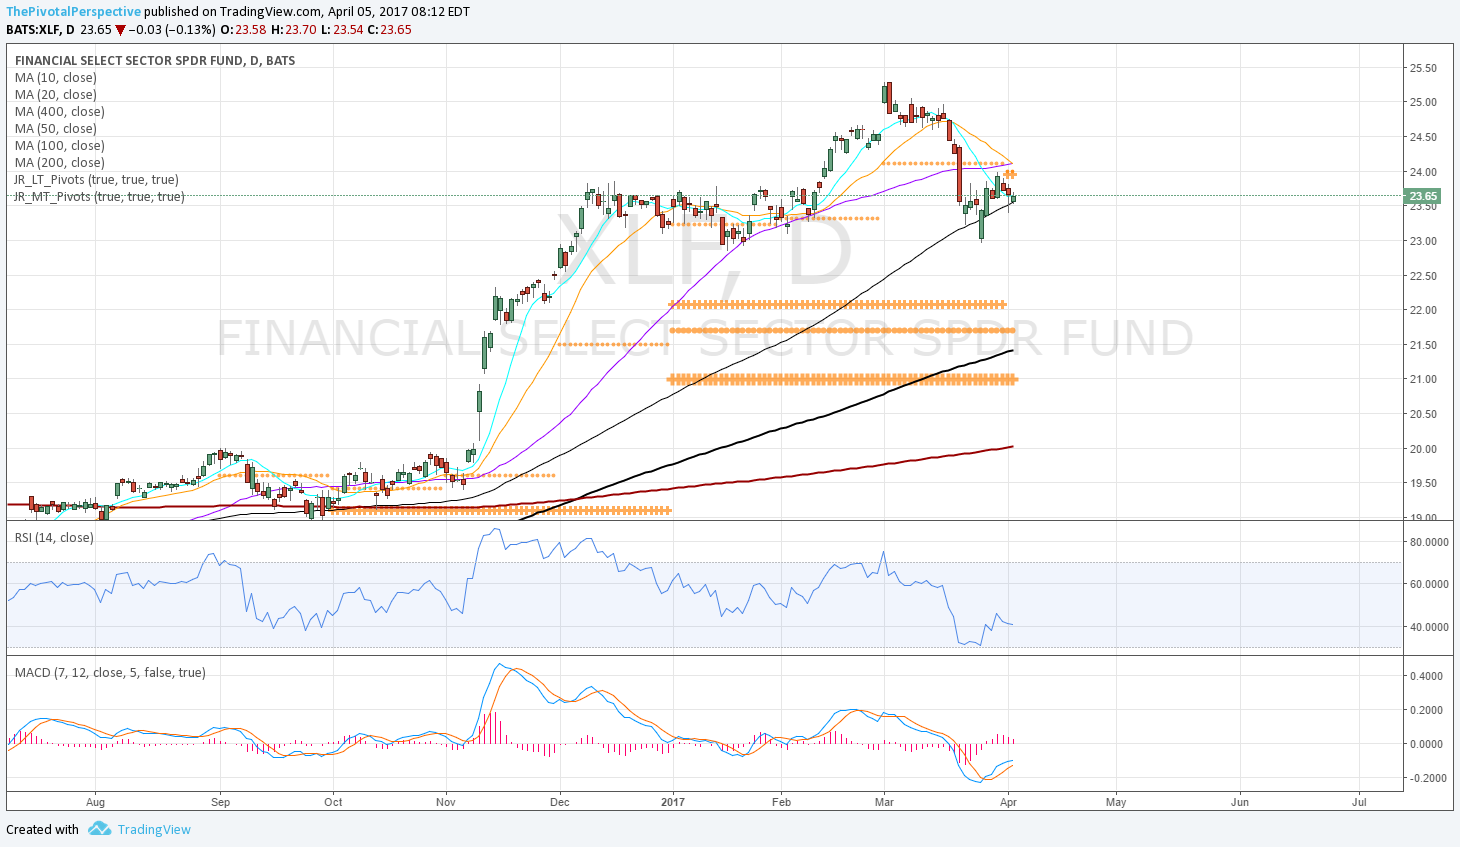
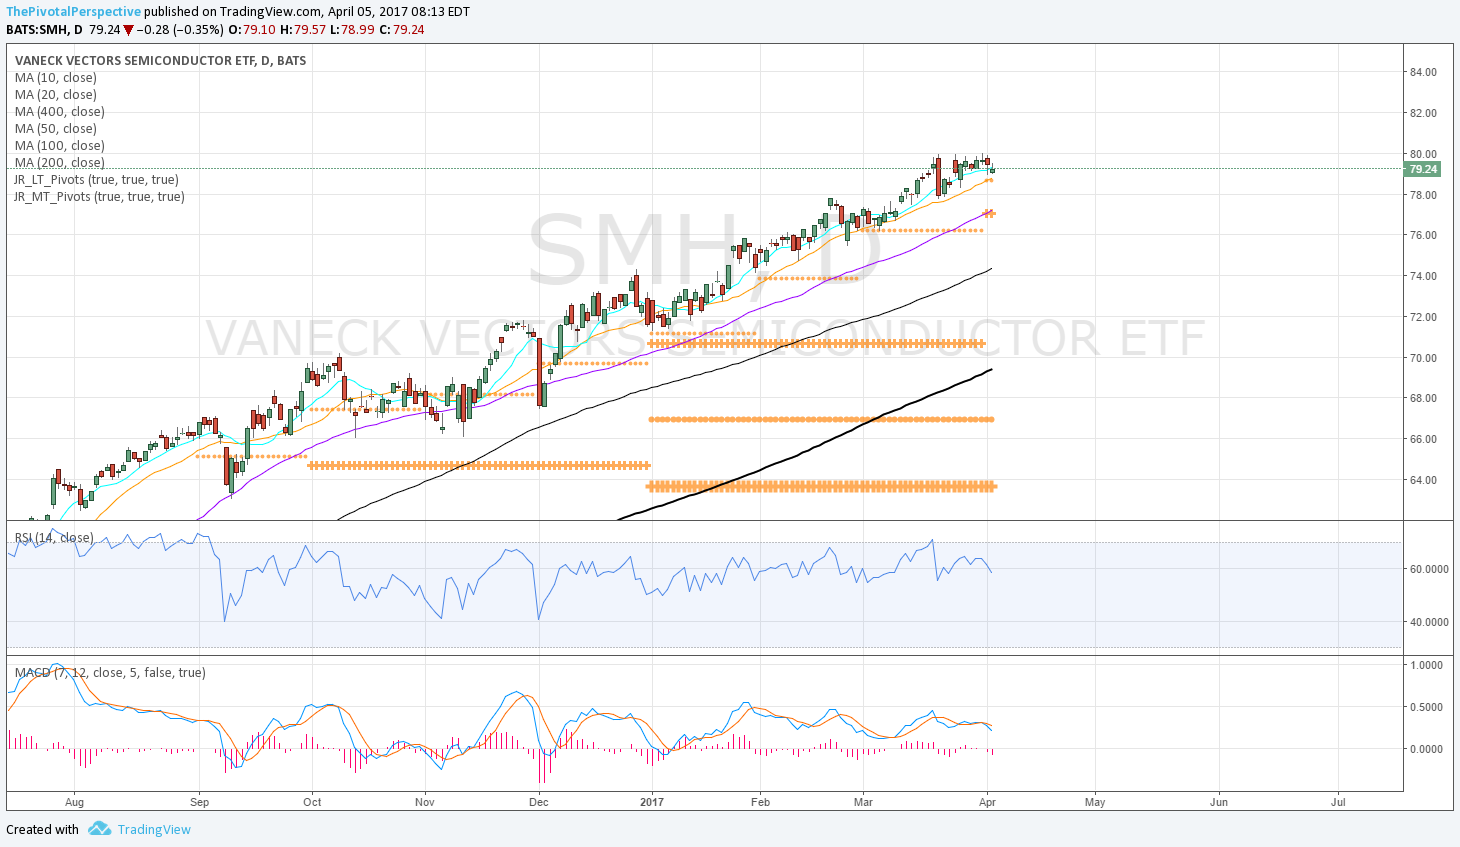
USA sectors - XLF SMH XBI XLE
XLF below Q2P
SMH above all but looking a bit tired
XBI below AprP
XLE just held YP potential positive, but under D200, 1HP, Q2P, falling D50, and testing AprP - i'd rather be long EWZ or RSX

5 19 SMH D.png
5 20 XBI D.png

Pivot status

This may become a regular feature. 

Remember I don't track everything (S&P sector charts for example) and don't have time for individual stocks. If you have any questions, feel free to send a message through the contact page. 

Above all pivots (not so many things right now)
EWZ
NQ futures on both 1 continuous and current Z contract
SOXX/SMH
XLF (but not IYF)
XIV
$USD (but i am not tracking that many currency pairs, only the major crosses)

Nearest to recover status of above all pivots (ie first buy choices if we get general long signal)
QQQ
EEM
PIN
IYF another benchmark financial ETF
DIA actually easier than SPY at this point

Recent tests & holds of Q4Ps
EEM
FXI
PIN

Long term weakness of note (less common this year because USA stocks, global stocks, bonds and commodities all up for much of the year)
TLT, below 2HP with first break on 10/10 and second break 10/24 (shorts are quite late)
EFA (Developed world ex USA index ETF) below YP all year, but above 2HP; any lower will be below 3 / 4 pivots
XBI / IBB biotech gave back all summer gains; IBB below all pivots as of 10/12, XBI sitting on 2HP (last one left) on 10/28 (This may also determine fate of Tech set.)
ps, FXI & ASHR (Shanghai ETF) both under YPs, more due to 2015 high in stratosphere; both above 2HPs so i'm not really considering these as weak 

Quite a lot now in mixed condition above both long term pivots (YP & 2HP) but below medium term pivots (Q4P and OctP), or opposite
SPY, DIA, IWM, VTI all long term strong but medium term weaker
GLD & GDX also, although these could more easily break 2HP than USA stocks due to proximity
NKY & DAX under YPs but otherwise OK above 2HPs; also both above Q4P and OctP

Oil varies per vehicle: CL1 continuous, current Z contract or USO all different picture
CL1 above all pivots handily from 9/28
CLZ YP break 10/24
USO above 2HP, Q4P and monthP from 10/3 but well under YP all year