Bonds and rates

Two of the three bond ETFs I track, TLT and AGG, made definitive moves last week under YPs. This can be the start of something big so I wanted to look at bonds more thoroughly, and that means TYX TNX and somewhat ZB and ZN.

TYX is the holdout; still under its 2HP and D200MA. Both cont futures contracts already betting on move UP in rates. 

As we know anything can happen and no crystal ball but with TNX above 2.33 and AGG below 109.46, it seems that there is potential for major move UP in rates / down in bond ETFs which would likely juice financials. If this is going to happen then TYX needs to clear 2.90-91.
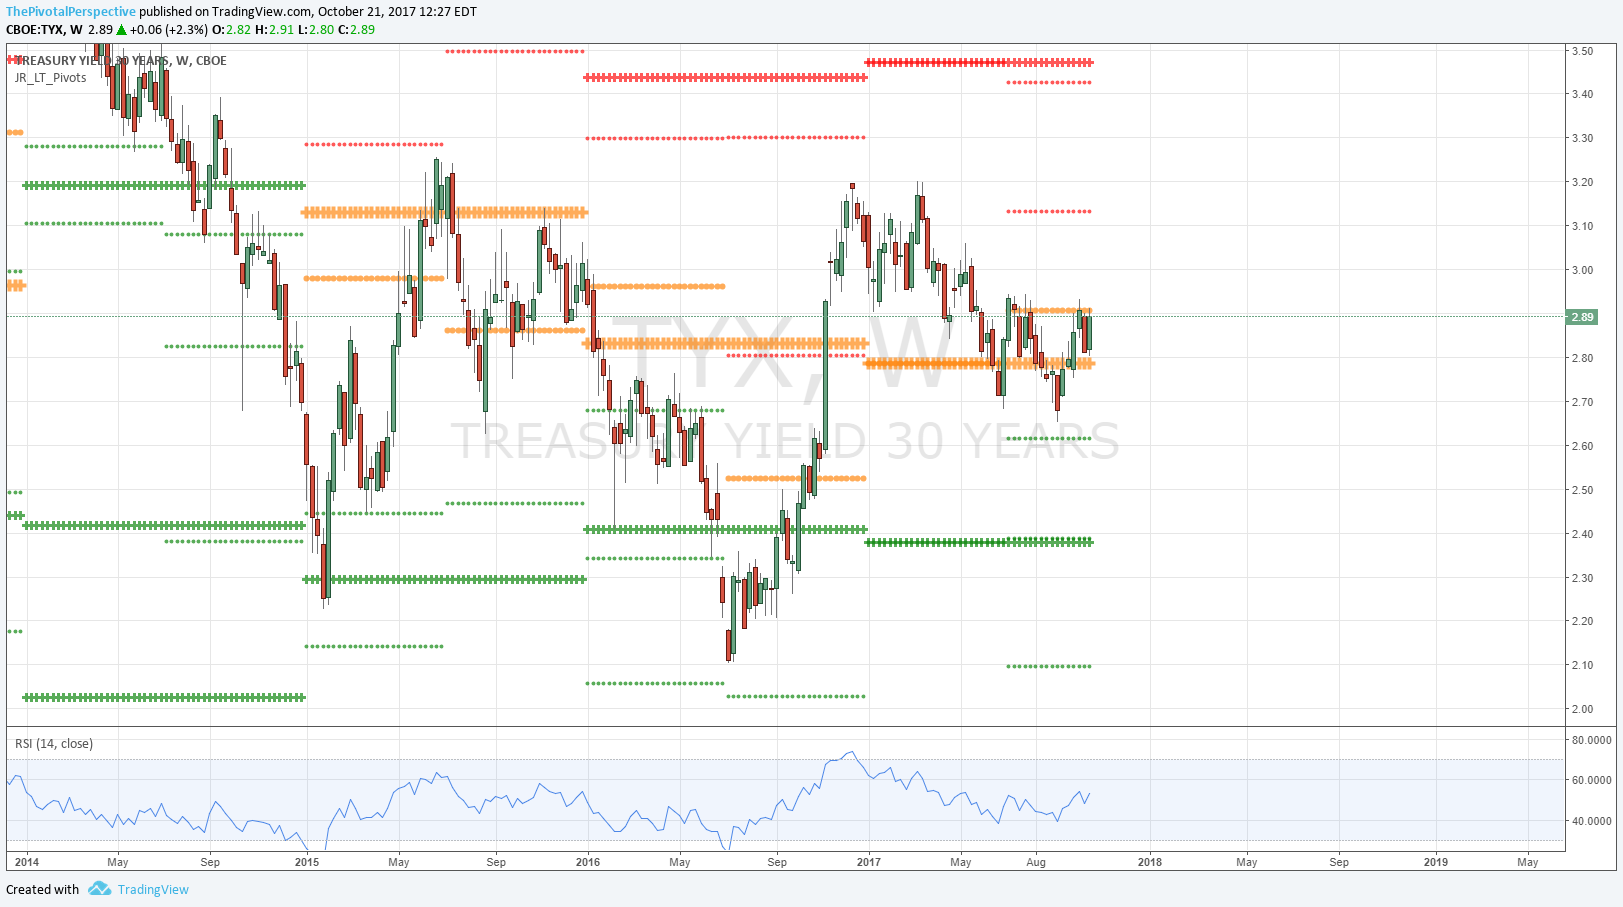
TYX
W: Back up to W200MA and top of W BB; finding support from 10MA and 20MA. Pretty clear resistance; the question is what happens if TYX starts to rally above that level.
W: Interesting - hold of YP yet stuck on 2HP. Only 2 weeks above 2HP, rest below. Above would be significant change in status if holds on weekly close.
D: There is the 2HP test in daily detail, with D200MA just above with slope starting to flatten out. MACD not 100% reliable but not - going on a buy. 20MA and 50MAs are curling up; and D200MA already worked as resistance once in Q4. Again?
ZN: Already decided - bearish. Q4P clear resistance then rejection. Fractionally under all pivots with second D200MA break this quarter. Also note high of year on YP exact!
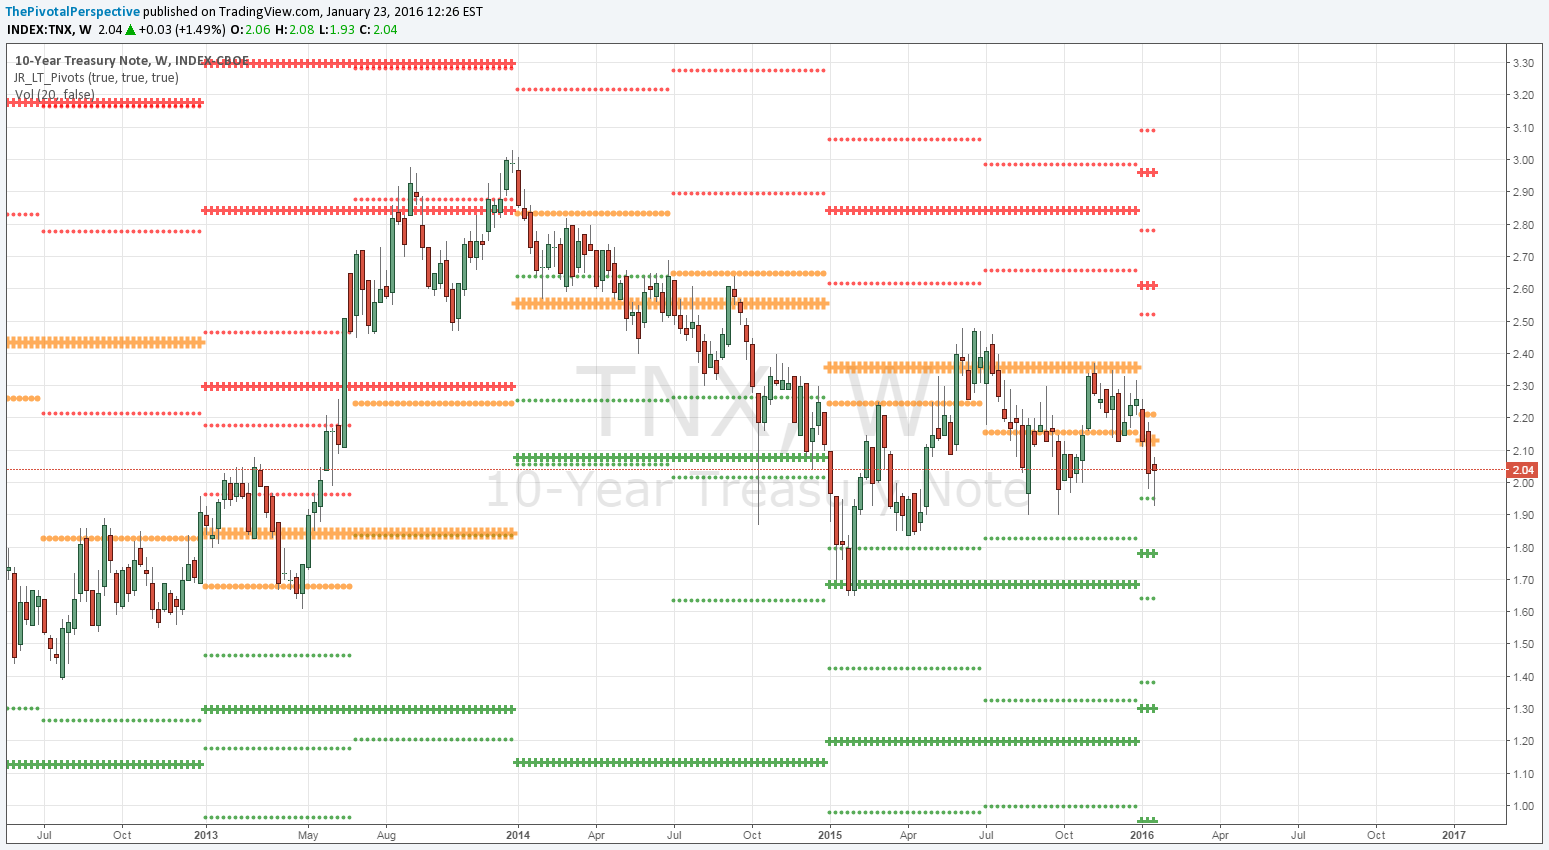
21 50 TYX W.png
21 51 TYX W.png
21 52 TYX D.png
21 53 ZN1 D.png

TNX
W: Above MAs and pushing up. 61% Fib resistance in play. 
W: Above 2HP.
D: Lifting from D200MA.
ZN: More definitively below 2HP and 200MA rejection.
TNX: Technically stronger than TYX and already making a move above 2HP and above D200MA.

21 54 TNX W.png
21 56 TNX D.png
21 57 ZN.png

Long term charts - TYX & NDX

All time lows in bond yields were reached on 7/6. After a near low test 7/29, yields are again moving up and seem like they "should" go higher to test pivot and MA resistance.

The all time high in NDX was in 2000. While the price came close to testing in 2015, the quarterly / monthly and weekly close highs acted as resistance in 2015. Recently they have turned into support. NDX seems very likely to be making headlines in the very near future. 

The big question here is: NDX new all time high and fade from there as bond yields continue trend? Or NDX blast off and maintain, as bond yields continue down? We'll see. 

TYX Q
Red line is the previous all time low, and consider the quarterly close low of 2.30. Whether or not this is the final low, a lot more upside possible here. 

TYX M
Small red bar with RSI divergence and false breakdown with price back above 2015 low. Stage set for higher. 

TYX W
Still under a sharply down sloping 10MA (aqua) then the 20MA (orange) has been resistance the entire year since the 2nd week of January. 

NDX Q
2 red lines on this chart are the quarterly close high and the all time price high. You can see the stall near the quarterly close high in 2015 Q1 & Q2, then a drop; after that the quarterly close has been support. Small red bar 2016 Q2 and since then launch. We are only about halfway through Q3, but c'mon, this looks set to blast through the all time high.

NDX M
Same red lines as the quarterly close and monthly close were the same. Now maybe we will see selling at the highs, but I cannot imagine not seeing the new all time high headline, which could be as early as Monday. Though RSI overbought on the quarterly chart (and has been since 2013 Q3 btw) RSI on the monthly is only 63 - plenty of room for higher!

NDX W
On this chart I have replaced the monthly close high with the weekly close high, and you can see this was the exact top in July 2015, then again was resistance in later 2015 with 2 bars just slightly exceeding the level and quick drops back under. This move has been an entirely different story - all blue from the 6/27 low, outside the weekly Bollinger band for 3 weeks, and the weekly close level holding as support. Now I don't know how much higher we will see immediately, and given daily RSIs maybe we will get the headline and then drop, but at this point new all time high in NDX seems like done deal. 

Bonds

This blog is about pivots but I do check other indicators - RSI, moving averages and their slope, Bollinger bands. Yields are entering into historically rare territory, technically speaking. This is certainly in part due to the arm twisting, to put it mildly, of global central banks. So I am not saying it stops here. But if it did we should see signs of a turn in the charts.

Usually I keep to TLT but to show the very long term history using TYX here. From The Pivotal Perspective, downtrend in force below Q3P at 2.43 and still long term bearish below 2HP at 2.52. First target Q3S1 at 2.10, then 2HS1 2.02.

Sum
The 30 year yield (TYX) tested its all time low on Friday. Not showing the 10 year TNX here, but that came .02 shy of its all time low as well.

RSI extreme with divergence reached on TYX daily chart, extreme reached on weekly that is somewhat negative, ie below 30, nearing extreme on monthly as well. All these give chance of some turn. However, I think the Bollinger band action especially on the weekly chart is bearish for yield; while a move back into the band is likely, the better yield rallies come after better looking stabilization lows inside the band. 

TYX Q
20MA resistance since 2014 Q2. the 2015 low was 2.22; 2016 low 2.20 and now 2.24. You get what I am pointing out here - the market just tested the all time low in 30 year bonds on Friday 7/1. Anything above 2.22 is potentially bullish for yield. 

TYX M
Monthly chart RSI nearing full OS. Just look how uncommon that has been since 2000. Most of those times have coincided with stock market turmoil. Another level to watch is the close of the previous low at 2.25. 

TYX W
And there is the low on the weekly chart. RSI OS, but Bollinger band action is quite negative here. My view: yields would have a better chance of a turnaround if we saw the down pressure slowing, ie staying inside the band, instead of a huge plunge below. 

TYX D
Also RSI extreme with some divergence. A reaction move would be normal, but given the momentum think we will ultimately see lower. If I am wrong about this, ie the turn is right here right now, we should see a swift move back above 2.25.

Bonds

Another reason I like pivots so much is that this tool is working on all asset classes: stock indexes and individual stocks (especially higher volume stocks), bonds, currencies and commodities. Let's look at bonds. Depending on your focus you might be looking at TLT, the actual interest rate vehicles like TYX and TNX, or the bond futures ZB and ZN. Let's check them all!

To start here's a weekly chart with long term pivots only (year and half year). After droping sharply in 2013 with the rejection of the 1HP and YP in early May, TLT first recovered a long term pivot level in early 2014 and rallied from there. Eventually it recovered its YP and had a huge run all the way to 1HR2 top in early 2015. Although the YP broke for about 4 weeks, it was able to recover and hold a few more times. 

I point out these histories to understand the long term motion of the market using pivots. TLT started the first week of 2016 with a clear lift from the 1HP. Stocks were looking ugly and this was clearly the only thing that was giving any decent buy signal (except inverse stock ETFs). The next week the 1HP held as support, and jumped above the YP. Although it had a possibly toppy reaction from the 1HR1 in red dots, the YP held as support and as I type TLT will likely close higher. 

Now here's the daily chart view with all pivots. 

Don't say the market didn't give you a chance to get in. There 5 days in early January there TLT was clearly above the Q1P and 1HP combo with the YP much higher as resistance. This was a good risk reward entry because you had 3 pivots all just below as support and the first real resistance considerably higher. 

Let's just say if you are a long term investor without using leverage, I would look at weekly charts once a week on the weekend and focus on the closing bar. This meant a buy after the close of the first week, ie open on 1/11.

If you are going more trades and watching the daily chart, you could have been buying on 1/6 at the close, the first day above 3 pivots. Both could have been adding as the YP held as support although admittedly there was concern with the rejection from the 1HR1. If not adding though, definitely a hold above the YP because you could start thinking YR1 which is much higher. 

Now, more quickly, do the other vehicles confirm these entry and hold decisions? 

TYX below 3 pivots on 1/6 but no clear rejection; some red the next day. 

TNX clear sell bar on 1/6 (ie TLT buy). 

ZB congested for 2 days and clear buy on 1/6 and nice smooth trend up. The only selling was the JanR1 on 1/11 which was quickly answered the next day with a big rally. The discrepancy with the futures is that it already reached its YR1 level were TLT and TYX / TNX are nowhere close to yearly R1 / S1s respectively. This is because the futures aren't looking back for the full year; this is annoying discrepancy of the method but programs are still positioning off these levels. 

ZN also jumped above 3 pivots on 1/6, and you had a chance to buy there or the next few days. 

Back to TLT. TLT already has a high on 1HR1 exact on 1/20 which was the date of the stock low. That is a major resistance level and important to watch. But if the YP continues to hold as support, that is even more bullish because it will mean TLT is above all pivots. Trust me, there is not much to buy right now that is in that category (ie above all pivots). Maybe we will see Q1R2 at 129.80, or even what would surprise everyone is a big bond rally back near the 2015 highs to YR1 area at 134.42.

Big levels

The amount of indexes or ETFs that turned from long term levels - by this I mean yearly or half-year pivots - is rather amazing. These weeks are rare. The odds favor more on the bounce, but how far it gets we shall see - and use the shorter term pivots, especially the FebPs which will be in play in about a week - to gauge the strength. Of course all the levels below that broke and recovered by the weekly close will have to hold.

All charts weekly with year and half-year levels only (no quarterly or monthly). Listing comments first, then the charts. If you get confused to which is which, look for the light grey watermark of sorts identifying the index / ETF.

This post has gotten quite long, and I still didn't cover two categories - currencies and commodities namely, oil. I will do another post on that soon, but check the recent blog post on oil that pointed to the key level YS1 a day before the low!

USA mains stock indexes & ETFs
SPX / SPY / ES - all broke YS1s & 1HS1s, but recovered on close (hard to see 1HS1 on chart b/c so close to YS1)

NDX / QQQ / NQ - low on NDX near exact, QQQ disparate structure ie not on YS1, NQ more like ES

INDU / DIA - lows on YS1 & 1HS1 combo

RTY / IWM held YS2 / 1HS2 combo area. (Note: these two charts added on 1/27.)

NYA - recovered YS1, but still a fraction under 1HS1

USA additional stock indexes & ETFs
IBB - weaker bounce off YS1

SOXX - better move up from 1HS1. The Pivotal Perspective prefers SOXX over IBB here.

XLE - also YS1 low and recovery of 1HS1 

XLF - I don't know what to make of pivots this year due to massive 8/24 spike, so not showing here

Safe havens & risk indicators
TYX - just slightly below its YP; recovery would put in back in congestion zone above YP but below 1HP; below YP remains bearish yield and bullish bonds. 

TNX - rebounded from 1HS1

TLT - high on 1HR1 near exact

ZB - high on YR1 / 1HR1 combo, but could be pause and not rejection.

ZN - also high on YR1 / 1HR1 combo, but also perhaps pause and not rejection.

HYG - low on 1HS1

VIX - poked above, but did not close above, the YP for the last 2 weeks. decent reversal from the YP although some may point to closing below the low of last week as confirmation, which hasn't happened yet.

XIV - near test of YS1, no official tag however

GLD - rather awful that GLD could not climb above 1HP in all the turmoil

Global stock ETFs
EWJ - held YS1 and 1HS1

EWG - held YS1 and 1HS1

FXI - holding 1HS1 but not much green 

EEM - similar to FXI

PIN - low on 1HS1 exact

RSX - low on YS1 and decent bounce along with oil

ACWI - global benchmark ETF, also low on YS1 & 1HS1 combo