Sum
Among these 5 main indexes, IWM was the clear leader in Q2. It was the first to recover above all pivots in early April, then remained above all pivots with exception of fractional break on 4/30. This happened as all the other main indexes were below Q2Ps, a glaring divergence. Focusing on this paid off with a ~10%+ rally off the early May lows, far outpacing the others. In fact, after launching back above all pivots on 5/4 there was only 1 trading day below a WP, and was again the last day of the month.
But last week IWM ran into YR2 and got smacked. The most recent Total market view emphatically emphasized that the YR2 / HR2 area was probably good to take profits. There were several reasons for this judgment - major resistance levels, how they have reacted this year compared to last year, RSIs across timeframes, sentiment, and lack of larger participation of other indexes in the rally (only QQQ had made a new high for 2018 in June).
I'm typing up more detail on this today because this move is what The Pivotal Perspective is all about. We focus on strength technical strength - first above pivots, what is holding when others are breaking. This often (not always but often enough if you are comparing risk assets to risk assets and not just risk to defensive names) is the next leader. Then we want to hold, especially above nicely rising daily MAs and/or weekly pivots. Take profits or hedge at major resistance or when there are multiple signs of likely exhaustion. Now we can consider re-entry or try to spot the larger theme for Q3.
The leaders, IWM and QQQ, look most vulnerable to a drop. SPY which has been middling seems like it could go either way. DIA and NYA have been beaten up, but there is a case for a bounce though they are technically weaker below Q2Ps. Q2 was no exception with the low on all 5 USA main indexes on 4/2, the first trading day of the quarter.
I have said many times on this site that end/beginning of quarters are great times to be watching for the next larger move. I think it is good to have already raised cash. A pure bullish scenario would be a bounce back on all 5 USA mains with DIA and NYA back above Q2Ps with IWM and QQQ moving back to highs. This seems unlikely to happen. A pure bearish scenario could occur if IWM and QQQ move lower, and DIA stays under its Q2P. This seems a bit more likely to me. But perhaps most likely seems like a mean reversion with winners getting sold and losers continuing bounce.
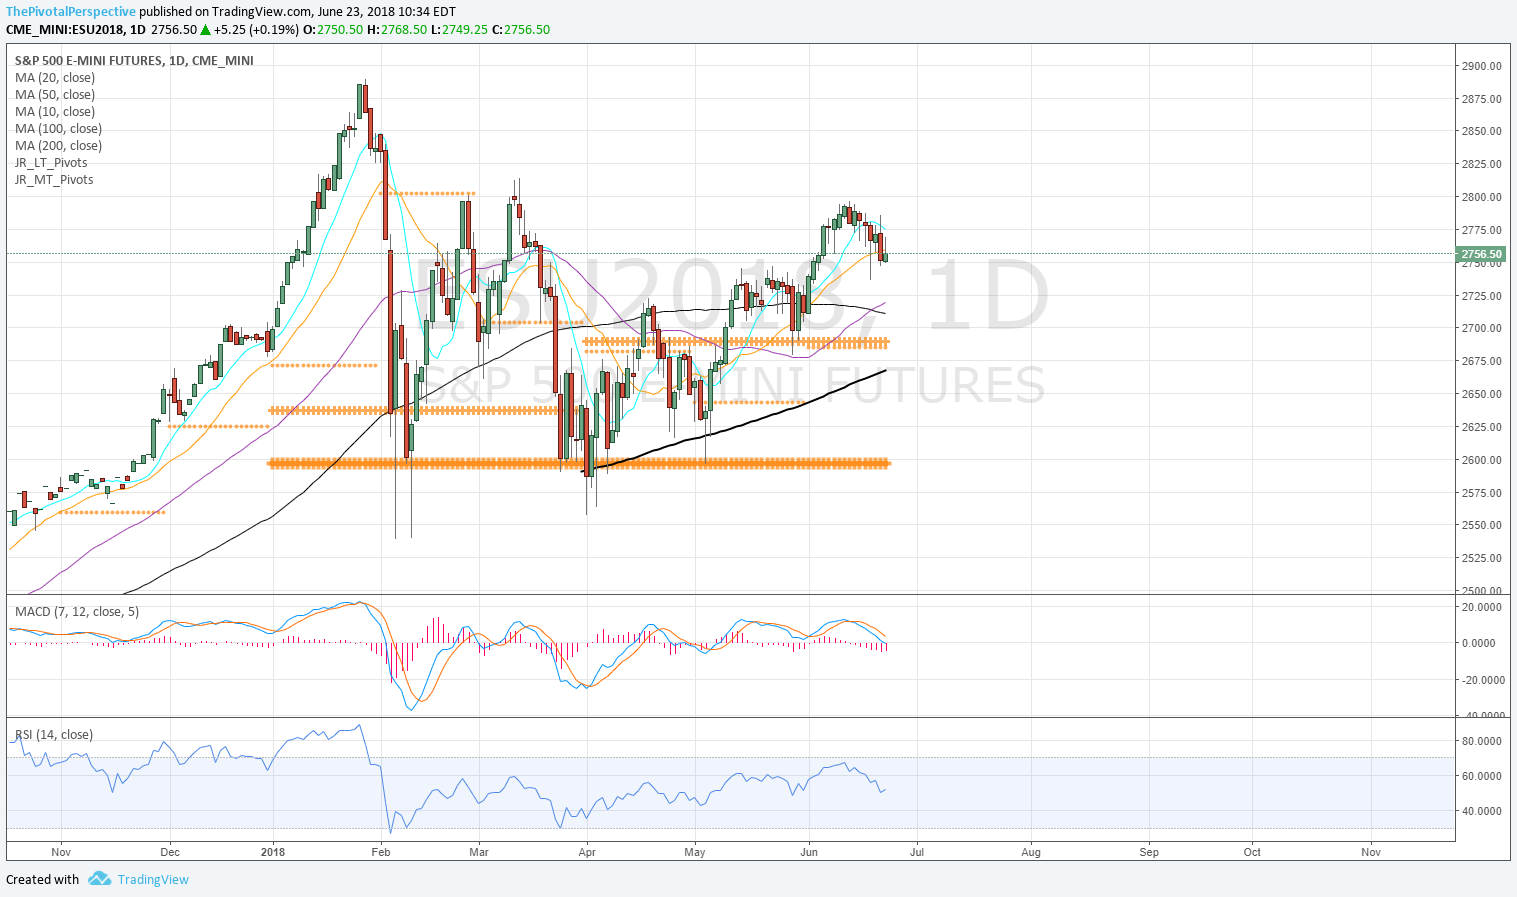
SPX / SPY / ES
SPX W: This doesn't look too threatening; could be normal pause.
SPX W: But below HR1 looks a bit more serious, especially with high of year on HR2.
SPY D: SPY also showing resistance on HR1.
ES D: MACD almost turning negative, with 10MA already resistance and D20 turning into resistance on Friday.
SPY 2H: Weakening - under WP all last week.
SPX sum: Pause at HR1, with ES daily chart looking a bit weaker.


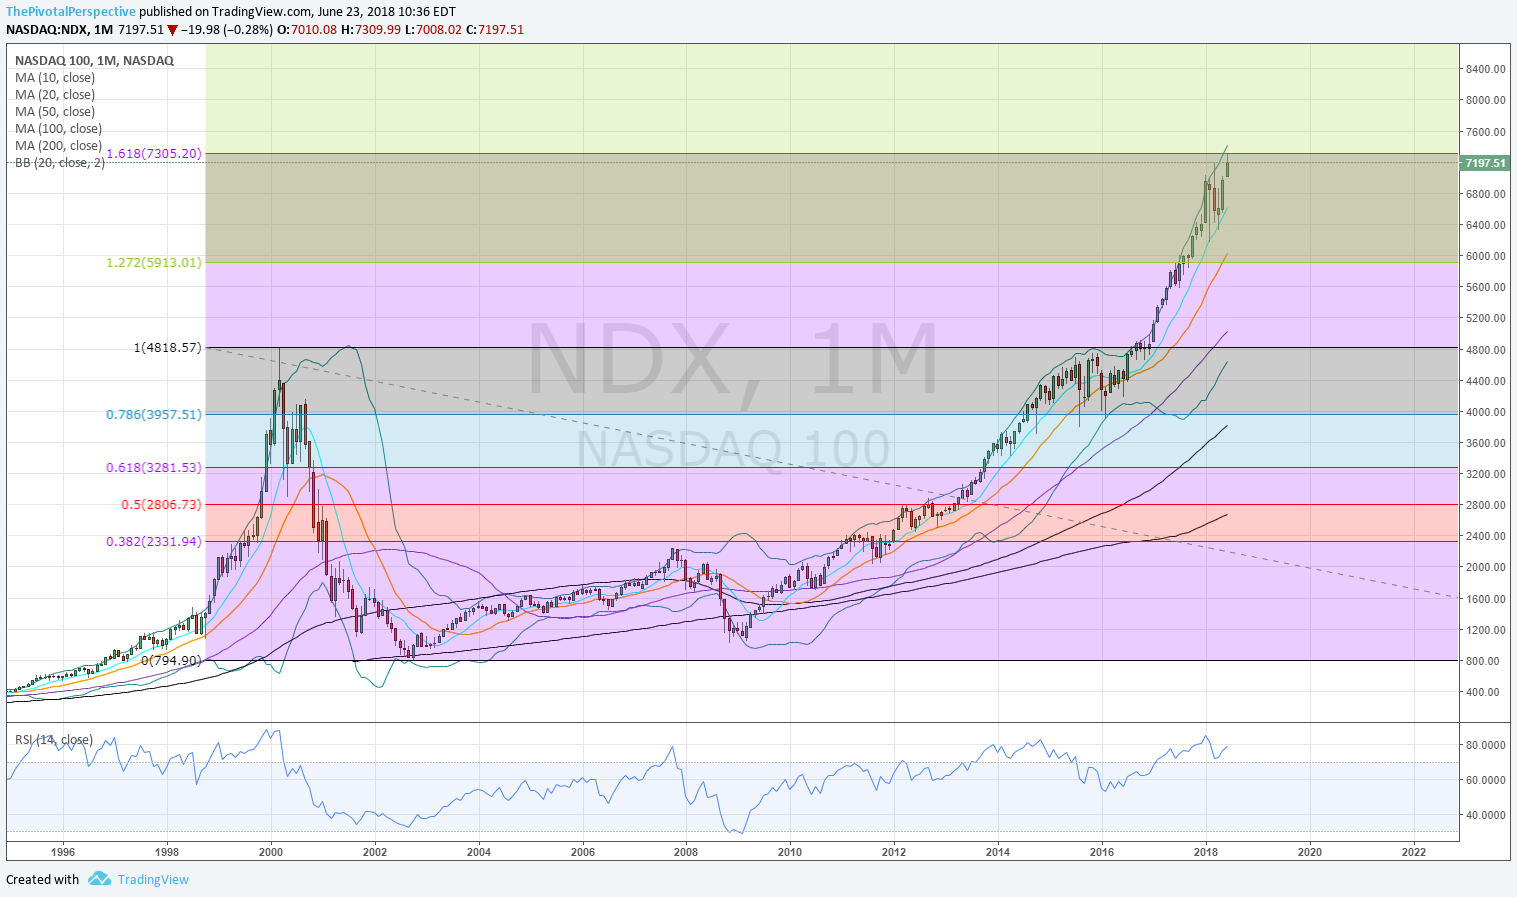
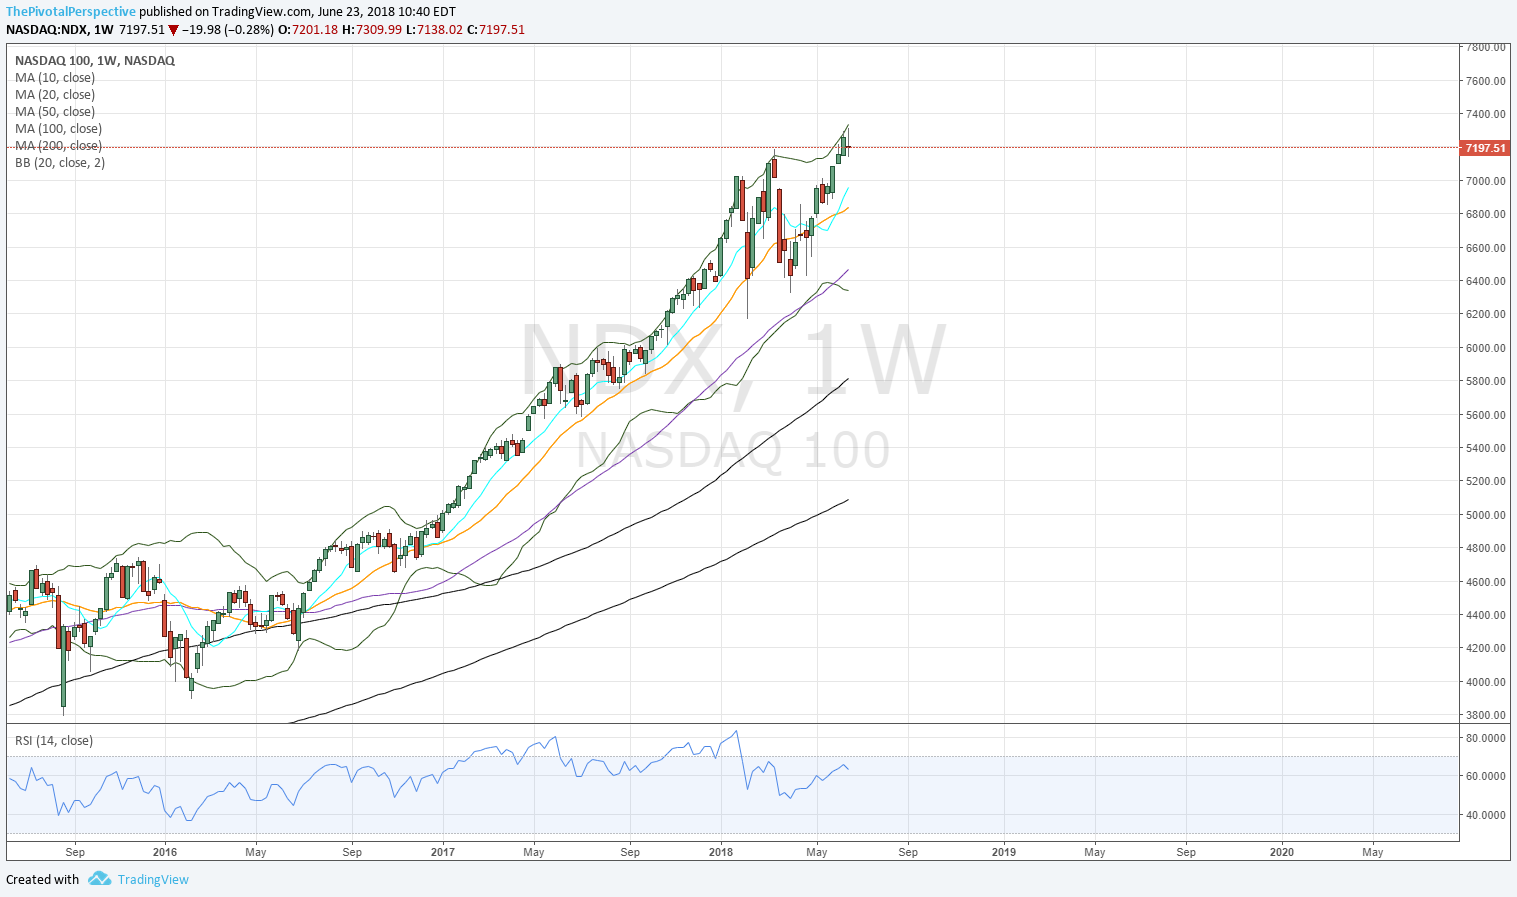
NDX / QQQ
NDX M: 2000H / 2002L 161% = 7305 pretty close so far.
NDX W: Doji bar with perfect BB divergence after multi week run up suggests next move down.
NDX D: High near JunR2; so far holding above March highs; below that could more threatening.
NQ U: But this still looks stronger, just a simple pullback to a rising 20MA.
NDX sum: Potential for a decent top there on interesting monthly 161% extension, doji bar, and JunR2 - but we'll see how far it drops or if rising 20MA bounces again.


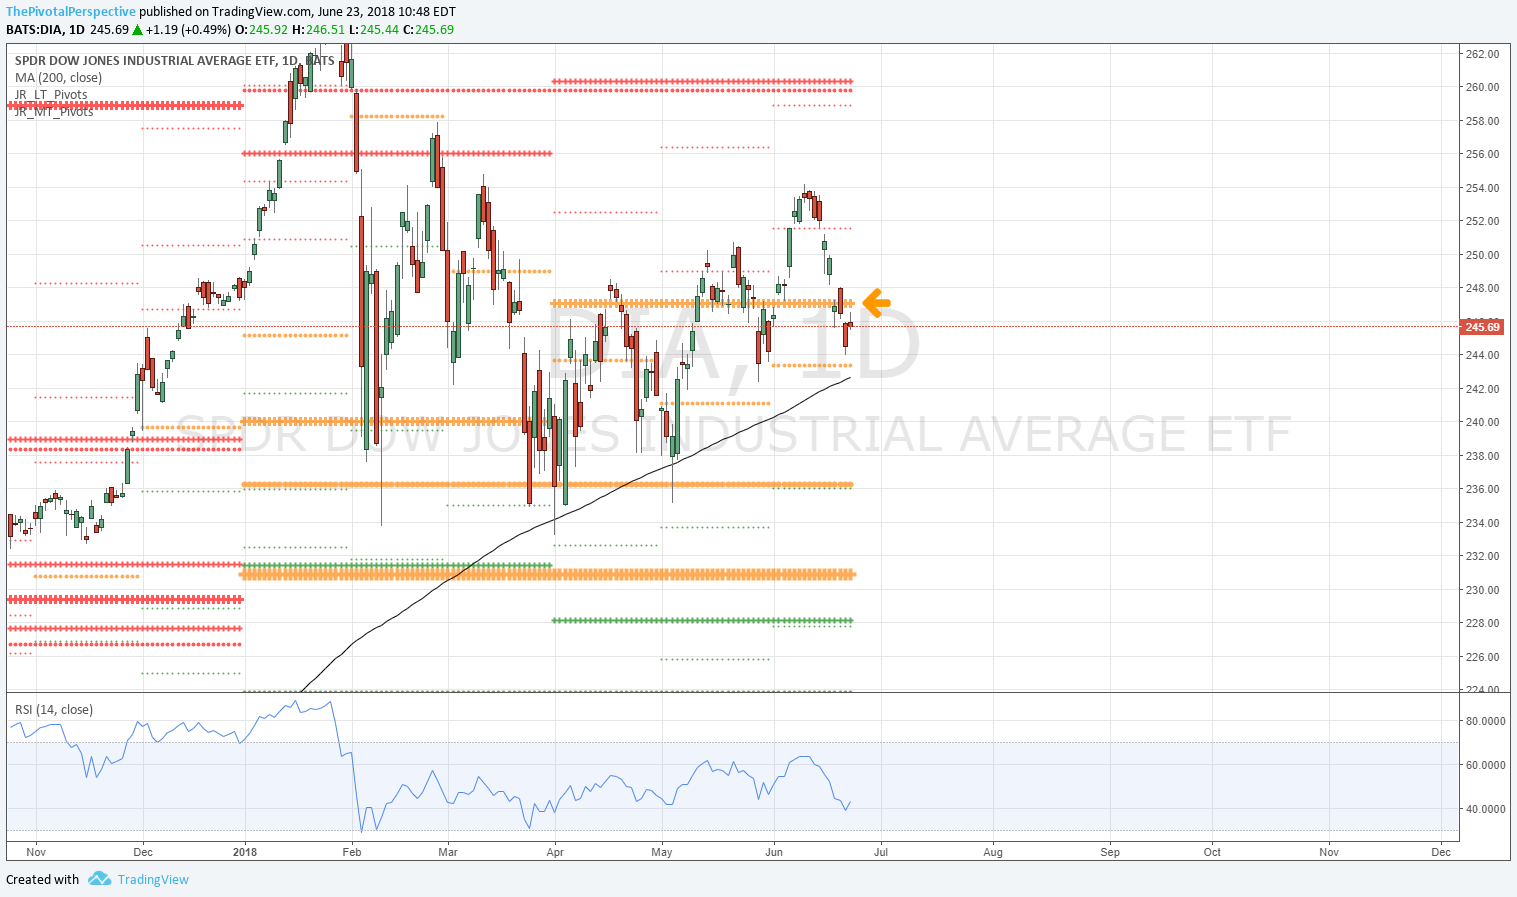
DJI / DIA
DJI W: For all the news last week about 9 days down this doesn't look that bad - far less damage then 2 other 2 week declines this year. Attempt to clear W20MA didn't last.
DIA D: Under QP the last 4 trading days.
DIA sum: Under QP is bearish.

RUT / IWM
RUT W: Inviting sellers.
RUT W: YR2 stopped the move as expected.
IWM D: 1 day mistake above YR2 then wham.
IWM 2H: Above WP all days except 5/29 since 5/4. Amazing run, but expect to see below WP next week.
RUT sum: Doji bar at YR2 with RSIs at historical extremes just 2 days ago, in a crowded trade, with quarter end profit taking and re-balancing approaching. This should go lower.


NYA
W: Still above a rising W50MA. So, still a bull market.
W: Still above YP and HP - still a bull market.
D: Below QP 5 days but strong rebound from MP and back above D200MA.
NYA sum: Below QP and back down to D200MA area which has been a battleground several times this year. Long term trends still intact for now.


