Sum
Leaderboard pretty clear - QQQ and IWM, with QQQ at a new price and close high on 6/14, and IWM price high 6/12 with close high 6/15. In terms of momentum these are both reaching late 90s levels and if time permits I'll try to do more on that this weekend. QQQ has soared above all major resistance with only JunR2 the next level; but not so for IWM, with HR2 YR2 area overhead a great area to take profits from early May longs and perhaps try speculative shorts.
SPX in the middle, but for now bullish holding above HR1.
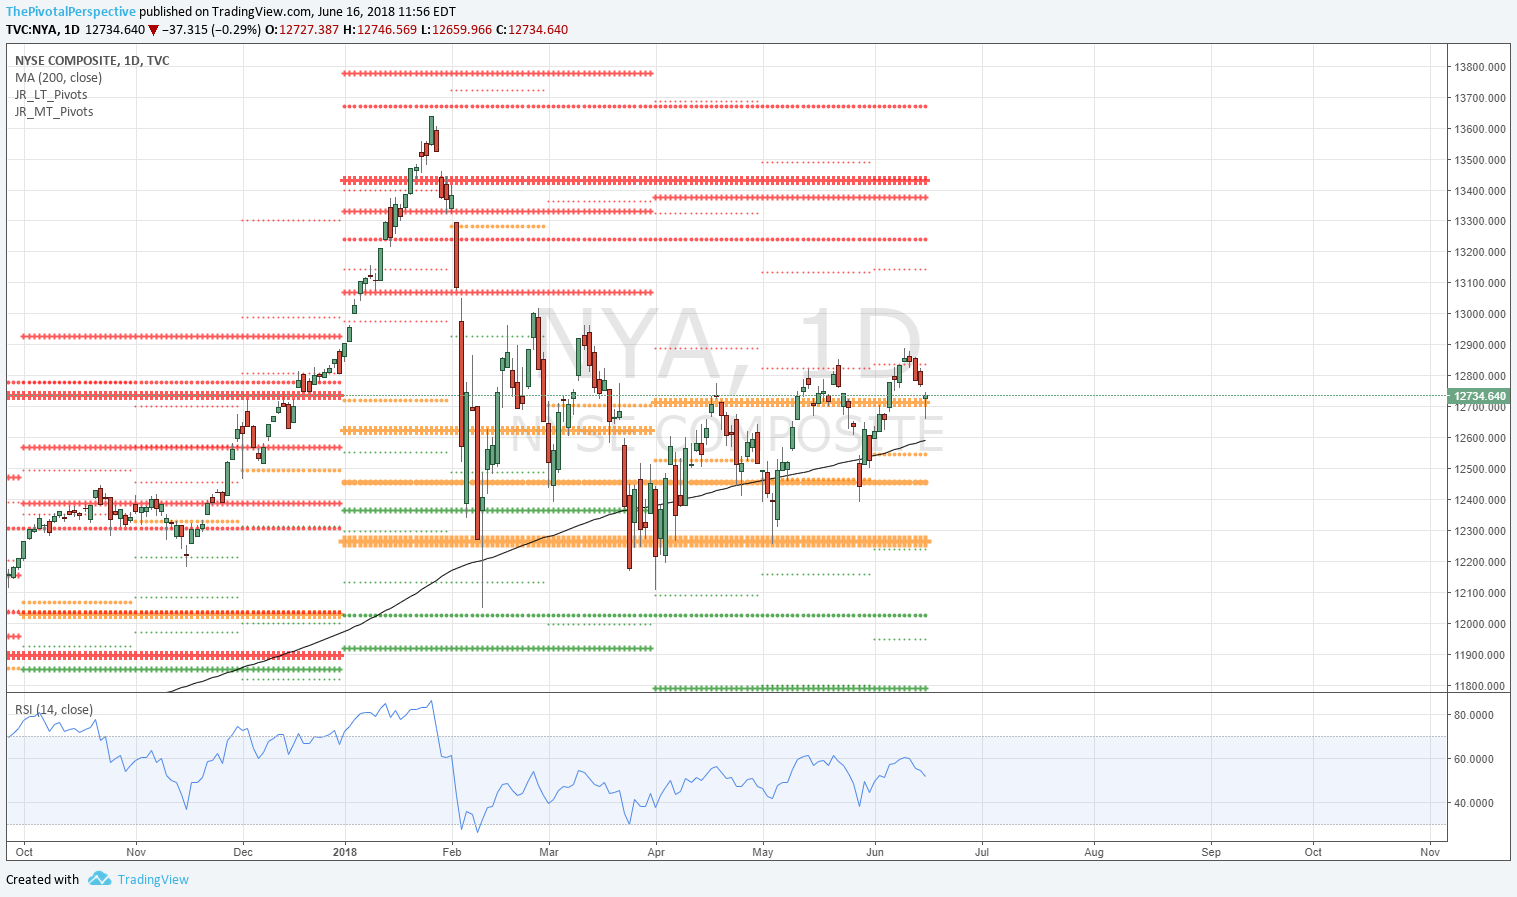
DIA and then NYA bringing up the rear with totally different action; well off January 2018 highs, with NYA back testing its Q2P.
Long / overweight IWM and QQQ and avoiding DIA has been great way to play the USA mains in Q2.
SPX / SPY / ES
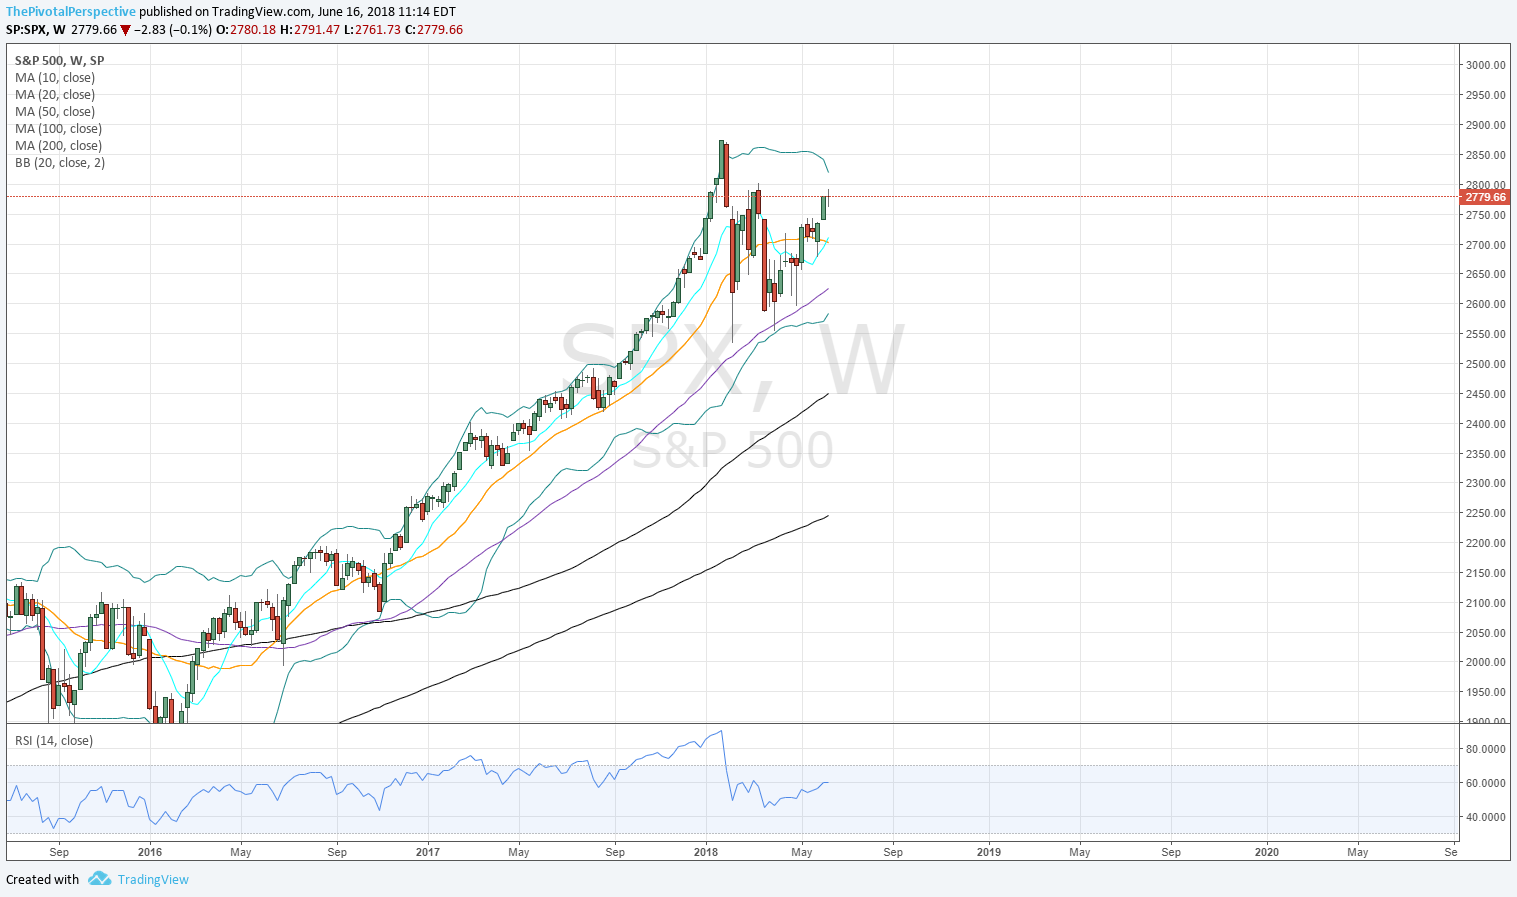
SPX W: Upper BB would seem to be capping upside here.
SPX W: But so far above HR1 which is positive; could reach YR1. If back under HR1 would look more bearish.
SPY D: SPY Ex-dividend move, but still above HR1 slightly.
ES U D: I don't like that rollover contracts with the 'wrong' yearly levels are still in play, but they are.
SPY 2H: Only a few 2 hours bars below weekly pivots since May 7.
SPX set sum: Upside seems to be limited although so far maintaining above HR1s means bulls keeping the ball. ES (U) YR1 also key level at 2790 to watch.


NDX / QQQ
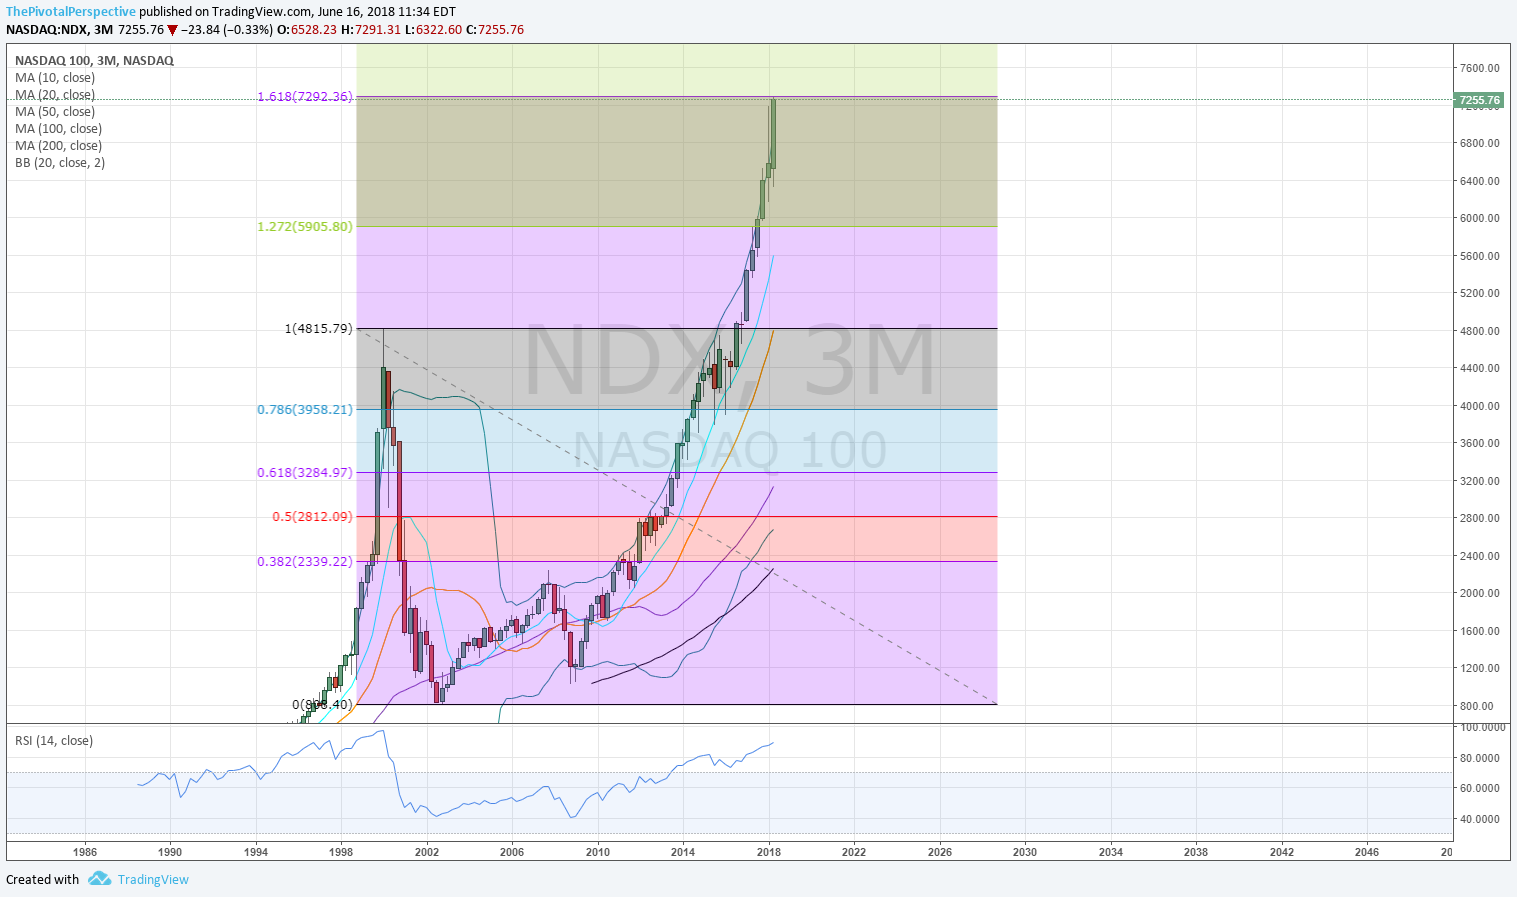
NDX Q: If time permits I'll do a study on how far highs and closes outside the bands - this has got to be rivaling late 90s.
NDX Q: Fib fans take note.
NDX W: Pushing the band.
NDX W: Blasted above YR1 and then through HR2.
QQQ D: 1 day bear wonder at March highs then hold HR2 QR1 as support and raced higher.
QQQ 2H: Momentum could be slowing just a little but that's all to say - incredible run the last 6 weeks.
NDX sum: Along with IWM the main index leader. Above earlier March 2018 highs, held above YR2 and QR1. Next pivot resistance is JunR2. Tech is going crazy compared to the other USA indexes but beware quarter end re-balancing which in Q2 often begins now, before the 7/4 holiday, as opposed to Q4/Q1 which begins after the winter break.


DJI / DIA
DJI W: Sharply falling upper BB 'should be' resistance.
DJI W: Bewteen long term levels (SPX testing that HR1 in comparison, and NDX above HR2!)
DIA D: Above all pivots; fell back under JunR1.
DIA sum: Obviously lagging.


RUT / IWM
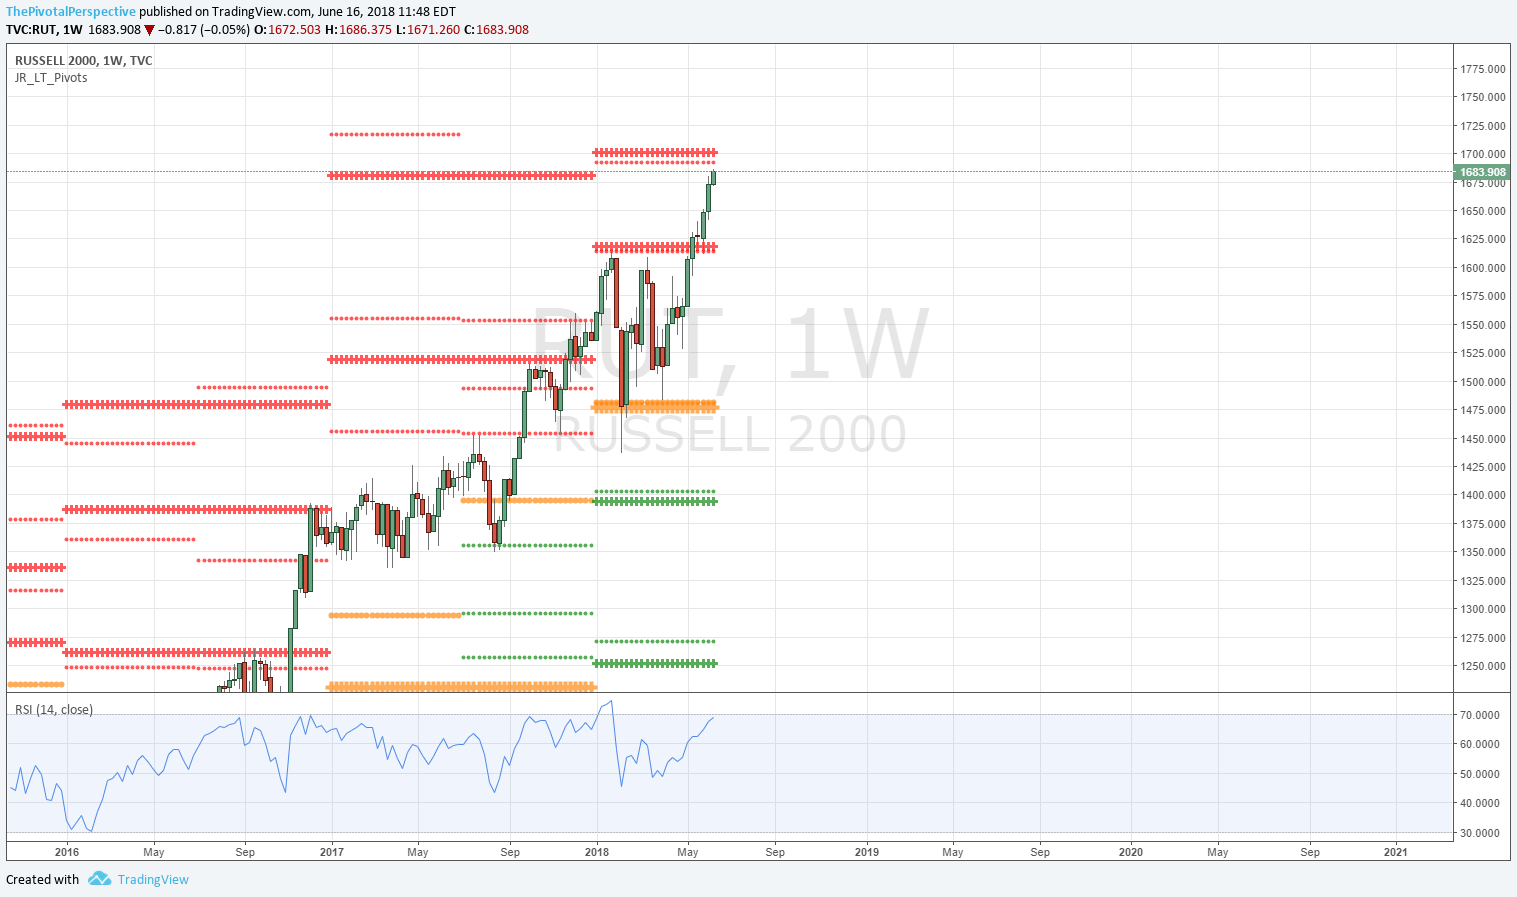
RUT Q: Might be the furthest outside the Q BB ever. Only 1997 Q3 looks like it could compare.
RUT W: 2 consecutive closes outside the BB is rare and often near trading tops.
RUT W: YR2 HR2 looking good to take gains and perhaps short.
IWM D: What a run above a rising 10MA every day but sonce since 5/4. Still I think YR2 stops the move.
RUT sum: Paying attention to leadership in April and May gave overweight to IWM. But now I think time to be locking in gains near HR2 / YR2 and could be speculative short.


NYA
W: Looks more like DJI.
D: 2 days above JunR1 and then that was it; back to QP.