Sum
First test of 2017 YP on CL1 contract was the plunge low and bounce last week. With monthly 20MA also nearby there is some chance of more bounce attempt. But given weakness of the 2016-17 bounce compared to the 2014-16 drop on the monthly chart, oil more likely going eventually lower even if YP holds here. We'll see.
First some long term charts of CL1 contract.
Quarterly
Back under 10MA, and below all the other MAs. On this view, there is nothing to stop this from going lower.
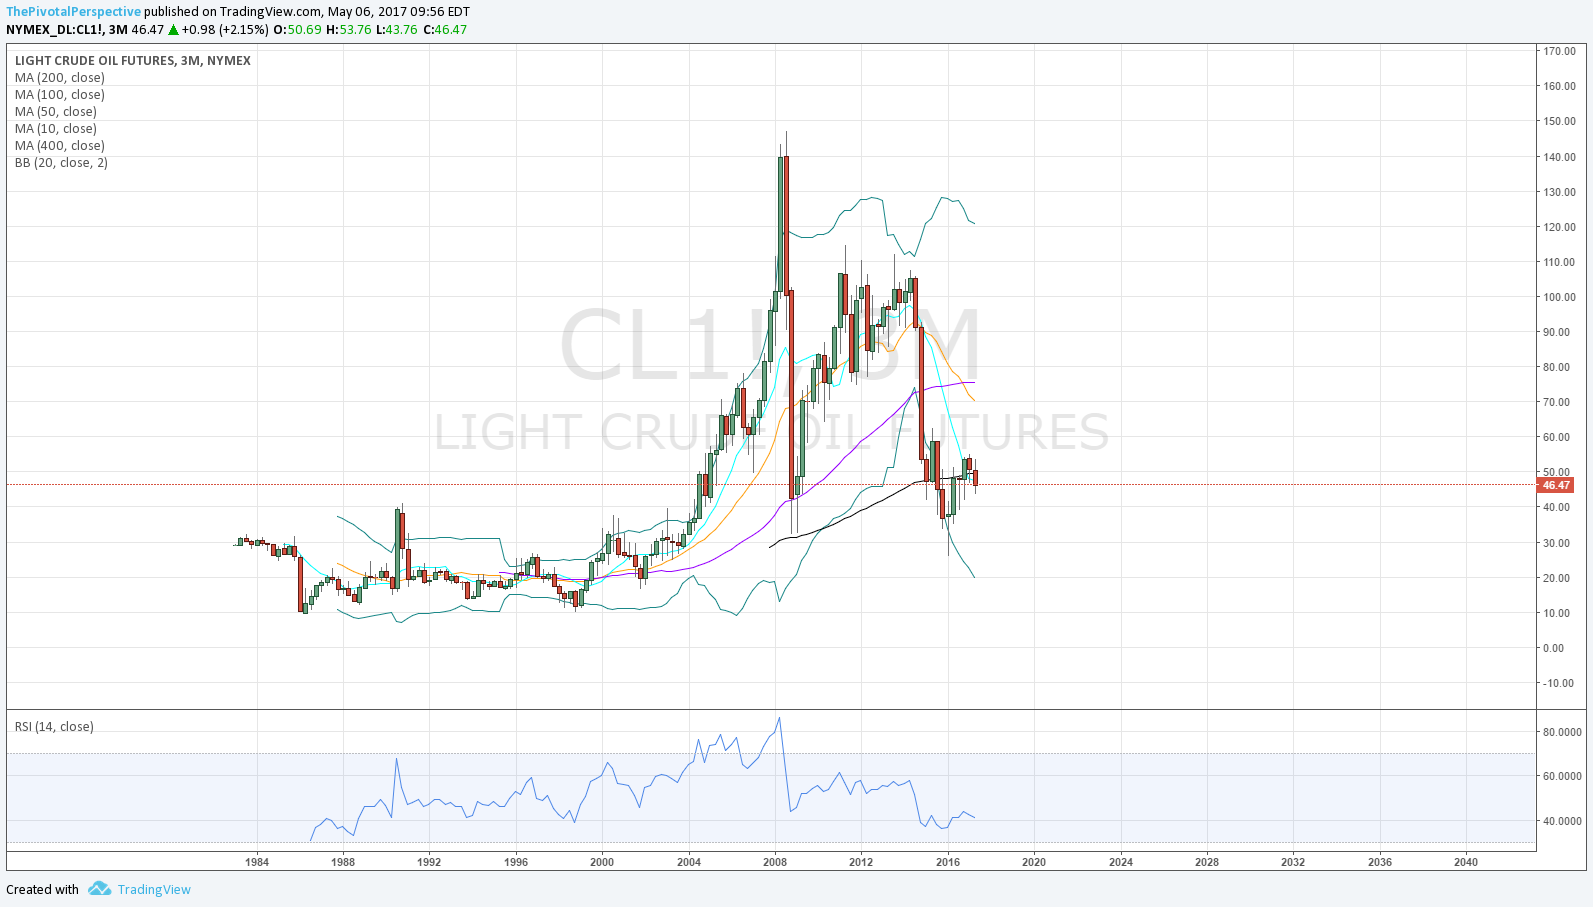
Monthly chart bit more chance of holding with 20MA testing. However, RSI tops at 50 area and weak bounce compared to drop does not make me very optimistic.

Weekly pivot chart
YP chopped in 2016 after YS1 was perfect low and YR1 near the high. Test of 2017 YP last week.

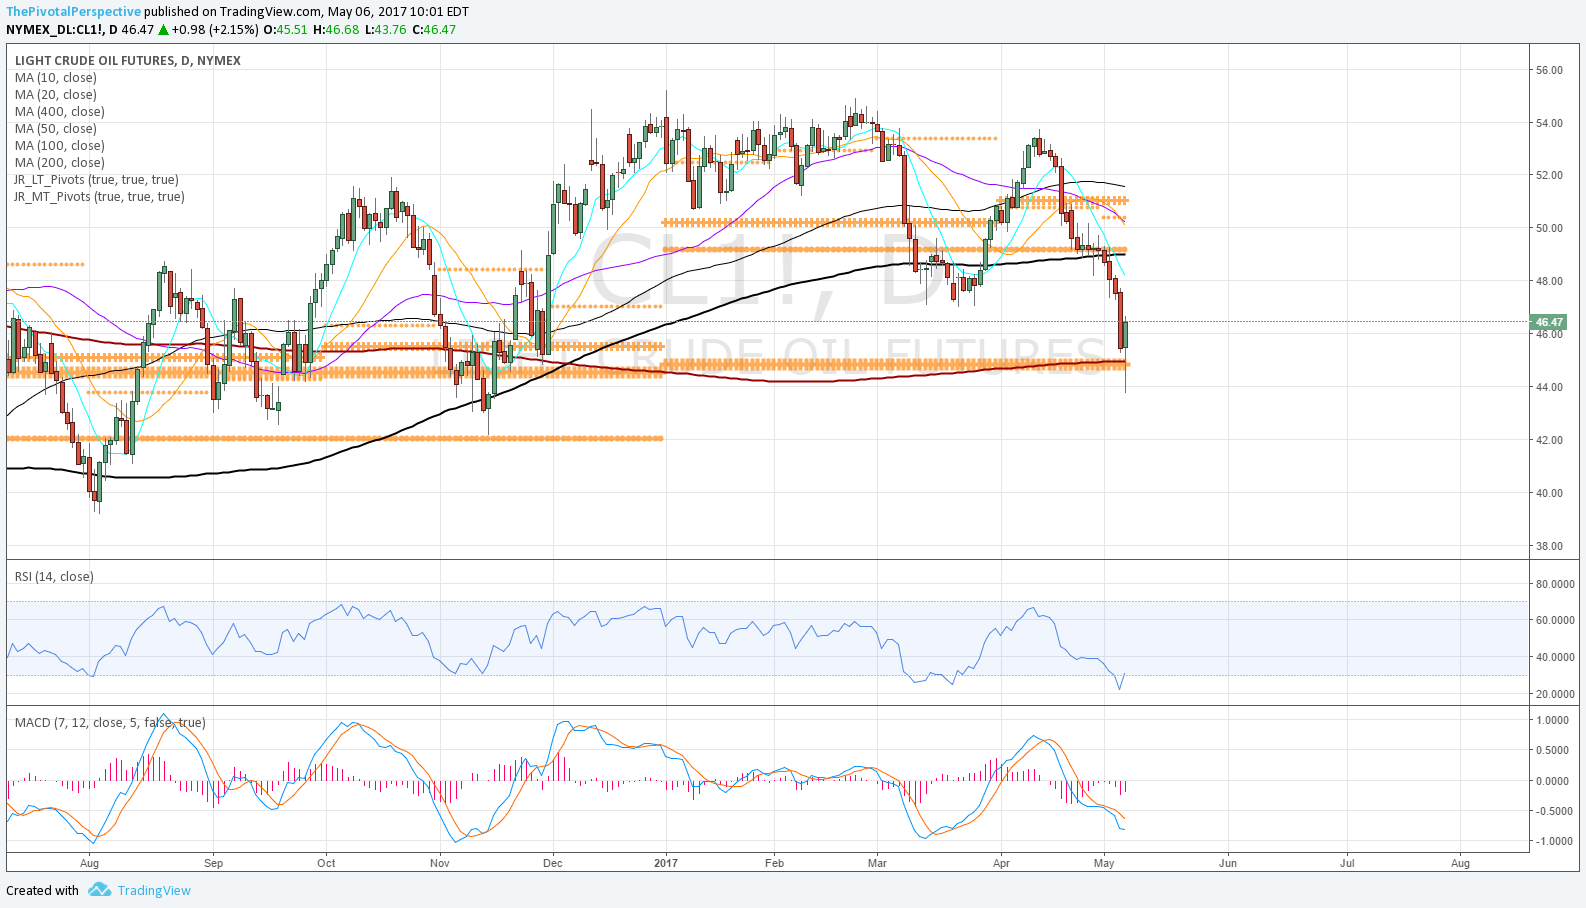
And here's the daily with MAs.