Sectors

Not comprehensive, just the ones I like to track and trade.
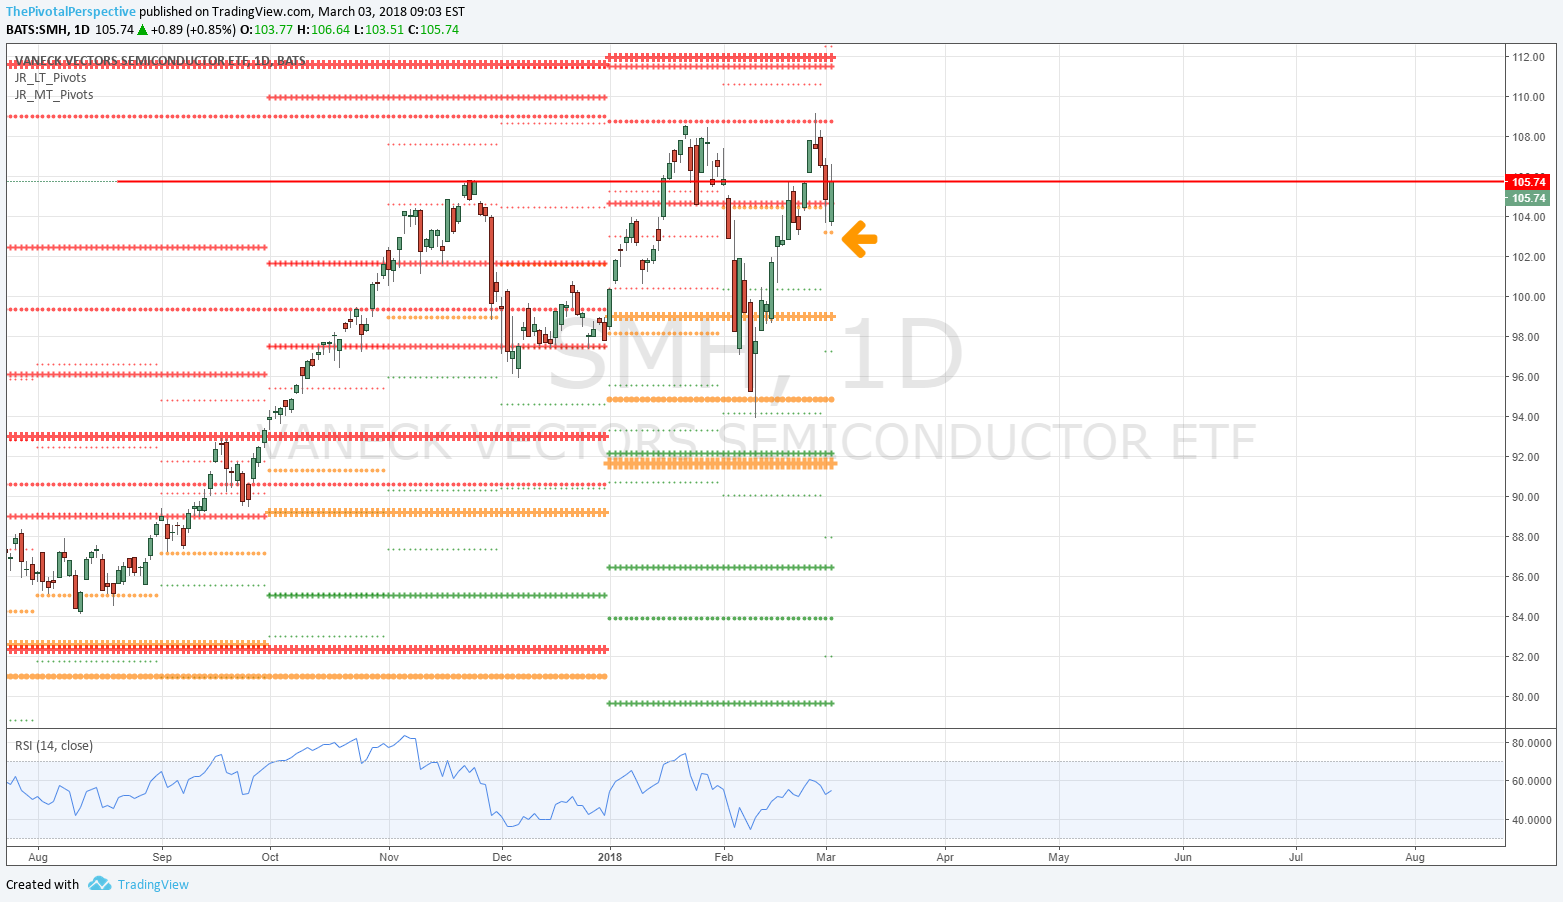
SOX
W: A few moves down from 2000 top but now 3rd time above. 
D: Sox mentioned as buy in 5/5 Total market view; now can hold above HR1 and watch what happens at the YR.
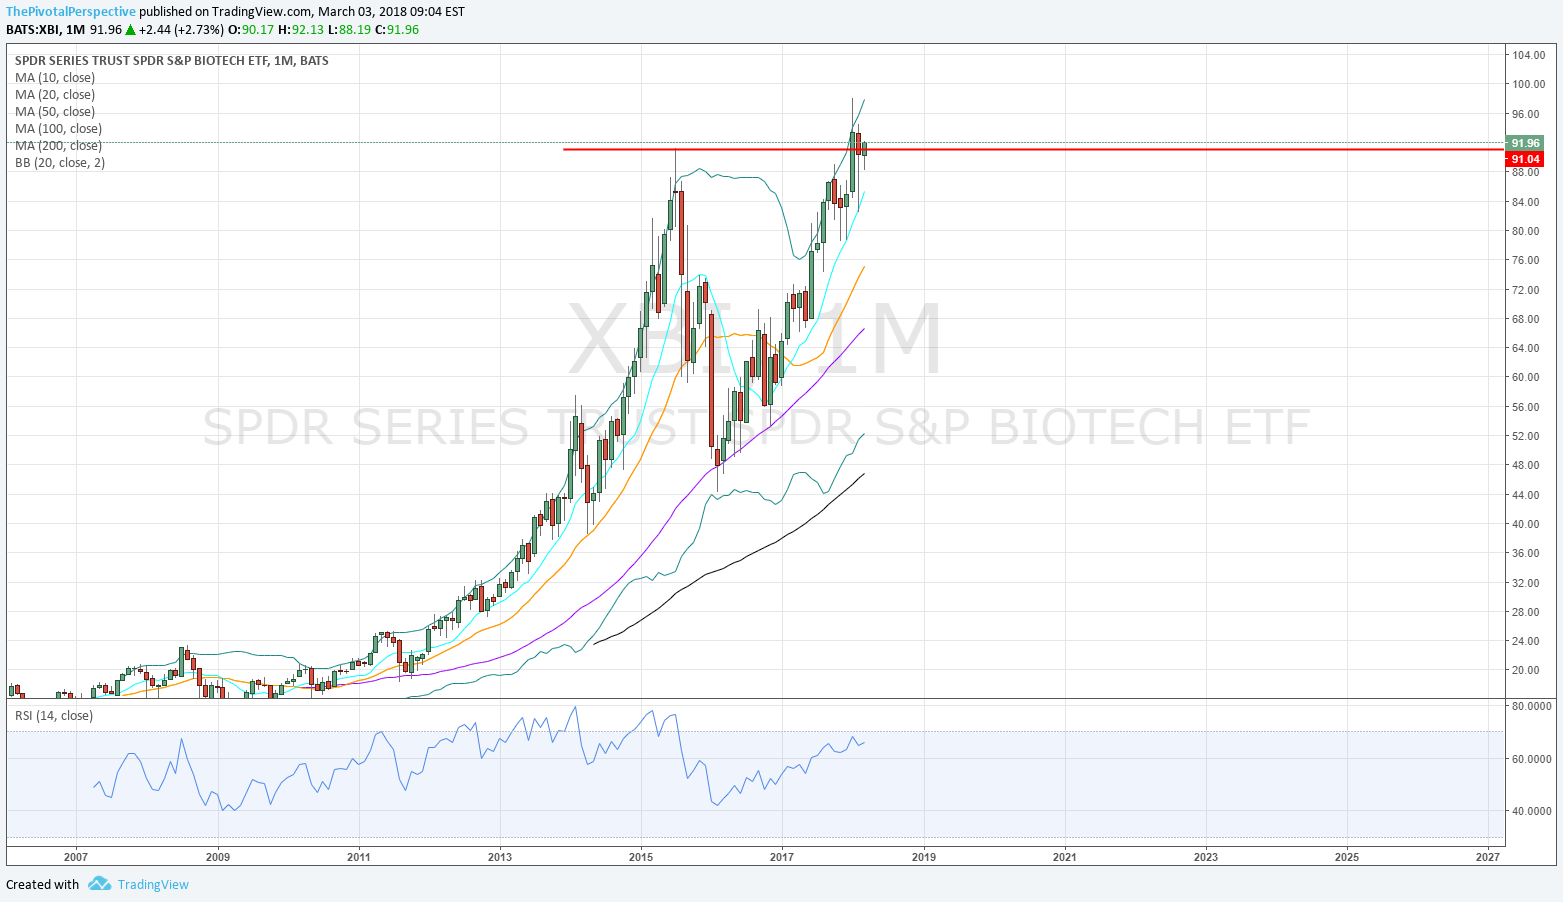
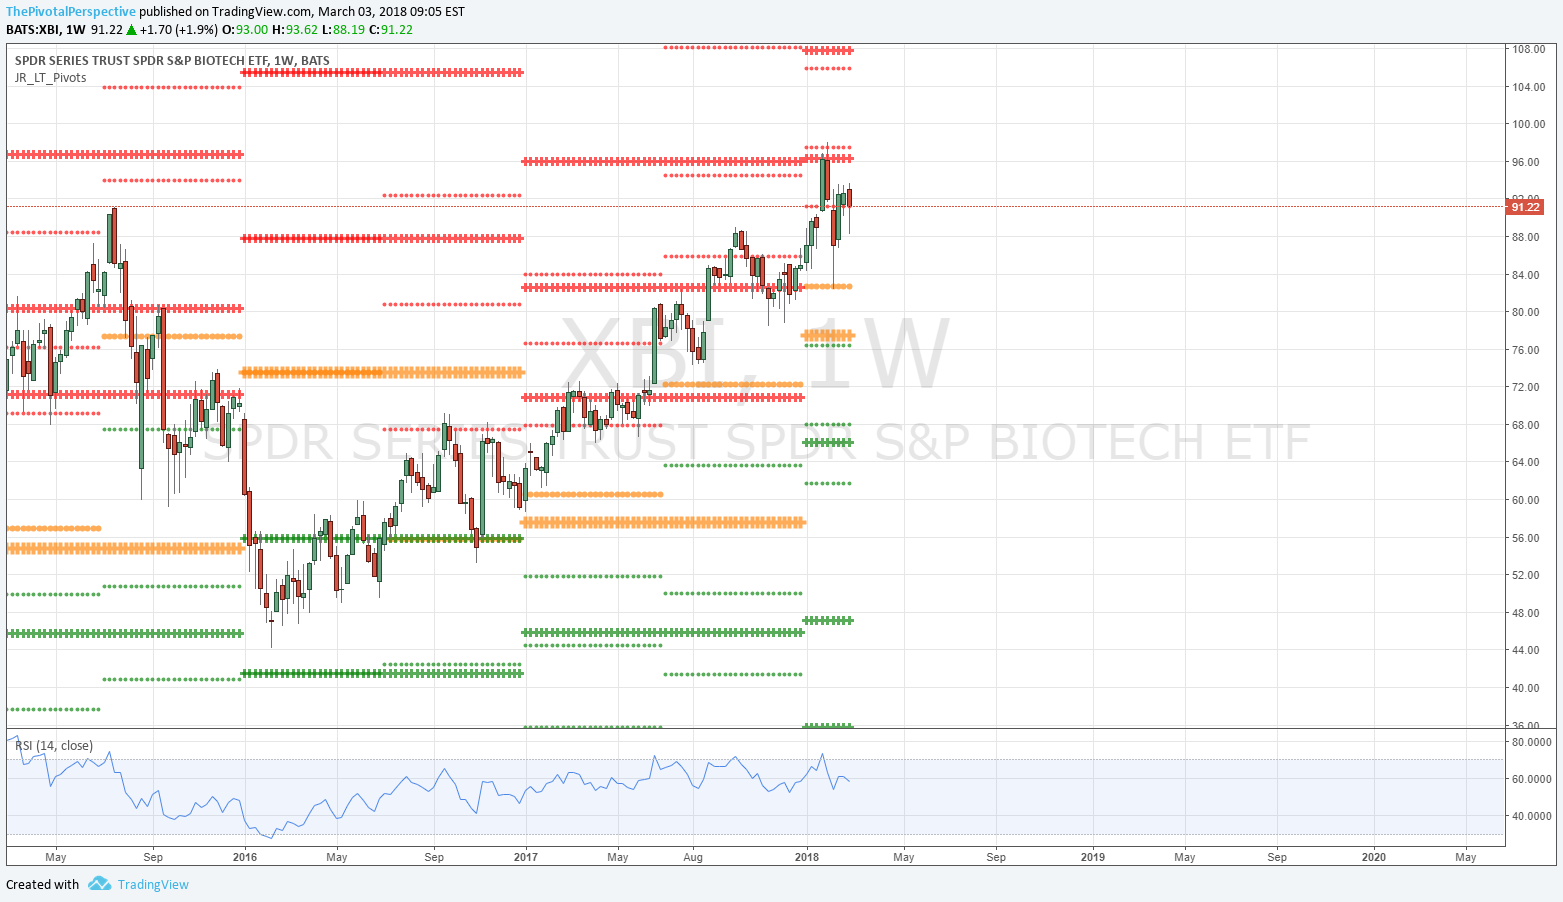
2 31 SOX W.png
2 32 SOX D.png

XBI
W: Also rallying above 2015 top for the 3rd time after a several weeks of struggle. 
D: 2 previous highs at HR2 YR1 cluster. Fast move up from recent low looks more likely to breakout above. 
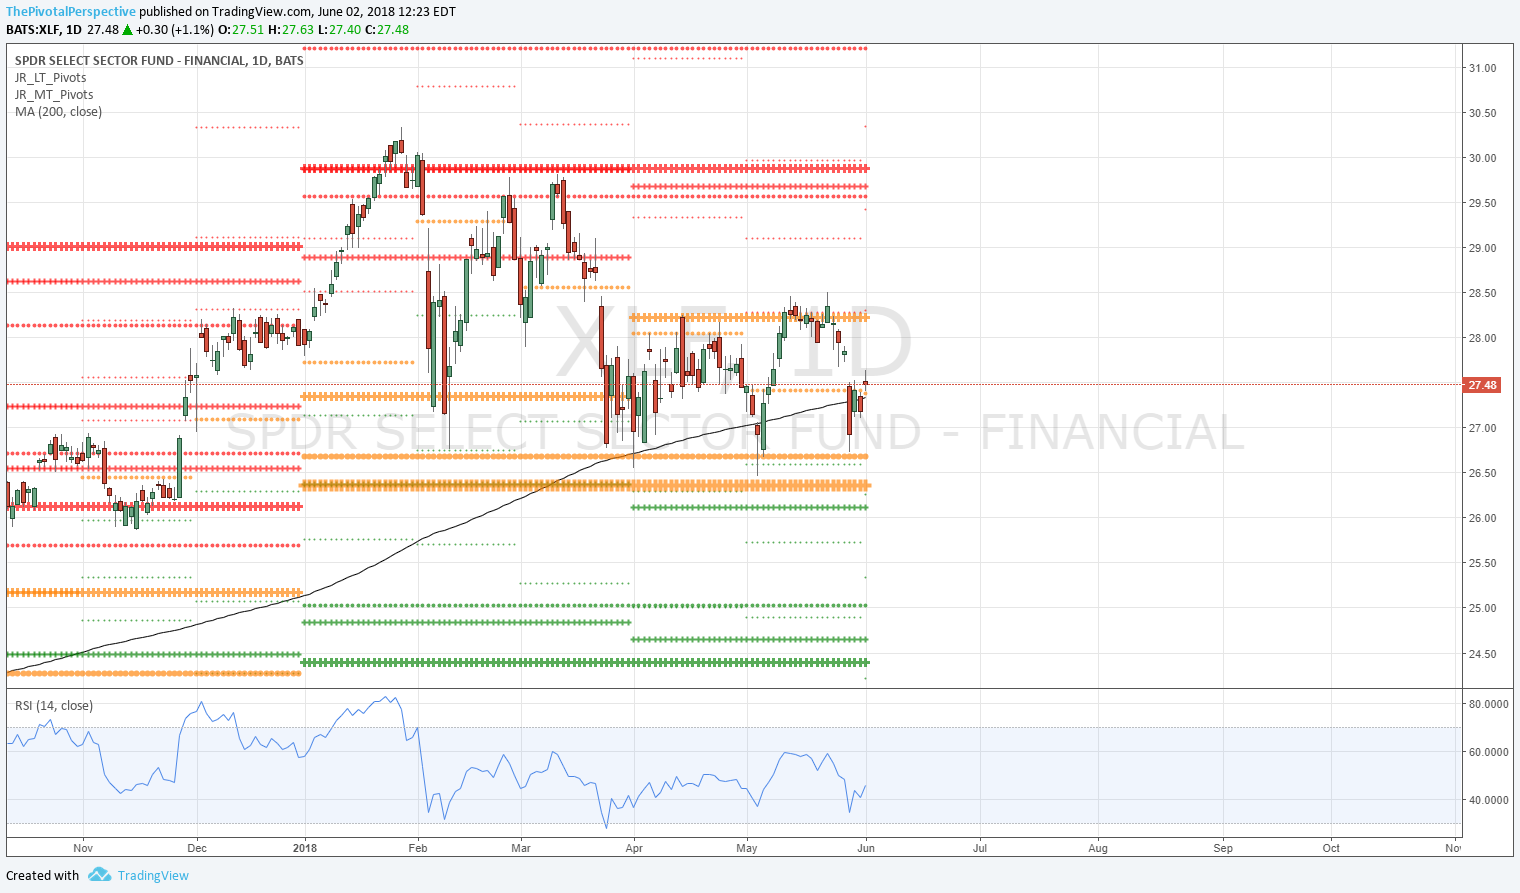
XLF
D: Well under QP, above JunP but if below that and D200MA would be easier short. 

2 35 XLF D.png

XLE
D: Power move when changed status above HP and then above YP 4/10-11 and straight up to YR1 followed by sharp pullback. 

2 36 XLE D.png

Sectors of note

Favorite trading sectors: SMH XBI XLF KRE (recent add) and XLE.

Tech clear leader with QQQ, SMH and XBI all above all pivots. But the sectors battling and key prior highs. XLF giving up while KRE strengthens echoes the IWM theme. XLE avoid or short. 

SMH
Q: Battle at 2000 top. SOX index is similar. 
W: HR1 high twice, HP low. 
D: Holding above all pivots, but red line at 2000 highs also worth watching. 

XBI
XBI M: Battle at 2015 high.
XBI W: HR2 / YR1 high, HP low; testing HR1. 
XBI D: Above all pivots and just fractionally above 2015 high of 91.11. Don't know why different prices on these charts!

3 25 XBI M.png
3 26 XBI W.png

XLF
Q: Wall Street's favorite sector resistance at 2007 quarterly close high. 
W: YR1 resistance 2nd time. 
D: Holding positive for year but under MarP. 

3 29 XLF W.png
3 30 XLF D.png

KRE
D: YR1 resistance all year but above all pivots and could go for highs again. 

3 31 KRE D.png

XLE
D: Under all pivots and significantly negative YTD. Avoid. Not sure worth shorting with oil holding up because these should be somewhat correlated. That said under all pivots is always a short consideration.