Instead of detail on USA mains and sectors, with all the pivots shifting over, I'm going to post long term charts and the projected pivot status. A gap up or down could change things though.
The larger message is that indexes are mixed, with DIA and NYA glaringly weak amoung the USA mains. No pure leader with both IWM and QQQ set to open below MPs.
In sectors a surprise turn - SMH set to open below HP, QP and MP, the first move below a HP in many months - the last time this occurred was the start of the -20% drop into Feb 2016 lows (although many other indexes also experiencing long term weakness as well). This is happening as XLE just fractionally below MP and any higher will be above all pivots, once of the few stock indexes I track to even be close to that status.
SPX / SPY
SPX Q: Divergences building. 2017Q4 high and close outside BB; 2018Q1 high well outside BB and close within; 2018Q2 high and close inside BB.
SPX M: Holding 10MA for 5 bars but glaring divergence on RSI.
SPY set to open above YP, HP and QP; below MP.


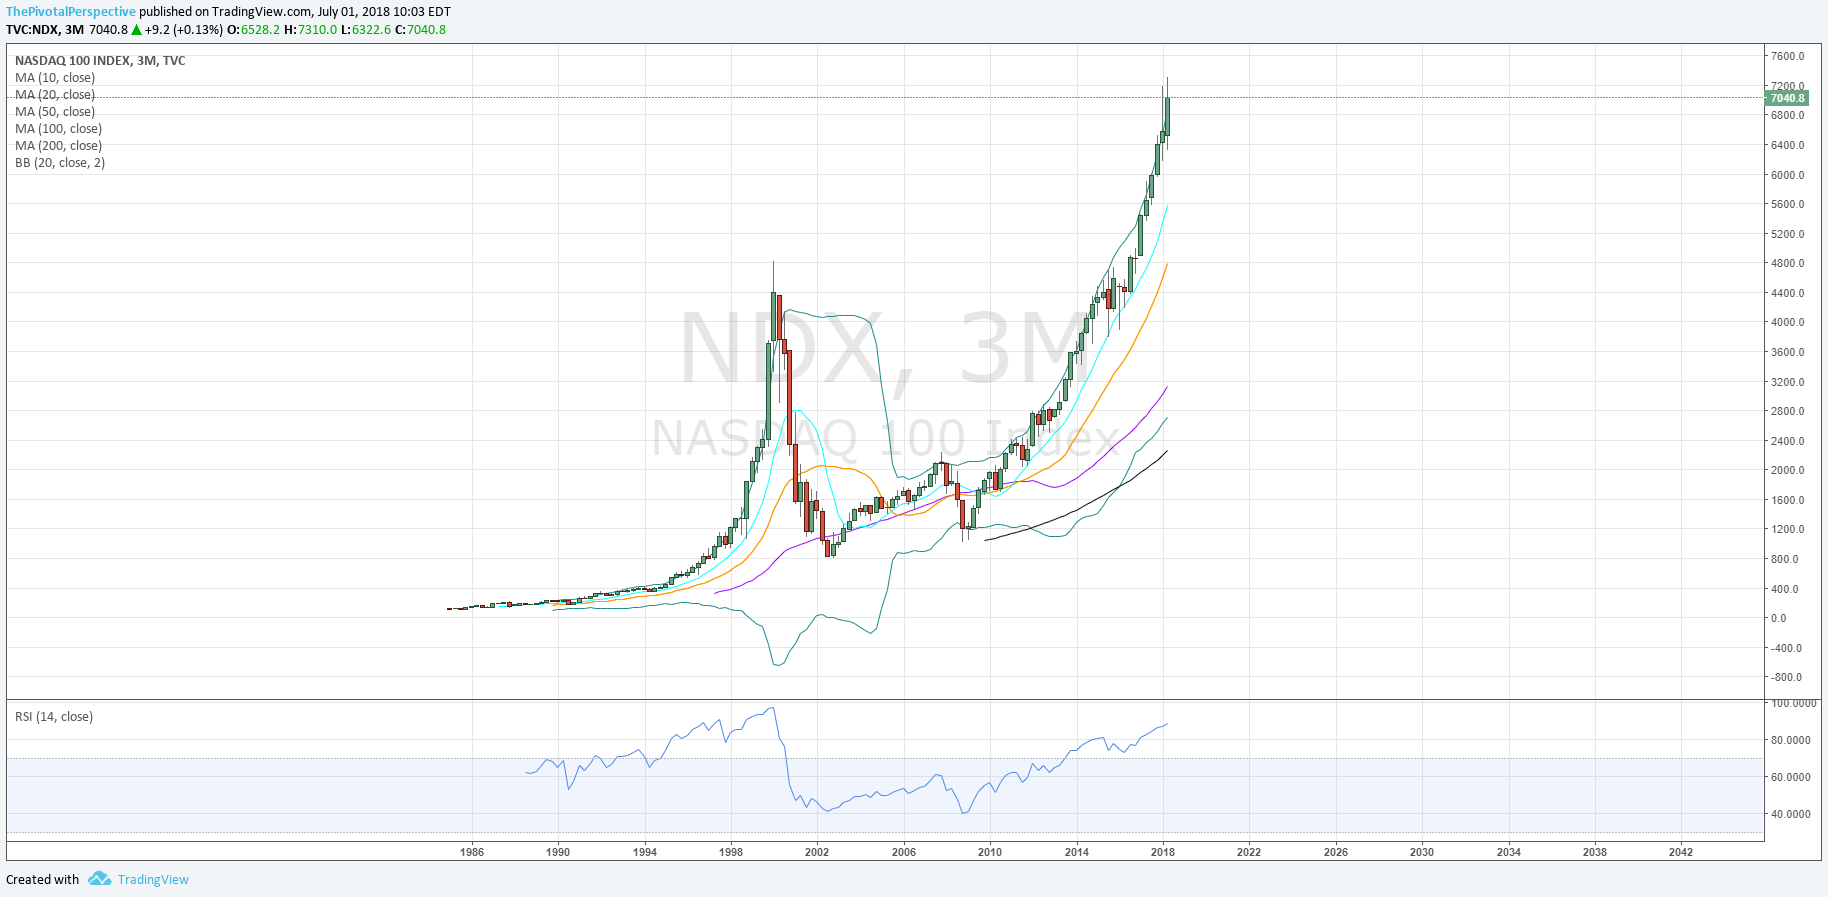
NDX
Q: Still high and close outside BB. Might smart money be selling up here with Q RSI approaching 90? 1929 DJI Q RSI top 91 FWIW. Only the 90s had higher on NDX, 98Q4 to 00Q1.
Q: 18 year 1.618!
M: Textbook BB divergence top - Jan high and close outside BB, Mar high outside but close inside, June top high and close inside BB. Uptrends slow before reversing. This is what we are seeing now, as reflected in RSI peak at 85 and June close now at 77.5.
QQQ set to open above YP, HP and QP; below MP.


DJI
Q: After 6 consecutive closes outside the BB (even the Q2 down bar), a close clearly inside the BB. This may or may not be the absolute bull market high but it sure invites selling as the next move - see 1998 Q2.
M: RSI divergence! But somehow still holding to M10MA.
DJI set to open above YP, but below HP, QP and MP. Weak!


NYA
Q: BB and RSI divergence.
M: 2 consecutive closes under the 10MA, and highlighting the 10MA here. Nice smooth runs when above; close below is sideways chop at best like 1998, deeper pullback in struggling uptrend like 2010-2011 and 2014-15, or worse like 2000-02 and 2007-09. But smooth uptrend phase - while it potentially could recover - is now over.
Set to open above YP, but below HP QP and MP (like DIA).


SECTORS
SOX
Q: 3 bars near but not closing above the 2000 top!
M: Still above rising 10MA - interesting level to watch.
SMH set to open below HP QP and MP! Seems hard to believe after such a run but true. This would be the first move below a HP in SMH since 12/2015 which preceded the ~-20% decline to Feb 2016 lows.


XBI
Q: BB and RSI divergence top.
Set to open above YP HP and QP; below MP.

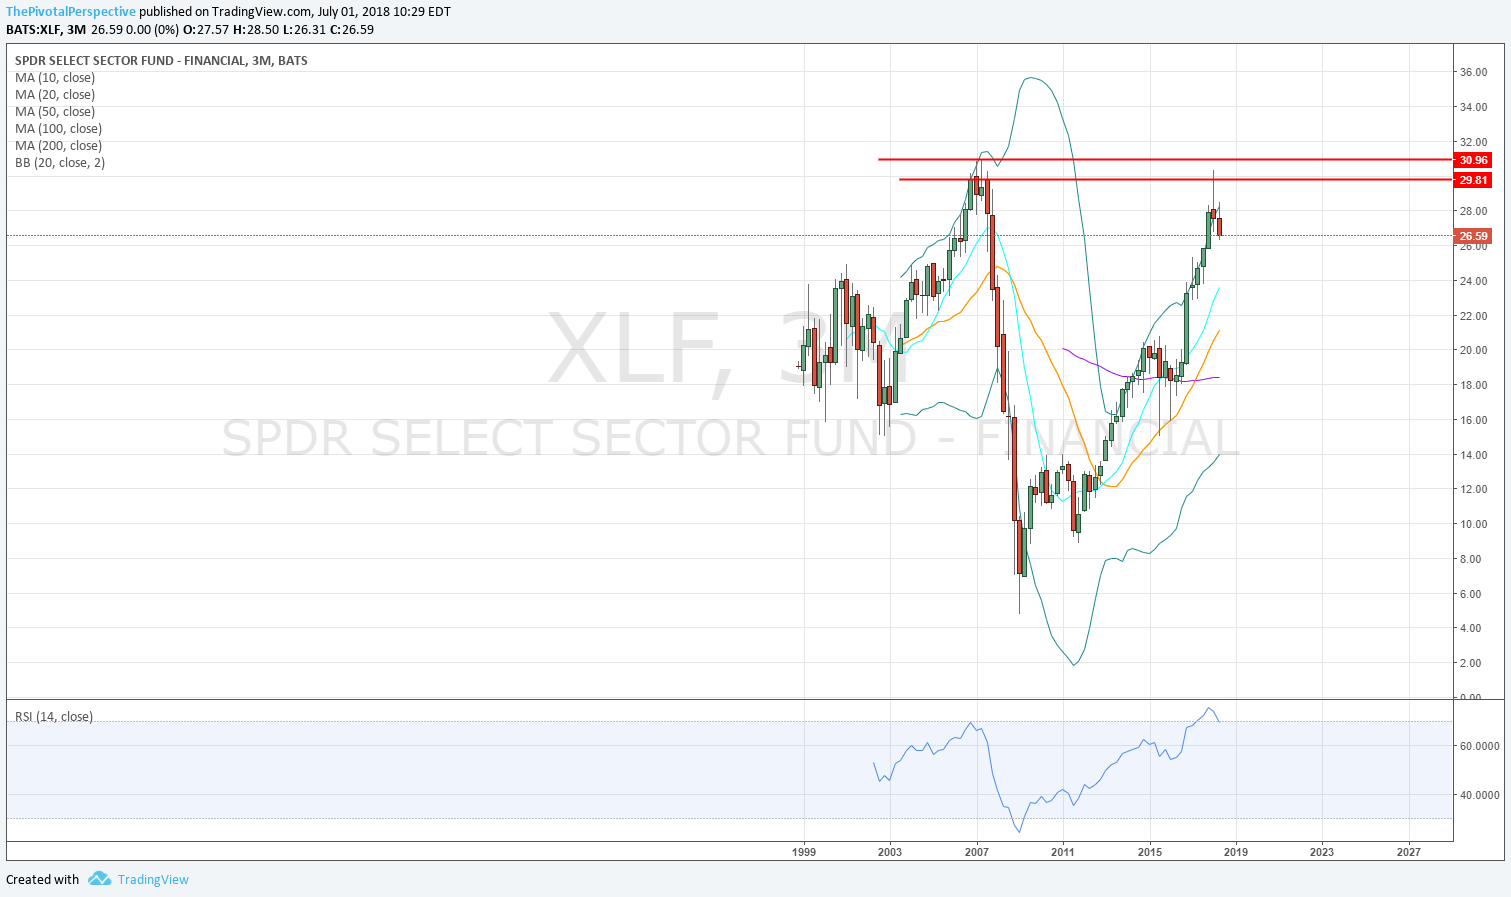
XLF
Q: Stopped at the 2007 high close bar and didn't even reach the 2007 top.
M: 2 bars below the 10MA. Might bounce from 20MA though.
Set to open above YP, but below HP, QP and MP.

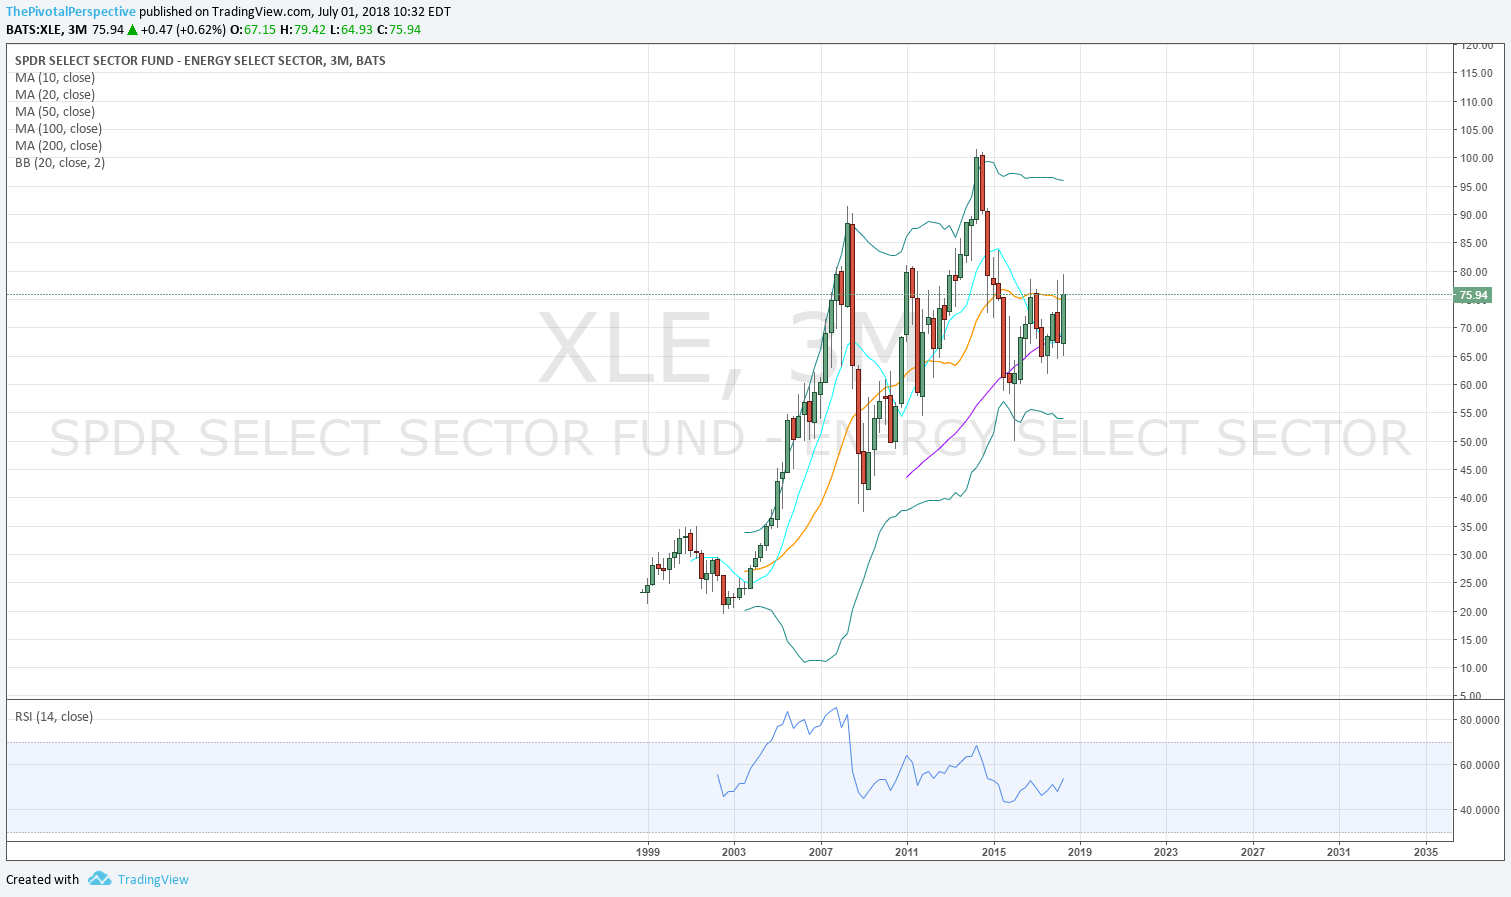
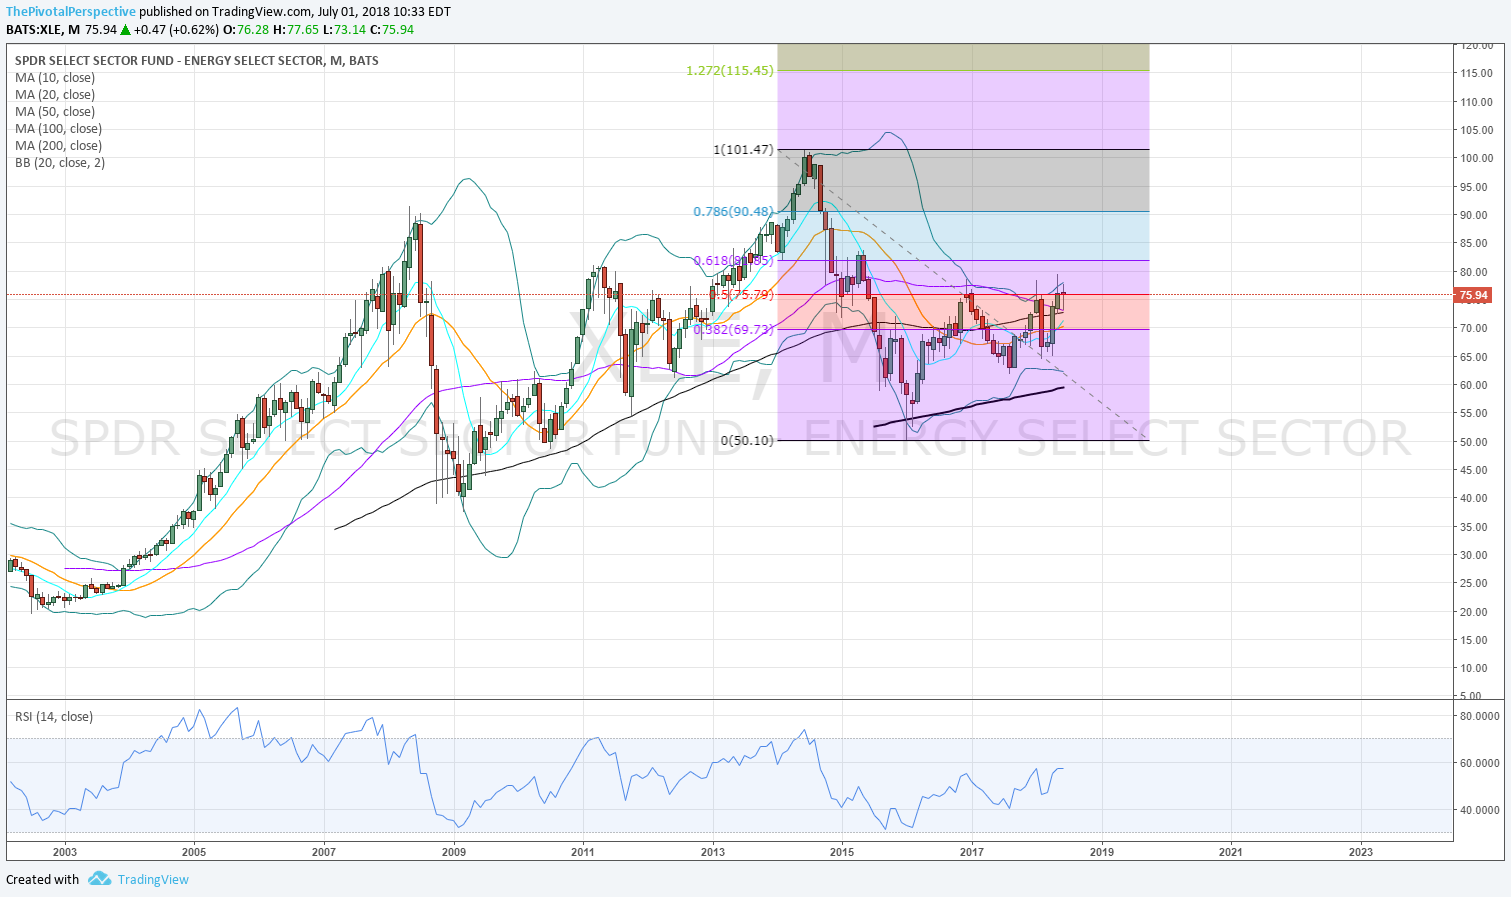
XLE
Q: Close above 20MA for the first time since oil crash of 2014-15. This chart could see top of bB again near 95.
M: Seems stuck near the 50% but above all MAs and RSI not near OB.
Set to open above YP, HP and QP; fractionally below MP.