Well I am just happening to notice a few things here...
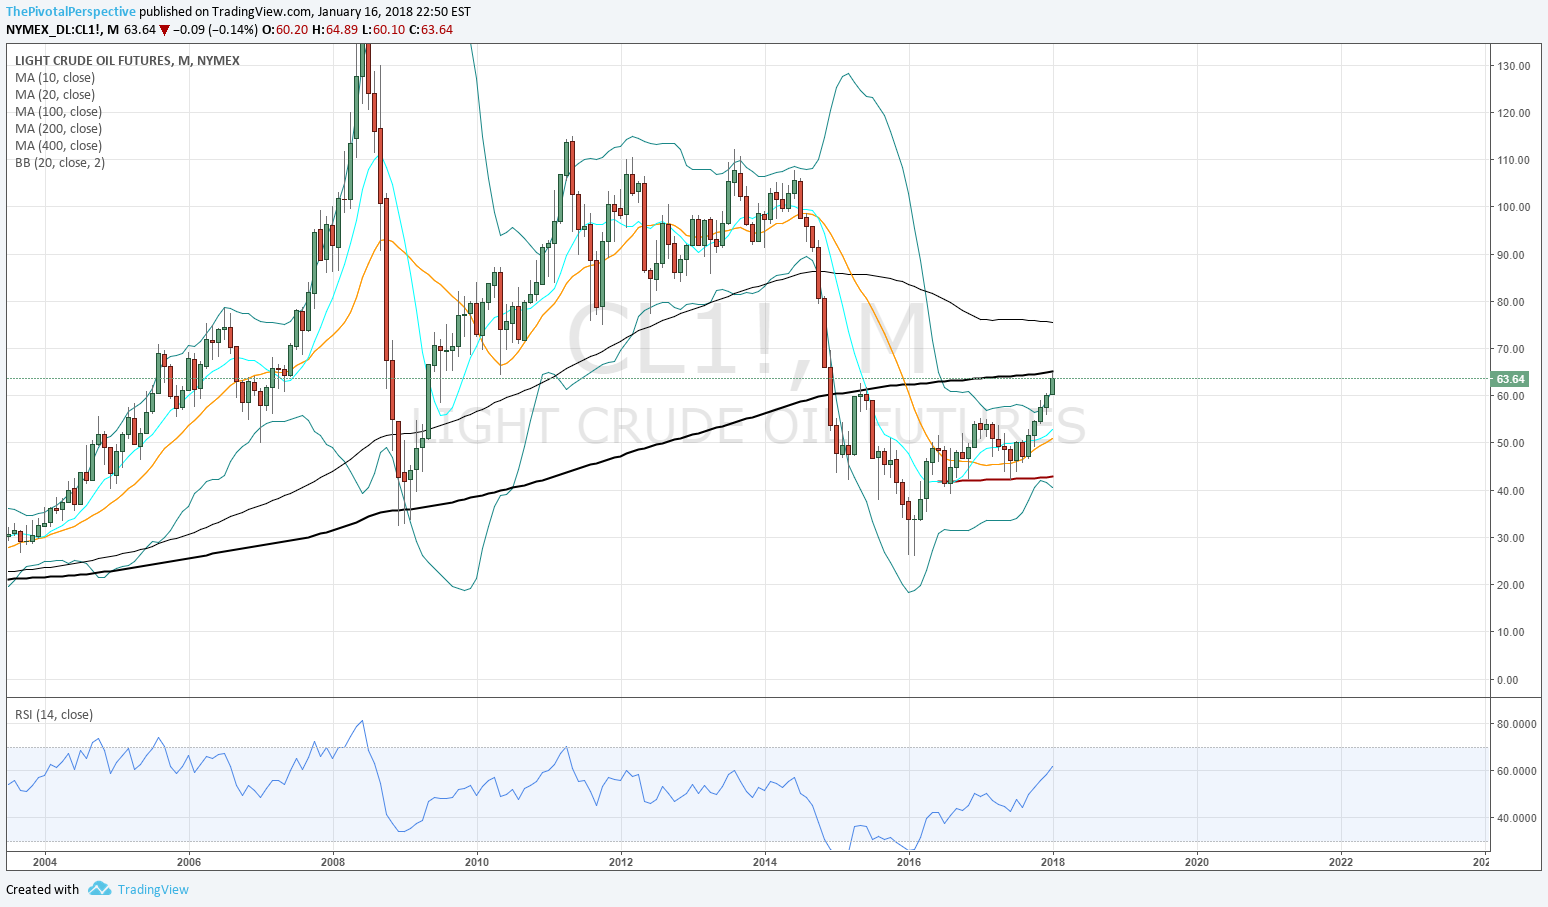
CL1 continuous contract quarterly chart at falling 20MA resistance

CL1 M
On 200MA.
CL1 W
Highest weekly RSI this decade. Last seen with oil above 100.

Cl1 D
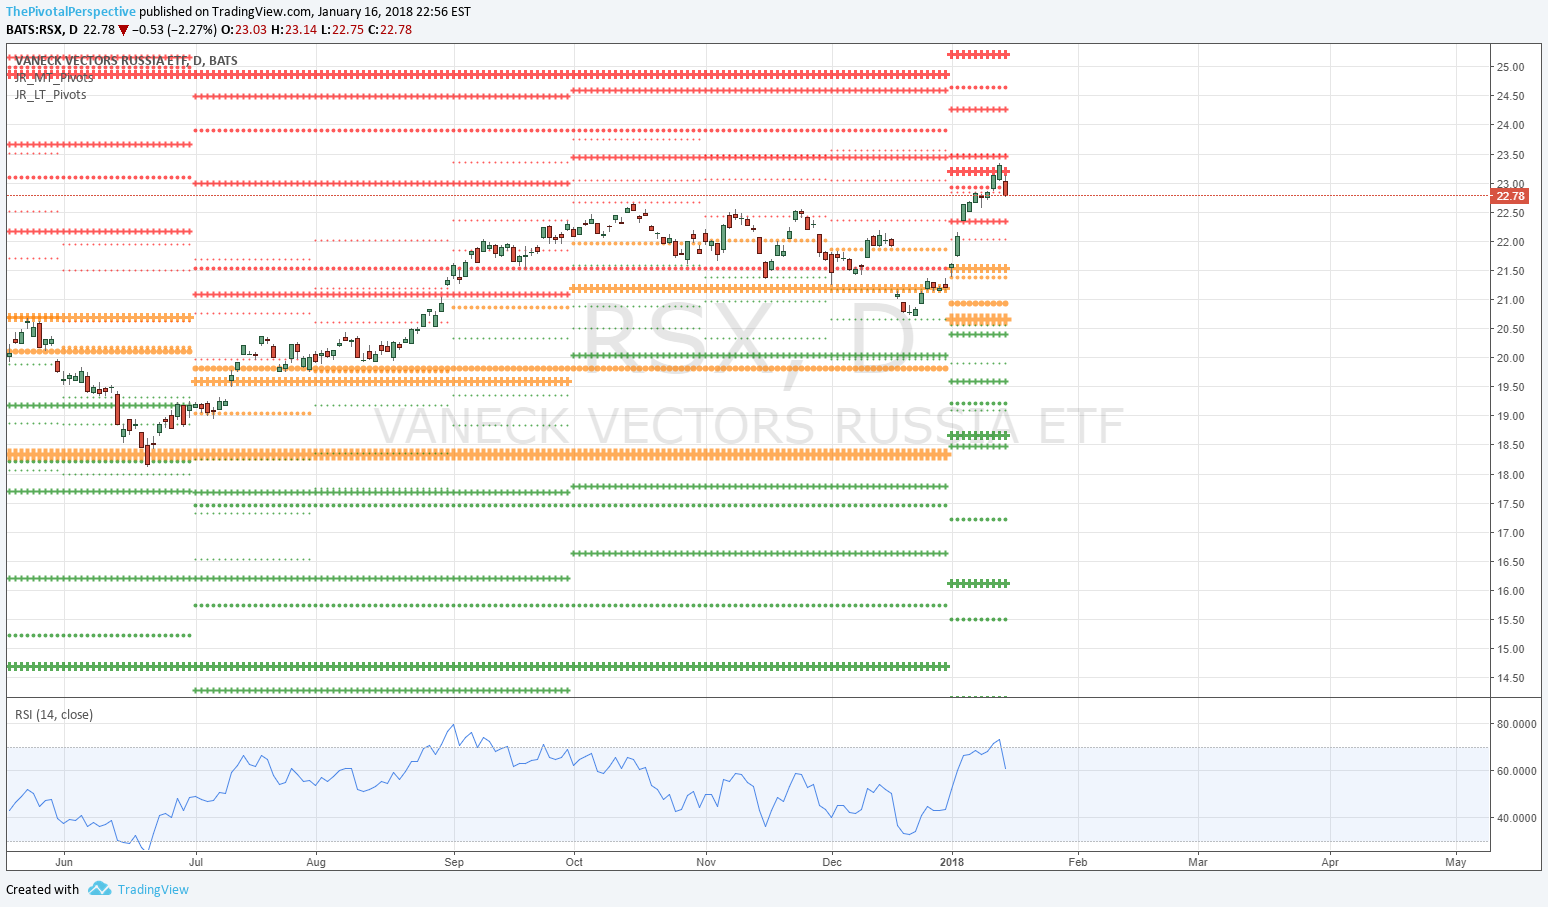
Near enough to YR1 / 1HR1 combo; Q1R1 rejection seems about to happen.

RSX
Maybe this is the best vehicle with YR1 and 1HR1 rejections on same day.