Technicals vary on oil depending on whether you are looking at current month futures, continuous futures, or the ETF. Let's check them out.
Oil is knocking on the door of major move up. Given higher timeframe charts and timing, along with mean reversion play of tech weakening, this could be worth a significant position.
CL V
Volume peaked in August. Let's move on.

CL X
Increasing volume so we are good. Testing YP from below. Above 50.93 on this contract could be big.

CL Z
Somewhat less volume than current X contract, but end of quarter. Also testing YP from below - 50.77 on this version.

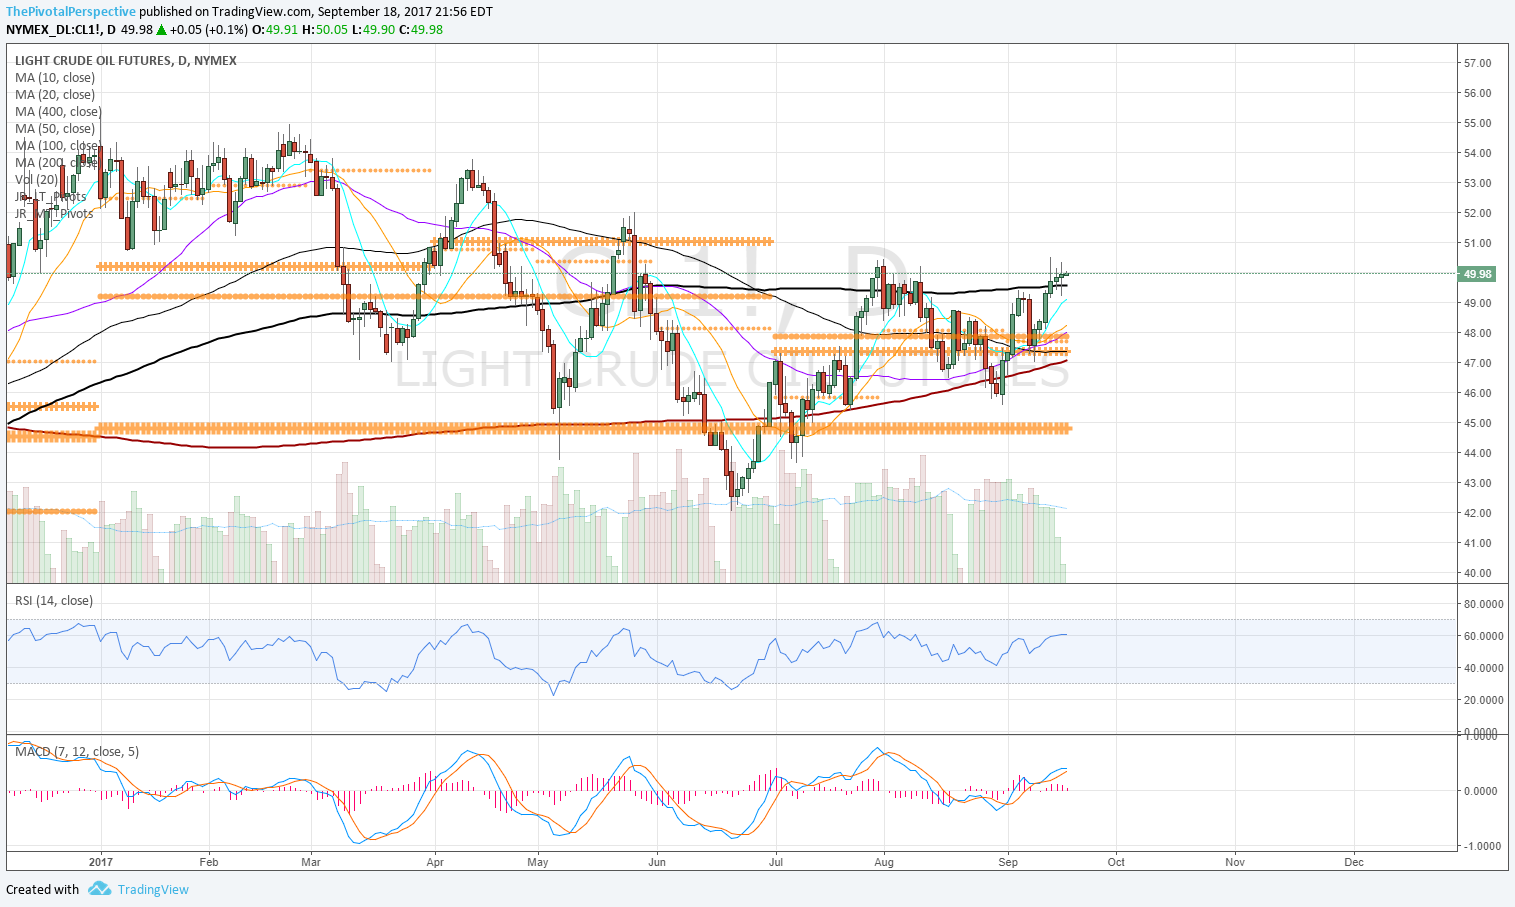
CL 1
Already above all pivots most recently from 9/11. CL1 has reached this status more than a handful of times this year, only to disappoint.

CL 1
Looks a lot better with moving averages - Above 200MA!
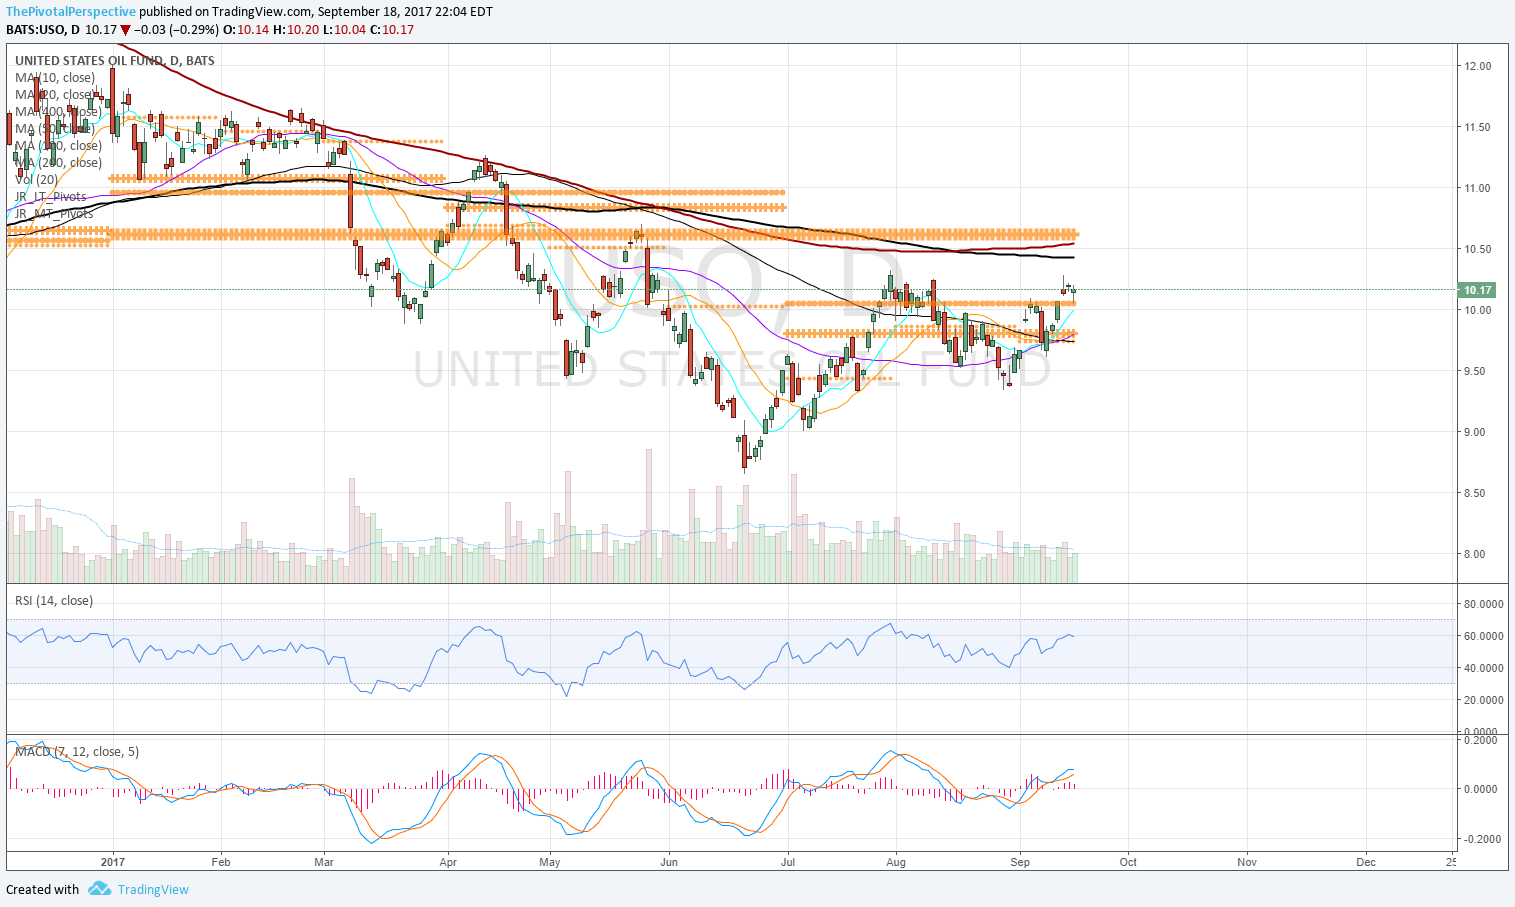
USO
Looks to be about the 3rd time above the 2HP with some chop in August. If this can hold as support then we should see a test of D200MA at least at 10.42 and then possibly the YP area at 10.61. This is decent risk - reward.
Now, consider monthly and weekly charts on USO.
USO M
Lower BB tag, 8/2017 close higher than 6/2017, and making another rally attempt.

USO W
Bar above a rising 10MA and 20MA, still below falling 50MA and 100MA. MACD 5th time positive since the crash lows.
