Sum
Safe havens looked threatening to me a week ago: VIX was finding support at its D200MA, XIV below its monthly pivot, GLD breaking out above YR1, GDX moving well, TLT at highs for the year and HYG breaking down under Q3P. To be fair, VIX pivots had it right and stayed under 2HP and Q3P on all trouble spots since 8/22.
Last week many of those concerns vanished 9/11-12 with XIV back above all pivots 9/11, AGG under its SepP 9/12 and HYG above all pivots also on 9/12.
GLD looks to have put in a key high with YR1 and Q3R2 rejection, but still above all pivots and rising 20MA so may come back. TLT also recovered its YP after a 1 day slight break. In general, safe havens most especially VIX and XIV confirmed risk on 9/11+. Exits are trickier than entries - see GLD for more detail - on 9/11 I said err on side of taking gains on GLD (buy rec from 7/11).
VIX
W: Above 2HP only 2 bars, 8/7 & 8/14; subsequent bars poked above but closed below.
D: Below all pivots on daily close from 8/22 on.
D: Watch the lower BB this coming week for tag and reversal.
VIX again showed why I start with this as supplemental indicator - back under all pivots 8/22 on daily close and remained that condition despite several pokes above. Notably, VIX fell back under 2HP and Q3P on 8/29, 9/5 and 9/8. For next move, wathcing lower daily BB for tag and reversal.


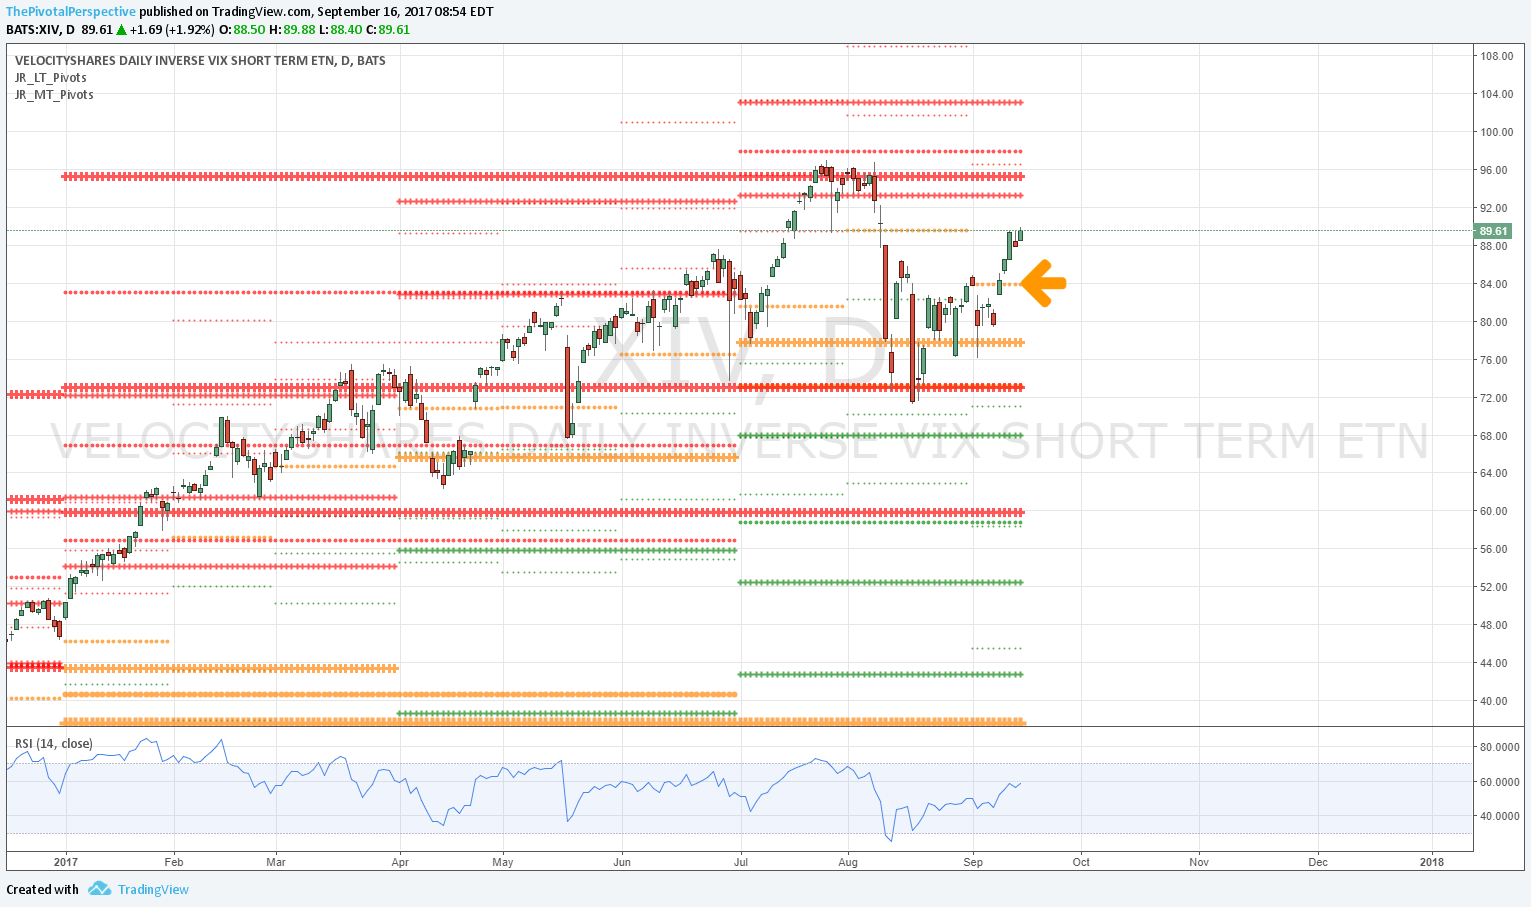
XIV
W: High on YR3, recent pullback lows on YR2.
D: Back above all pivots on 9/11.

TLT
W: Another sizeable drop after poking outside weekly BB. Also near 50% bounce on the 2017 highs.
W: Holding YP.
D: MACD negative, and under 10 and 20MA.
TLT: Near 50% from 2016 high to 2017 low on the recent hgh. YP holding and will be interesting level to watch this week. If stocks fade, this 'should' bounce.


AGG
Under SepP 9/12 on.

HYG
Above all pivots 9/12 on.

GLD
W: Falling back inside BB after 2 bar overshoot.
W: YR1 rejection after 1 bar above.
D: Q3R2 rejection; SepR1 on the high.
D: Chart including usual MAs and "chandelier exit" system in red.
GLD buy rec 7/11, sell rec 9/11-13.
Sum: Falling back inside weekly BB and under YR1, but still above all pivots and all rising MAs could try to come back. Since 2011 high, overshoots of weekly BBs have been rare and most have been near key trading highs. Exits trickier than entries, but given YR1 rejection, weekly Bollinger band, Q3R2 level also in play, i erred on side of taking nice profits from the 7/11 buy. If following system of 2 bars under 10MA, then also out. Rising 20MA and Chandelier are still in the trade, and above all pivots also still in trade - case to be made for holding half. Monthly chart look to me settles any question - exit was the right decision with resistance at 2016 monthly close high and 100MA.


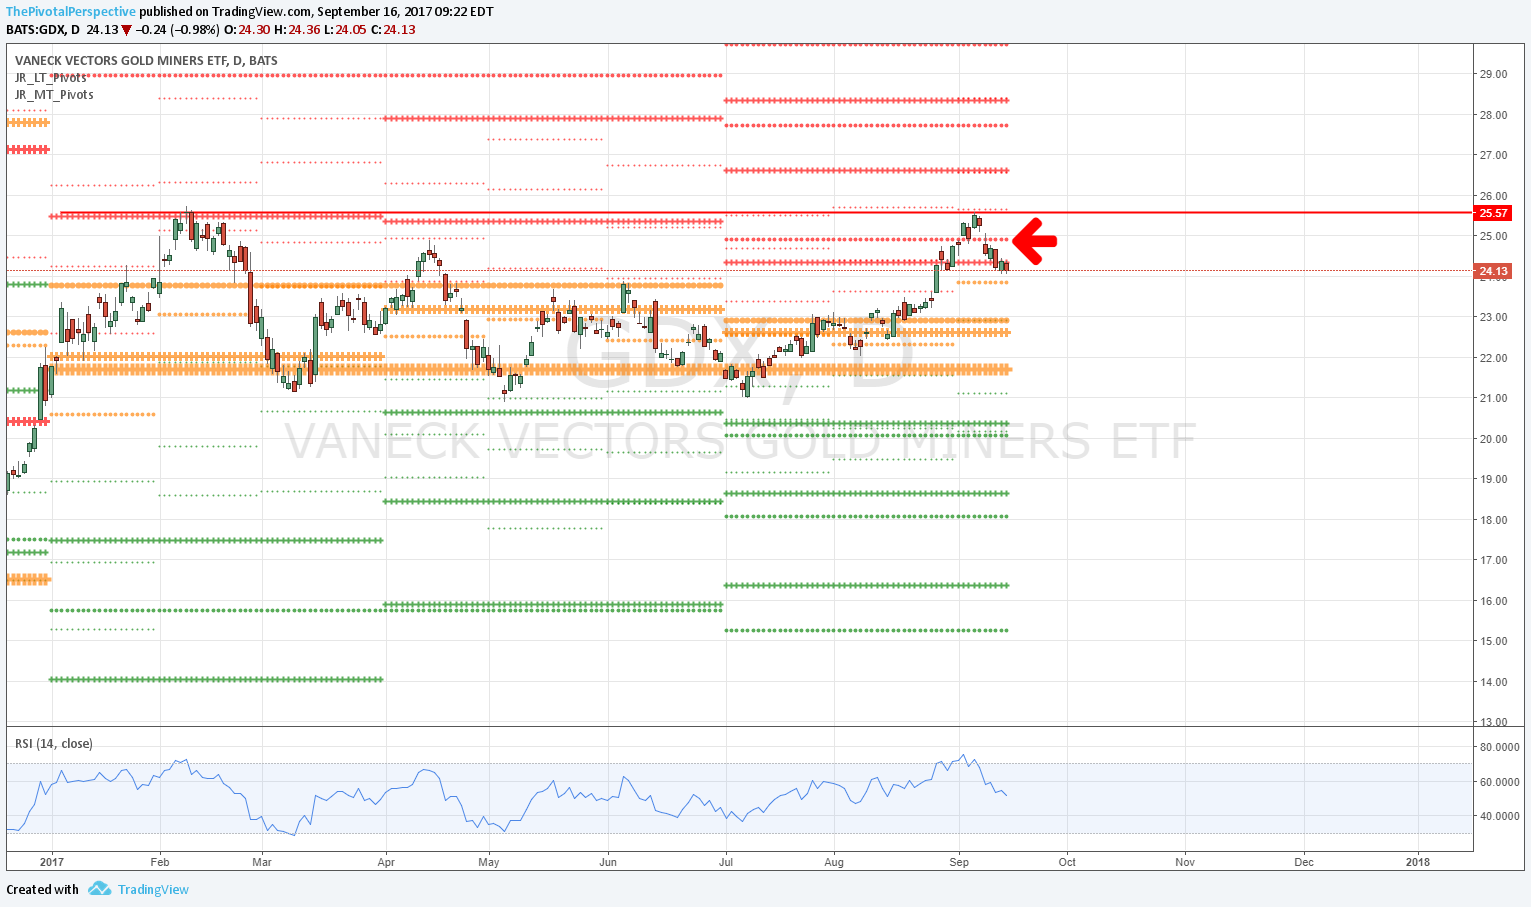
GDX
Stopped at 2017 Feb highs (red horizontal). 2HR1 rejection showed with red arrow.
Still above all pivots, slight break of D20.