If doing this work for a fund, for sure would cover the full array of the SPX sectors. But for trading purposes, I am keeping to SMH semi-conductors, XBI biotechs, XLF financials, and XLE energy.
I'm not really clear on signals here. But let's keep it simple and hold the SMH short if below the YR1, and see where the other pivots on XLF come in. Likely above 2HP and Q3P and JulP.
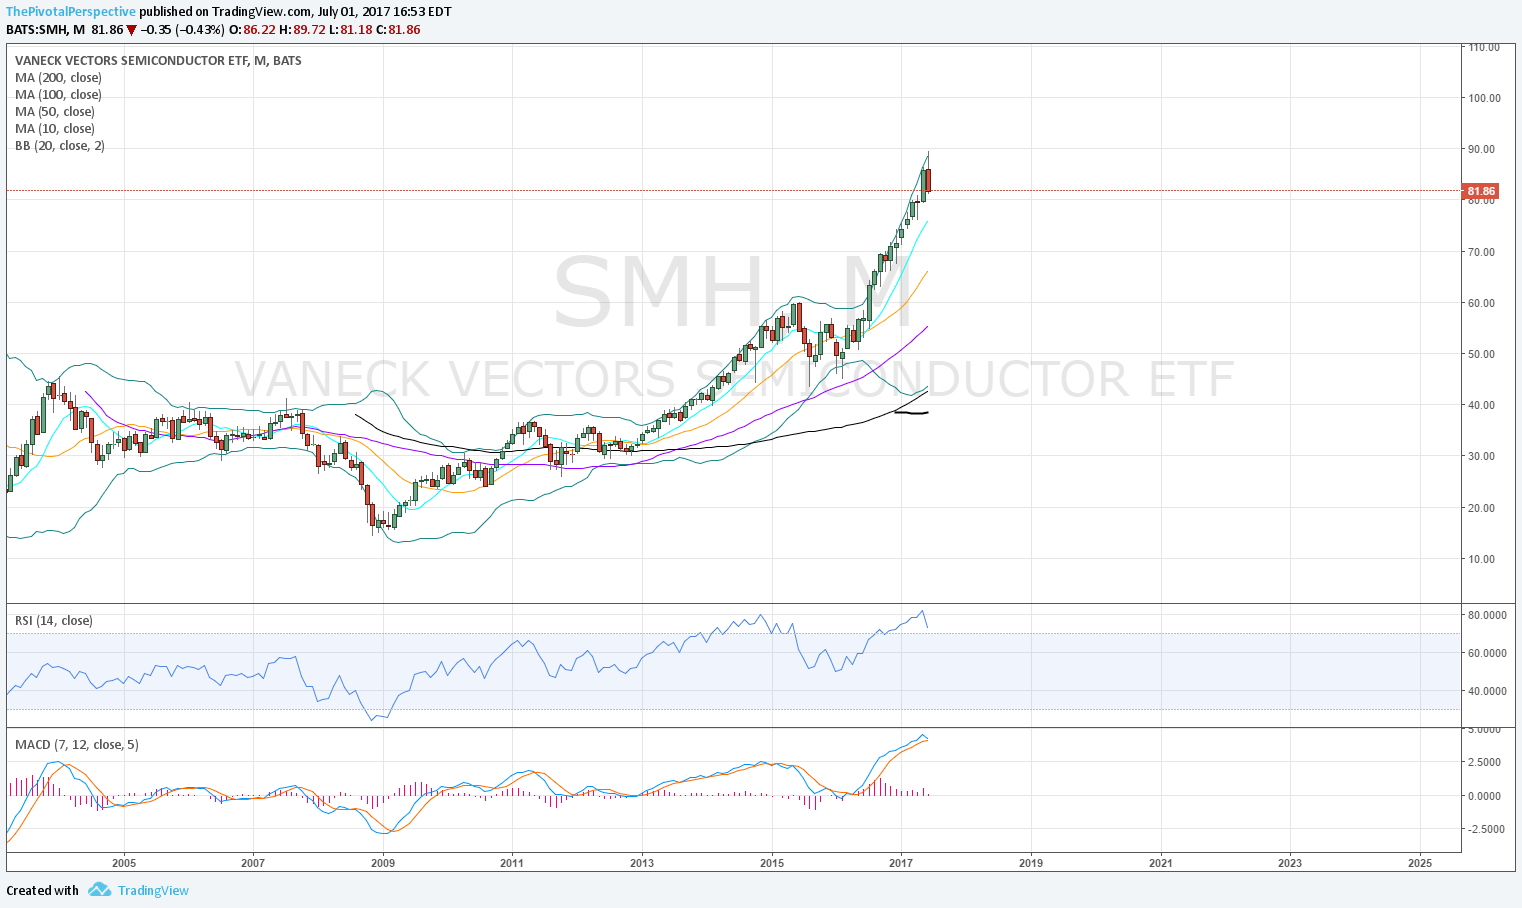
SMH
Q: 1 year outside the Q BB and a huge wick. Seems ready to drop.
M: Red bar but not reversal. No RSI divergence.
W: YR1 break.
Sum: Not sure whether it goes lower or recovers the YR1 to act as support.


XBI
Q: To be honest I thought the drop would be more than 3 quarters considering that Q chart RSI. Impressive comeback! Huge RSI & BB divergence setting up though.
M: The M chart 50MA held over and over, and zoom back to upper BB.
W: No idea what is next move. Between YR2 and YR1. Such a huge gain, but RSI OB first time since 7/2015.


XLF
Q: Ready to launch or fade depends on point of view.
M: One could say BB and RSI divergence here.
W: Between levels.
Sum: No idea - but if TLT and AGG both under YP, XLF should be going up.


XLE
Q: Bearish, below all MAs.
M: 50% done and weak selling invites buyers but jeez, 6 months in a row red.
W: Under YP.


