Sum
Larger trends for USA main indexes remain up - after summer pullback to rising weekly moving averages, most indexes bounced back to highs. Currently, SPY, QQQ, DIA and VTI are above rising 10MAs. Additionally, SPY, QQQ, IWM and VTI are above all pivots, with only DIA below its SepP.
The concerns are - weekly RSI divergence, high tests, DIA tilting bearish after long term resistance rejection, and Q3R1 resistance for SPY, VTI, and YR1 potential resistance for NYA.
Thankfully levels are going to make this easy - if SPY, QQQ, VTI and IWM remain above SepPs next week, then hold or add USA longs. If they break, reduce risk, hedge or short and play for a visit to lows or range or larger pullback.
This week I will lead in with standard technical analysis weekly charts with Bollinger bands, followed by weekly long term pivots, then daily pivots.
SPX / SPY / ESZ / ES1
SPY W: All above rising MAs; upper BB curling and should be resistance if tagged. RSI divergence on high test.
SPX W: So far normal consolidation; above YR1 from late May, near 2HR1 tag at highs.
SPY D: Q3R1 resistance for 4 trading days; SepP support for the same 4 trading days.
ES Z D: MACD back on buy as of 8/31; above all pivots and MAs.
ES 1 D: Test of closing highs shows by red line.
SPX sum: So far normal range consolidation after multi-month run. Q3R1 resistance, SepP support. Still above all pivots and MAs so cannot be too bearish; but high test in place opens door to another drop.


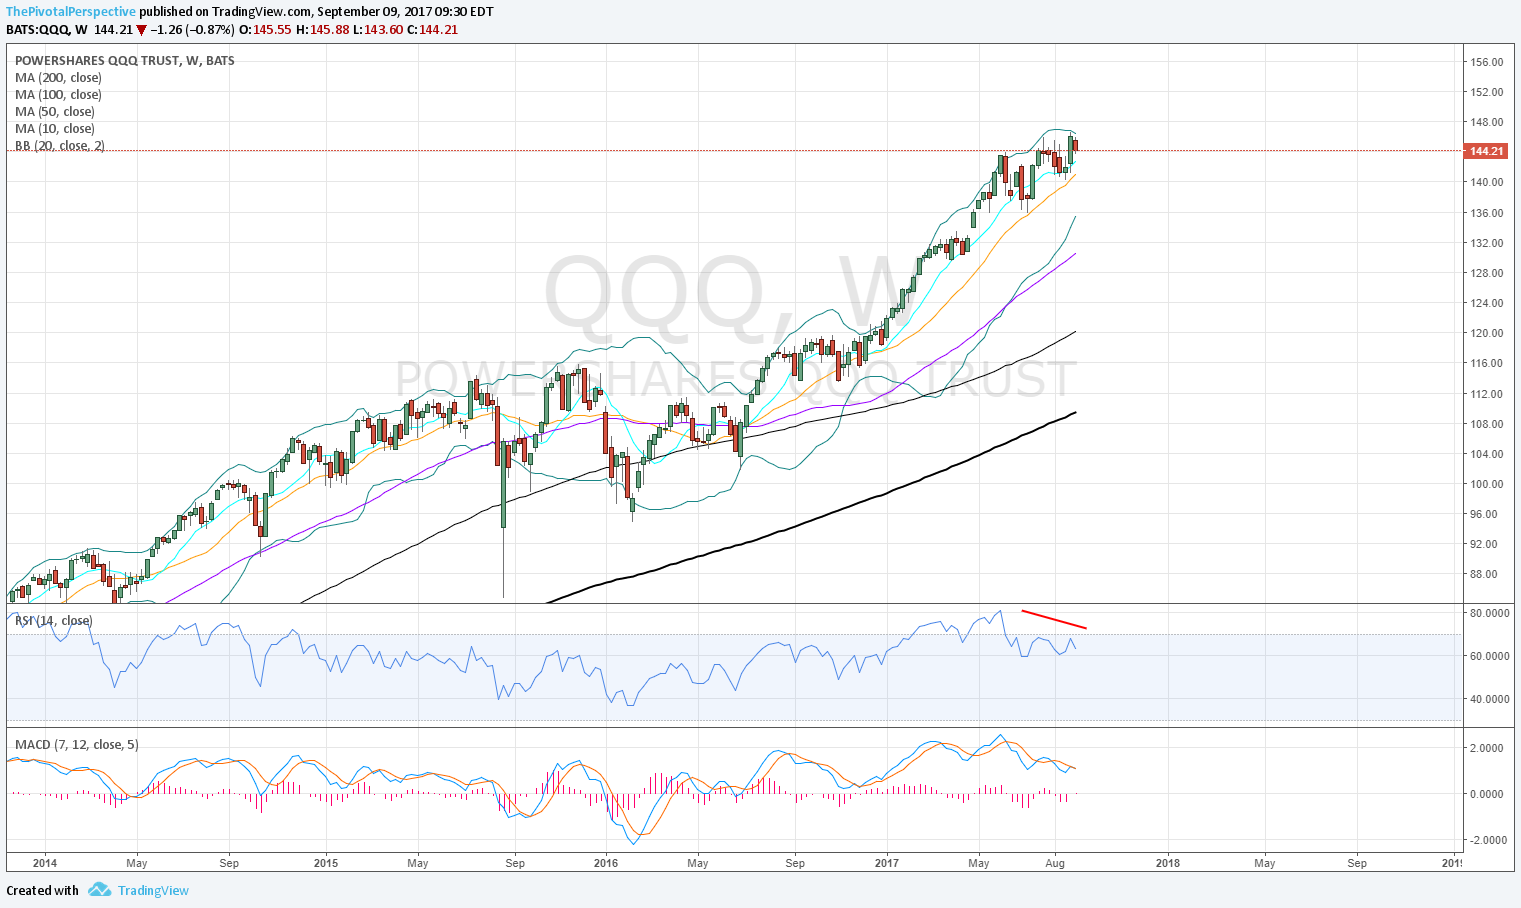
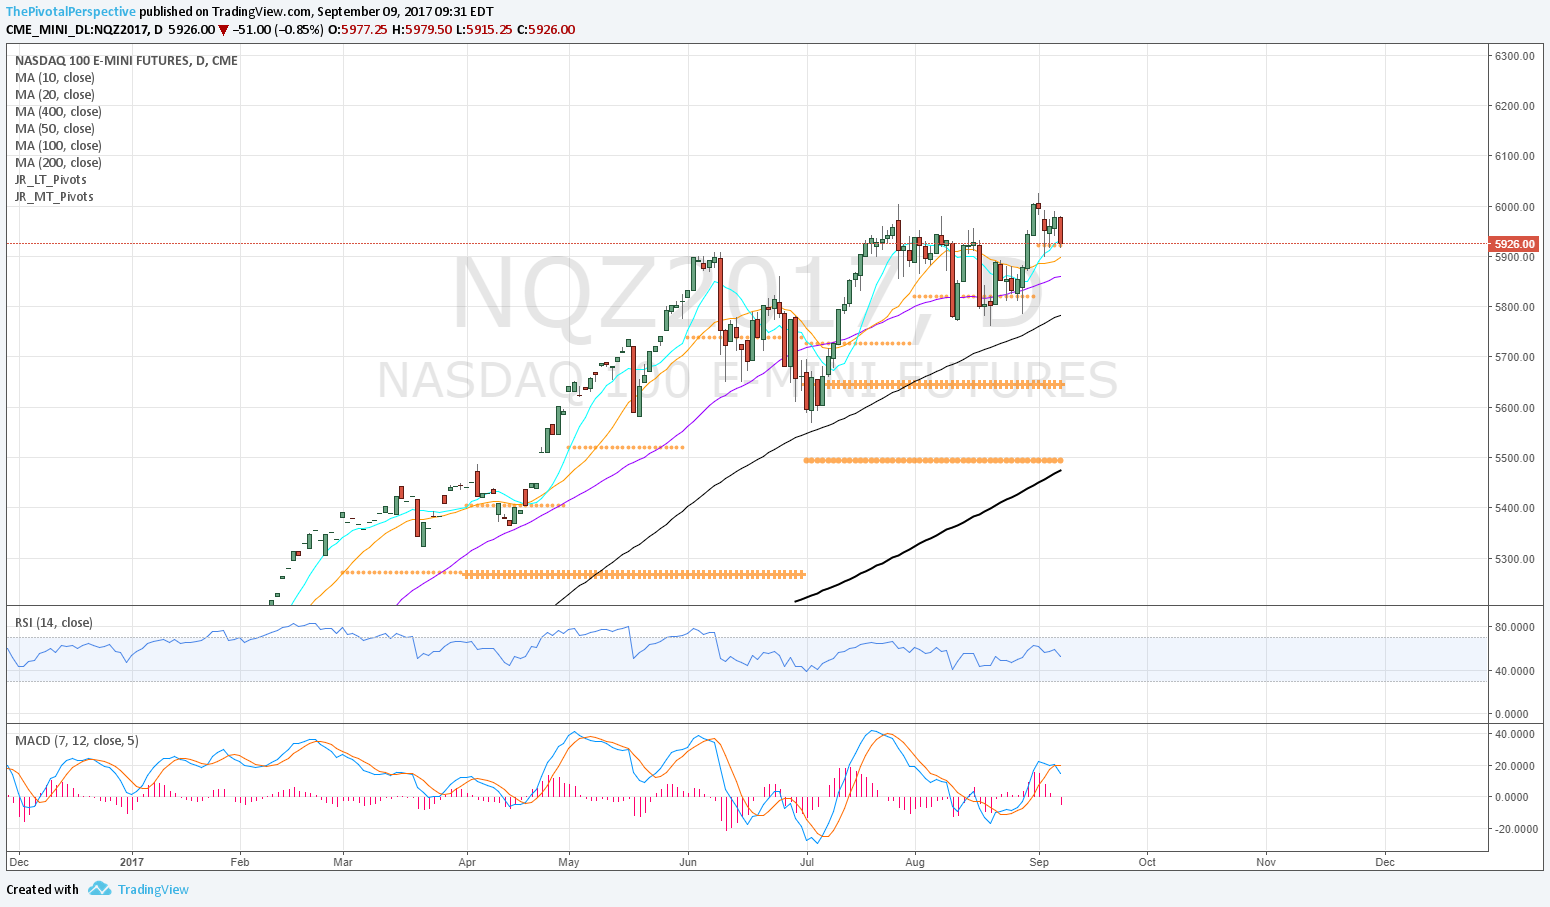
NDX / QQQ / NQZ / NQ1
QQQ W: Resistance at upper BB with RSI divergence.
NDX W: Looks fine, above YR2 from 7/10 bar.
QQQ D: At Q3R1, and SepP same level.
NQZ D: Holding SepP, slight break of 10MA but above all others with rising slope.
NQ1 D: Above July closing high for 4 trading days but now below.
NDX sum: Range consolidation, but upper BB clear resistance. Above all pivots, and QQQ bang on both Q3R1 and SepP. Hold bullish, break bearish.


INDU / DIA
DIA W: Above 10MA but distinct RSI divergence on recent high test.
INDU W: Clear resistance at 2HR1.
DIA D: Under SepP 4 trading days; holding Q3R1 as support.
INDU sum: Clear resistance at 2HR1 with weekly RSI divergence. DIA 4 days under SepP, but still holding Q3R1 as support. Due to long term resistance level rejection and current monthly pivot status, this is tilting more bearish.


RUT / IWM
IWM W: Upper BB to lower BB and rising 50MA.
RUT W: From 2HR1 to 2HS1, back to 2HP.
IWM D: 2HP, Q3P and SeP all clustered together for clear make or break level.
RUT sum: The laggard of 2017, IWM reached rising W50MA on recent drop but had a decent bounce from there.


NYA & VTI
NYA W: Looks fine, pullback to rising 20MA and bounce from there, back above 10MA.
NYA W: YR1 resistance.
NYA D: YR1 with red arrow, SepP in orange arrow.
VTI D: Also below Q3R1 but above SepP.


