Changing course

The site began the day I learned that the hedge fund where I had worked for 3 years as a full time analyst and consultant was shutting down. The hedge fund was interested in my work based on a prior blog which had made several fantastic market calls from 2007 onward, including the top and pending bear market.

I’ve made as impressive calls the last three years - just see the Featured posts section. But I’ve decided to change course with this site, and move to Twitter only. That is where the action is anyway, along with StockTwits (TBD if time to do both).

Whoever you are, hope my work has kept you on the right side of the market. Thanks for reading.

Total market view

REVIEW
9/16/2018 Total market view: “Current take is moderately long but watching carefully if a defensive adjustment is needed.”

Daily comment 9/19/2018: “If the market makes a small shakeout and then resumes higher we have to be open to that possibility as much as a trading top. For now I like the financials into quarter end as re-balancing is hitting the winners and helping the laggards.”

Result
Market had one day shakeout and then recovered. NDX well off the lows, but IWM not that much.

SUM
All 5 USA main indexes are above all pivots, and VIX & VXX below all pivots. Crucially, DJI cleared its YR1 without any trouble. Even though I tend to focus on SPX and NDX above the DJI, historically speaking with pivots it is probably DJI that has most impact. So I view this as quite important clear, as long as it maintains.

However, 2 of 5 of these indexes are testing resistance levels - SPX QR, NDX YR2; and RUT topped on QR in August. Given weekly chart and short term 2 hour chart technicals I think a drop is the next likely move. If that assessment is correct, NDX and RUT will break under MPs again.

But let’s keep the bigger picture in mind - USA indexes are in uptrends, international indexes have recovered somewhat, and safe havens have crumbled. VIX is below YP, so below all pivots. TLT is back to near lows of the year, and of the bond ETFs I track (TLT AGG LQD HYG) only HYG is above its YP on price or total return basis. Metals have been crushed.

The main risk seems to be China problems impacting tech. As I have pointed out several times recently, the quarterly chart RSI of NDX is currently 90.5. This is quite rare territory and risk is to the downside. This is why I have been watching its YR2 so carefully. A combination of YR2 rejection and monthly pivot break could easily be the start of something larger (this is what happened on 2/2/2018).

If NDX was about to power up we would also likely see strength in SMH semiconductors, XBI biotechs and KWEB China tech. Yet of these only SMH is above all pivots. Should we see a coordinated move below MPs then a bigger tech selloff may be underway.

Other factors pointing to risk-off as the next move - value perking up against growth for nearly all of Sept, equity put-call near lows of the year, and RSIs across timeframes approaching overbought or nearly so. For example, SPX Q & M charts 70+ for months now, but when weekly, daily and 2H chart all reach 70 area along with tags of upper Bollinger bands on these timeframes as well then pros are likely taking profits. Lastly, my timing work had 9/20-21 top.

But as mentioned above if we were about to see a major top then DJI should not have cleared its YR1. As long as this maintains above I expect any weakness this week to be soon bought for the start of Q4. Also it is often good to have cash on hand for next setups. If RUT and NDX reach SepS1s then that is probably a good buy.

Bottom line - near term watching to play tech short while holding other longs. VXX tagged SepS1 and looks ready to lift, so that is also a potential hedge. If DJI holds its YR1 as a test I’ll likely be shifting back more long soon enough.

PIVOTS
USA main indexes - Levels to watch this week: NDX and RUT MPs, DJI YR1, SPX QR1.

Sectors of note - XBI SepP test and fail and YR1 break. Could be good short. It would be nice for XLF to make new highs but not sure that will happen as HR1, QR2 and then YR1 all in the way.

Developed - Nikkei moving nicely, back above all pivots on 9/11, part of a tell that China not as impactful. But also heading into resistance at QR2, HR1 and then YR1 not far above that. DAX still weaker but off the lows. EFA, a widely watched institutional index, reclaimed its YP but still under HP and D200MA.

Emerging - These have rebounded with DXY drop but not really giving all clear bullish signals. Watching FXI, EEM, KWEB YPs.

Volatility - VIX below YP. A stock sell signal would involve a decent move of VIX back above YP.

Bonds - See note above. TLT very quickly back to lows of the year as TNX rallied from 2.80 area to above 3 in Sept.

Metals - GLD has stabilized at its YS1 in Sept but bounces have been whacked. Not sure of next move but if below MP again then breakdown more likely. I believe FOMC is hawkish.

Commodity - CL1 continuous contract finally made it over QP last week but quickly dropped from near tag of SepR1 and YR2. Range bound action for the 2nd half so far.

Currency - DXY move of the month was YP / MP top and MS1 low.

Crypto - I’d be more bullish BTC if it can move above is QP in Q4. 2/6low defended several times.

OTHER TECHNICALS
NYAD cumulative advance decline showing some divergence.

Growth vs Value (VUG:VTV) sliding in Sept.

VALUATION
Alas my data feed having issues. Think I can use Factset numbers which should be similar, but need to test. As of last week

SENTIMENT
PC Equity 10 day MA near lows of year. But puts.

TIMING
Timing work has nailed a lot of Q3 turns. This is a very unique system.

September dates posted 8/26/2018 TMV

9/6 - 9/7 index low
9/13 - non event
9/20-21 - index high?

Oct dates
10/1
10/5 - risk on
10/13 - risk off
10/26

In addition, larger cycle weakness after 10/10-11 into early Nov.

USA main indexes

Sum
NDX, SPX and NYA are testing resistance levels - YR2 and QR1s respectively. 2018 winners NDX and RUT haven’t done much in Sept and both again testing MPs. However, DJI soared above YR1 last week which should alleviate the concerns about a major trading top.

Bottom line - More charts at resistance along with daily and weekly RSIs at or approaching overbought suggest pullback, but DJI lifting above YR1 helps reduce the chances that we just saw a big top. Translation - pullback then another lift the most likely move.

SPX SPY ES
SPX W: BB tags after January have been short term tops.
SPX W: This view looks better - above HR1 2883 points to YR2 2987.
SPY D: More bearish looking due to ex-dividend but still, QR rejection.
SPY 2H: MP hold earlier in the month was definitive as planned. But RSI reaching 70+ suggests more downside.
SPX sum: Bigger picture above HR1 2883 points to YR2 2987. Short term picture with SPY QR1 rejection and SPY 2H charts recently overbought points to more weakness.

22 3 SPX W.png
22 4 SPX W.png
22 6 SPY 2H.png

NDX QQQ
NDX W: Vulnerable to selling with weak advance under YR2.
QQQ D: 2 recent attempts to clear YR2 (9/13-14, 9/20-21) and trouble each time.
NDX sum: Still above all pivots on NDX and QQQ (not on NQ). However, trouble at Yr2 for the 3rd time in Sept. MP decides the next move.

DJI DIA
DJI W: Very bullish, launch above HR1 that cleared YR1.
DIA D: Soared above YR1 resistance despite RSI overbought.
DJI sum: Could have topped on YR1 but didn’t; instead, bullish clear.

22 10 DIA D.png

RUT IWM
RUT W: Still holding above YR2 as support.
IWM D: 3 days below MP then recovery, again testing level.
RUT sum: If MP / YR2 holds as support, then expect another move up to highs.

22 12 IWM D.png

NYA
W: Starting to see how definitive the HP test 6 bars ago was.
D: At QR resistance with RSI 69.7 invites pullback.

22 14 NYA W.png
22 13 NYA D.png

Timing dates 2018 Q3

Another post on my timing system. Recent post here.

At the end of each month I generate dates more likely of notice for the next month. Here are the last 3 months of those dates. Very occasionally I will add a date as the month unfolds but if I do that it is always in advance in the Total market view.

July dates first posted 6/24/2018 Total market view:

7/4 (then edited to 7/3 on 7/1 TMV)
7/10 (then edited to 7/10-11 on 7/1 TMV)
7/25
7/27 (added in 7/22 TMV with specific call for volatility spike)

August dates posted 7/29/2018 TMV

8/2
8/6-8 strong
8/17-20
8/27 added

September dates posted 8/26/2018 TMV

9/6
9/13
9/20-21

I haven’t been doing direction on these too much (as I used to do at a hedge fund) but occasionally will add things like “prefer up for risk” as I did for 9/20-21 in the 9/16 TMV, or “volatility spike” for 7/27 (both nailed btw).

So without further comment, here is a simple SPX chart with lines on all these dates. For all dates I’ll count +/- 1 as a close hit but no more; +/-2 is too wide.

7/3, pullback low and low of month 7/2
7/10-11, pullback low 7/11
7/25, high of month
7/27, volatility spike 7/27-28 and stock pullback low 7/28
8/3, pullback low and low of month for SPX
8/6-8, trading high 8/7
8/17-20, non event
8/27, close but not quite, 8/29 key high of month
9/6, pullback low and low of month 9/7
9/13, non event
9/20-21, up for risk as called and potential trading top

All timing dates and timing model calls will go on Twitter from here…


Total market view

REVIEW
9/8/2018 Total market view: “Typically pullbacks to support in larger up-trends are bought. Both SPX SPY and RUT IWM are testing MPs, which along with rising moving averages, would be good places for a bounce. … Bottom line - playing for a bounce from SPX and RUT MPs. But NDX along with both SMH and XBI have already broken MPs, and NDX is showing a bearish move from long term resistance YR2 HR1 so this must be respected. If the bounce doesn't happen, I'll move further to cash and watch for the next setup.”

Result - SPX and RUT both held MPs on close. SPX had a better move up towards highs by last week while RUT is struggling a bit more.

SUM
All USA main indexes are above all pivots. The recent test of SPX and RUT MP held, and NDX recovered its MP as well. DJI seems like it could be hit from resistance but hasn’t. In addition, VIX closed under its YP. All these are bullish signs.

We could also point to lack of frothy sentiment, SPX forward p/e reasonable in 17s and weakness in other safe havens as reasons to go higher for risk (SPY/TLT ratio all time highs, SPY/GLD ratio highest since 2005).

But here are the things that concern me:
NDX YR2 selling, along with SMH and XBI weakness
DJI HR1 and weak advances invite door for bears
Cumulative advance decline showing bit of bearish divergence
RUT struggle to lift back towards highs (reflected in the cumulative advance-decline)
Daily new lows picking up
Heading into quarter end, possibility to some profit taking in leaders (More broadly, NDX and RUT; specifically, tech, internet, small cap growth, health care tech, etc.)

Last week I said ready to take defensive action should the anticipated bounce from SPX and RUT not occur. It did so mostly long the market. But it would not take much to generate a major sell signal. If all these happened:

NDX break of MP along with further rejection of YR2
DJI rejection of HR1
VIX lift from YP
RUT break of MP - keep in mind it has already topped on QR1 8/31
SPX high test and rejection or best case QR1 at 2925 then down

Then a lot would be checking off on the TPP top checklist. I’ll post on this in detail should this occur.

But all this is conjecture as monthly pivots are holding and main indexes are moving back to highs.

That said the leaderboard and long positions have thinned out compared to all the long positions in August. That’s OK - often good to have cash ready for next good setup as quarter end approaches.

Bottom line - TPP shifted emphatically bullish near the beginning of July. Played for gains and even correctly hedged for 7/25 top, and quickly moved back bullish. At the end of August said pullback was due. Last week expected monthly pivots to hold. In sum comments have been on the right side of the market for much of the quarter, so I’ll try to keep going :) Current take is moderately long but watching carefully if a defensive adjustment is needed. If NDX clears YR2 along with SMH and XBI perking up then can be fully long again.

PIVOTS
USA main indexes - At this point NDX and RUT MPs are having a lot of sway. If they break likely clues to get defensive.

Sectors of note - XBI below MP since 9/6 and also dropping below YR1. SMH just held HP, QP and D200 again but could not really lift above MP. KWEB in bear market. All these point to more chance of NDX YR2 top.

Developed - N225 looking strong, DAX technical bear (weekly close below YP, below falling W50MA).

Emerging - All local currency indexes looking better than USA denominated ETFs. But $USD is what I buy and sell so those are the charts of more interest. ACWI held long term support last week, and INDA rebounded from QP test (INDA gave back gains of July and Aug in a hurry though). But SHComp, FXI, KWEB, EEM, RSX, EWZ all below all pivots.

Safe havens - VIX slightly below YP actually bullish for risk, but a jump back above turns that around. VXX also approaching levels to watch. Bond weak excepting HYG which is still strong (another larger bullish big picture point). GLD trying to hold YS1 but bounce quickly gone and looks like another move down is underway.

Commodity - Oil more range bound in 2H so far. CL1 cont contract has not closed above all pivots since early July highs.

Currency - DXY still under YP as last week’s drop 9/10-13 from YP MP area helped stocks to rally.

Crypto - BTCUSD below all pivots but hasn’t gone lower than the Feb low. Bounces less and less, so would like to see one more drop to 5K or under. ETHUSD reached YS1 so recovering is some positive. LTCUSD YS1 may be too far to see. Not following others.

OTHER TECHNICALS
New lows increasing.

Cumulative advance decline a bit of bearish divergence.

VALUATION
SPX forward P/E of 17X (green line) has acted as resistance since April. Currently 2920 and most importantly, still rising.

16 3 SPX.PNG

SENTIMENT
Put-call jumped back in a hurry compared to the relative low near the end of August.

TIMING
See this recent review. 

August dates (posted 7/22 Total market view)
8/2 - Stock pullback low
8/6-8 strong - "Seems like setting up for high"
8/17-20 - 8/21 minor high and mild pullback
8/27 (added) - Missed top by 2 days so not close enough, non event. 

September dates

9/6 - Stock pullback low 9/7 and TLT bounce high
9/13 - So far non event unless this week starts lower, will turn into trading top
9/20-21 - Prefer up for risk


USA main indexes

Sum
All USA mains are above all pivots. The preferred scenario of bounce from SPX and RUT MPs played out. In addition, NDX recovered its MP which was not the case last week.

So far most tests of resistance areas have meant pause or clear without serious selling.
SPX cleared HR1 2883, and seems to be pointing to YR2 2987.
DJI no selling from HR1 26143, which if maintains then next level up YR1 26504.

However, NDX is below YR2 for the 2nd week in row. RUT is holding above YR2 but the hold of MP has been weaker and seems to be having trouble to lift.

Bottom line - playing pivot holds in up-trending environment has paid several times especially in the 2nd half this year. But heading into the last 10 days of the quarter, I’m always on the watch for institutional re-balancing. If this were to occur we would see NDX and RUT MP breaks. Given NDX YR2 and RUT trouble to lift from MP I think this will be likely unless the market delivers a strong move up in the current week. So if NDX clears YR2 then that will help reduce the bearish threat.

SPX SPY ES
SPX W: Looks very bullish with launch above HR1. Looks like it will try for YR2 near 3000 this year.
SPY D: Near term target QR2 still in play through the end of the month.
ES D: As long as daily moving averages sloping upwards, a good idea to play longs on pivot tests
SPY 2H: SPY touched MP in July and then Sept, so it can be a long stretch between tests in a good trending move.
SPX sum: Move above HR1 2883 bullish and points to YR2 2987. Near term tag of QR2 2925 could happen next week.

NDX QQQ
NDX: YR2 test and 2nd week under the level. Door is open for selling, but a little higher would look good.
QQQ: YR2 in red arrow, and green arrows show recent pivot holds (mostly MPs, with YR1 holding as support early in July).
QQQ 2H: Showing earlier monthly pivot holds (green arrows), recent break (red arrow) and then hold. It would not take much for another break. Watching.
NDX sum: 2nd weekly bar under YR2. This could be part of a normal pause before blasting higher, or there could be more a dip coming up. We haven’t seen serious selling since Q1 but with quarterly RSI on track to be 90+ I’m watching this carefully.

15 7 NDX W.png

DJI DIA
DJI W: So far no selling from HR1 test, but seems to be struggling a bit. If higher then YR1 above.
DIA D: Showing target areas on red (HR1 then YR1) and pivot holds in green arrows.
DJI sum: If DJI can stay above HR1 26143 then YR1 26504 test likely.

15 10 DJI W.png

RUT DIA
RUT W: Still above YR2, but last week’s bar notably weak.
IWM D: Green arrows show monthly pivot holds. Contrast to May when two tests then off to races, IWM does seem to getting tired. Still holding MP this month but having trouble to lift.
RUT sum: Only USA main index above YR2 and holding MP several times in Sept, but having trouble to lift.

15 12 RUT W.png

NYA
W: Between long term levels.
D: Showing pivot holds and pivot / resistance selling.
NYA sum: A good institutional index and confirming indicator. There have been more false breaks and recoveries on this (reflecting international weakness) than the other USA mains. However, when this index joins in signal either bullish or bearish it rarely fails. So far pivot recovery on 9/11 part of tell for more gains.

Total market view

REVIEW
9/2/2018 Total market view
: "Bottom line - Often DJI pivots give the definitive tells. The market just stopped at DJI HR1 so taking steps to lock in some gains, or play for a bit of downside while holding longs, should work or will have low cost at worst. In addition, September is known for weakness followed by a strong Q4 especially in bull markets, so a strategy for near term weakness but likely higher highs seems to fit the market here."

Result - Market pullback in process.

SUM
Last week I expected a pullback and that is exactly what happened. Last week's suggestions to play for downside worked if you raised cash, played volatility, shorted China via FXI - but a hedge idea on DIA did not work. OK, now what?  

Typically pullbacks to support in larger up-trends are bought. Both SPX SPY and RUT IWM are testing MPs, which along with rising moving averages, would be good places for a bounce. Keep in mind that pullbacks to monthly pivots have been the key lows in the last few months, starting with the launch from HPs QPs MPs across most USA indexes in early July, a pullback to MPs in early and mid August varying by index, and now. 

However, there were some bearish developments last week and we need to be on guard to take more defensive action should this bounce not occur. NDX is below its MP for the first time since early July, and a YR2 HR1 rejection is in process. SPX and DJI HR1s are also acting as resistance, though without much selling pressure yet. If 3 of 5 USA mains had rejections at long term levels, then this would indeed be a bearish development warranting further reduction in risk. But this hasn't happened yet, and I still think the odds are that SPX and RUT hold MPs and a bounce is the next move.

That said, keep in mind the larger environment - global markets are in trouble. Emerging markets in $USD terms are getting crushed (FXI short last week the best performer of recs from last week). DAX is also near its low for the year, and Nikkei225 has been chopping range bound for several months as USA has rallied. 

Fixed income is not helping to steady portfolios with most major categories negative YTD. And of course, a bloodbath in cryptos. 

In sum the QT dominoes are falling and I believe it is only a matter of time before these impact the last in line, USA stocks with a focus on tech and small caps in particular. For now still focusing on these leaders although last week small caps took over from tech as the relative pivotal leader both in terms of monthly pivot (IWM above MP, QQQ, XBI and SMH below) and long term levels (IWM above YR2, QQQ below).

Bottom line - playing for a bounce from SPX and RUT MPs. But NDX along with both SMH and XBI have already broken MPs, and NDX is showing a bearish move from long term resistance YR2 HR1 so this must be respected. If the bounce doesn't happen, I'll move further to cash and watch for the next setup.

PIVOTS
USA main indexes - NDX below MP, but SPX and RUT still holding. 

Sectors of note - SMH and XBI both under MPs. If rates keep moving up financials should benefit, and right now XLF still holding its MP. 

Developed - DAX noted as bearish in last week's Total market view and quickly back to near lows of the year. 

Emerging - With nearly all of the indexes I track below YPs, we should see YS1s before a major low. Above YP - ACWI and INDA. Below YP and reached YS1 or lower - SHComp and EWZ. Below YP without having reached YS1 - EEM, FXI, KWEB, RSX.

Safe havens - VIX giving decent tells with recent lows well off the earlier August lows. At the same time the recent move up did not match earlier August. I think this helps the case for a stock bounce as the next move - ie if VIX were really confirming stock trouble it would be higher than the August high. If this idea is correct then we will see VXX move below its MP.

Bonds looked good for a bit but again issuing long term sell signals using total return pivots on TLT, AGG and LQD. HYG reached YR1 resistance and pulled back. This may help XLF do better in the near term. 

Metals are oversold but look ready to tank again with DXY again testing its YP from underneath.

Commodities - CL USO also gave back gains last week, with the CL1 continous contract again showing the definitive move with inability to rally above all pivots before the next drop.

Currencies - DXY near YP again. It had reclaimed this then failed. A second clear "should be" definitive. 

Crypto - BTCUSD 4-5K target that I have had all year looking more likely.

OTHER TECHNICALS
Everyone who uses RSI noted overbought conditions on daily charts and weekly chart divergences. Those indeed played out. Now daily charts are already in RSI buy zones so this is another reason to look for a bounce next week.

VALUATION
Interesting that 17X forward acted as resistance last week. 

Here's more context. You can see 18X orange line was resistance for many months before clearing in 2017 Q4 and the blowoff to near 20X (red line). But 18X acted as resistance after that, and now 17X (green line) seems to be acting as resistance as well. A somewhat bearish long term consideration if this continues.

SENTIMENT
Last week noted that sentiment measures were starting to tilt too bullish - this supported the pullback idea.

TIMING
See this recent review. 

August dates (posted 7/22 Total market view)
8/2 - Stock pullback low
8/6-8 strong - "Seems like setting up for high"
8/17-20 - 8/21 minor high and mild pullback
8/27 (added) - Missed top by 2 days so not close enough, non event. 

September dates

9/6 - Stock pullback low 9/7? TLT bounce high. 
9/13
9/20-21

USA main indexes

Sum
Some bearish developments this week: NDX and NYA both under MPs. This is a bit more threatening with NDX YR2 HR1 rejection and other areas testing - SPX testing HR1, RUT YR2 and DJI HR1. 

Typically pullbacks to pivot and rising MA support are bought more often than they break. So it is possible that buyers are back with the non holiday week and all will be well. But if that doesn't happen, and SPX and RUT both break there monthly pivots with long term levels looking more like rejection, then a deeper pullback could be in the works. 

Bottom line - pulling for bounce but ready to be more defensive if more USA mains are under MPs. 

SPX SPY ES
SPX W: From this view a normal reaction from upper BB and RSI near 70.
SPX W: From this view more threatening if HR1 starts acting as resistance. 
SPY D: SPY hanging on to MP. 
ES D: In this chart I have drawn up arrows where the ES has held various pivots this year, and down arrows where they have broken. Not guaranteed, but odds favor bounce. 
SPY 2H: RSI not yet 30 but nearing areas where buyers have stepped in. First test of MP on this vehicle since early July (ES tagged its MP early August per the other chart).
SPX sum: Short term weakness in a larger uptrend is usually bought. There is a monthly pivot and rising 20MA that both can act as support; usually good setup for bounce. If a bounce does not happen then that may turn into a more important development as HR1 is in play as resistance. 

9 2 SPX W.png
8 2 SPX W.png
8 5 SPY 2H.png

NDX QQQ
NDX Q: Reminder that the quarterly chart RSI is above 90. The last quarter that was down in a threatening manner was 2015 Q3, 3 years ago. 
NDX W: Uh oh. YR2 and HR1 rejection. 
QQQ D: Red arrow at YR2, orange at MP. Bearish configuration. Next support not far at SepS1.
NDX sum: Something to carefully watch here as YR2 HR1 rejection in process along with break and rejection of MP. 

8 7 NDX W.png
8 8 QQQ D.png

DJI DIA
DJI W: 2 bars pausing under HR1 but no selling yet.
DIA D: High bang on HR1, but not much drop and well above MP.
DJI sum: At resistance area, but so far no selling and still above MP. If that clears then YR1 also above. 

8 9 DJI W.png

RUT IWM
RUT W: Still above YR2.
IWM D: High on QR1, then pullback to test YR2 and MP area. 
RUT sum: Holding up better than NDX QQQ on this drop. 

NYA
W: Not near any long term level.
D: Above QR which could act as support, but below MP which is acting as resistance. 

8 14 NYA D.png

Total market view

REVIEW
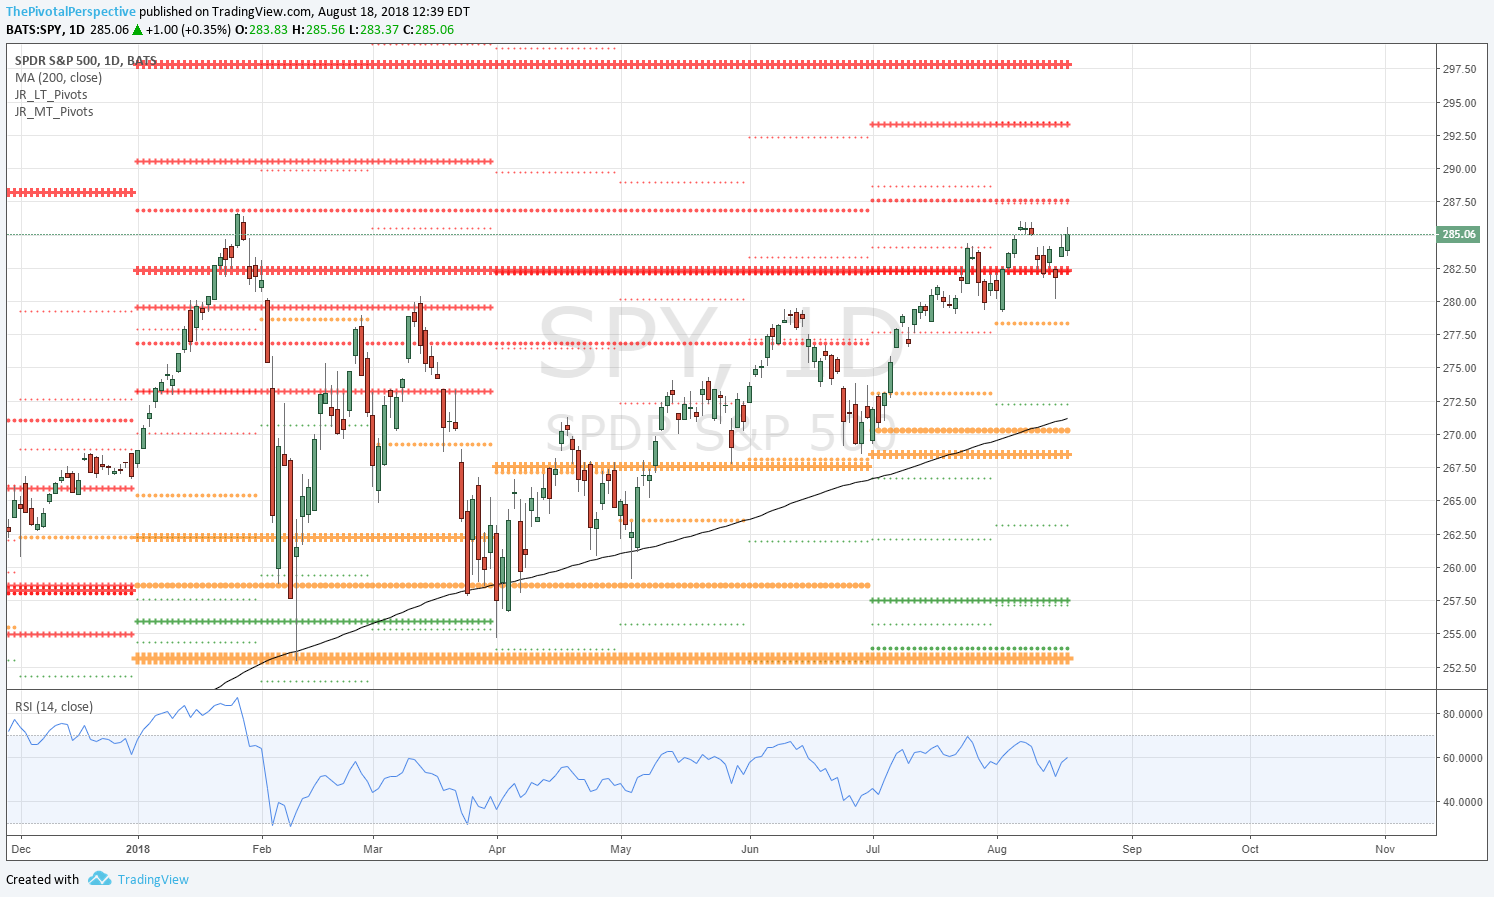
8/26/2018 Total market view: "Bottom line - The Pivotal Perspective has been bullish since early July, and anticipated a minor shuffle from the 7/25 high. Adding back into small caps worked very well last week, so mostly in monitoring phase. While I would like to see SPX clear its HR1, I'm not sure that NDX will blast through its YR2 on the first try. 

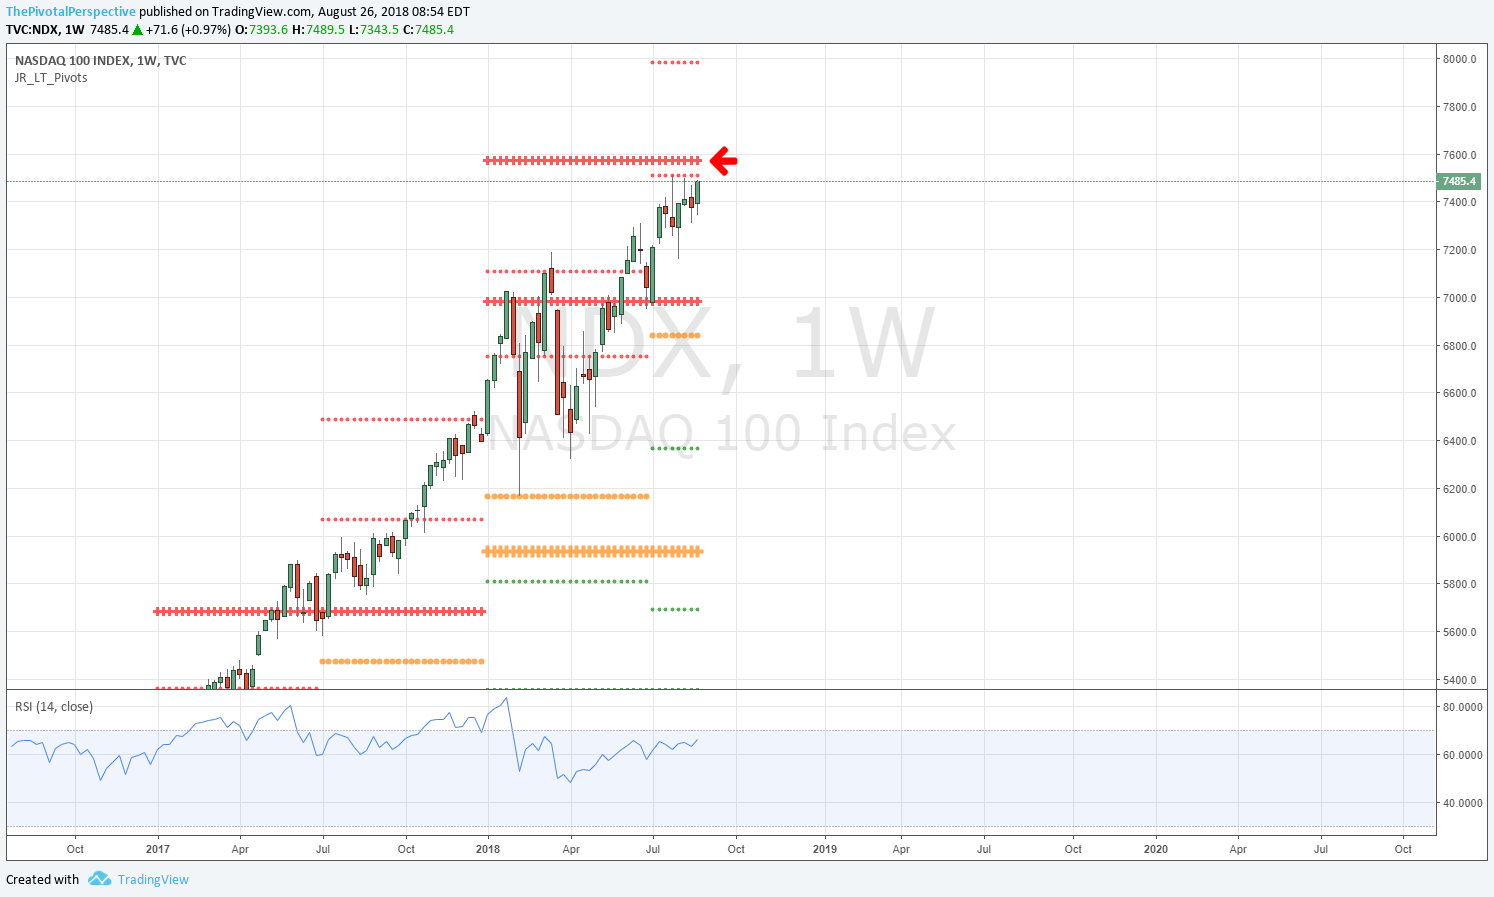
8/28 Daily comment: "In the latest Total market view on the blog, I thought SPX would rally above HR1 2883 but didn't think NDX would crack YR2 7572 on the first try. Due to strength, yesterday I said less sure that YR2 stops the rally. That is still the case. ... In sum no sign of rejection from NDX YR2 level yet. Long and strong. Bit concerned about VIX but so far no stock index exit / hedge / short signal."

Result - SPX cleared HR1 to start the week, then contrary to initial expectations but in line with daily assessments, NDX cleared YR2.

SUM
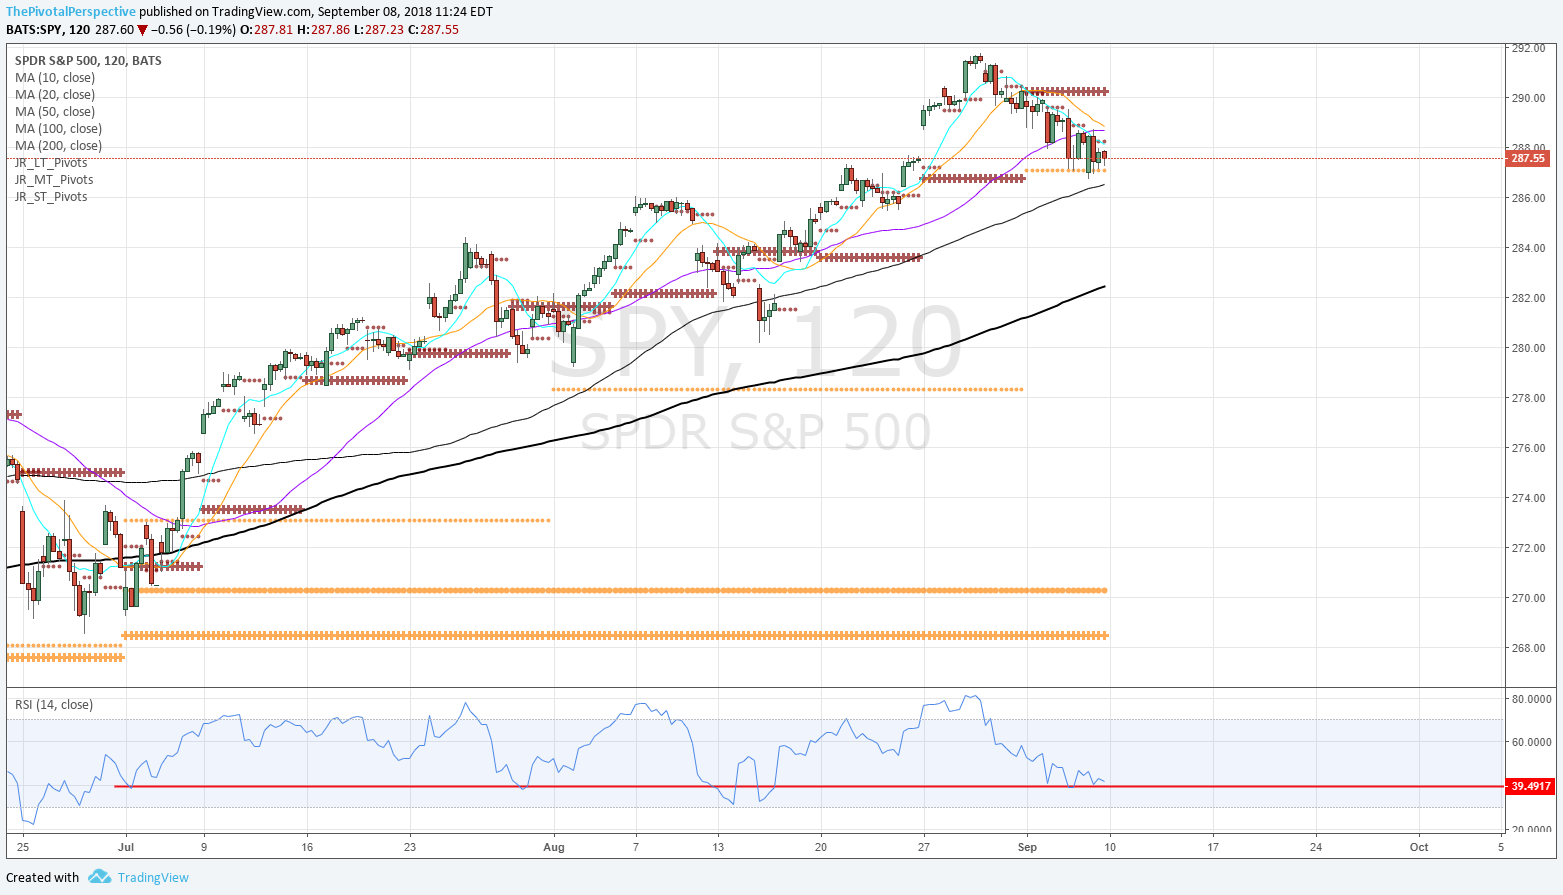
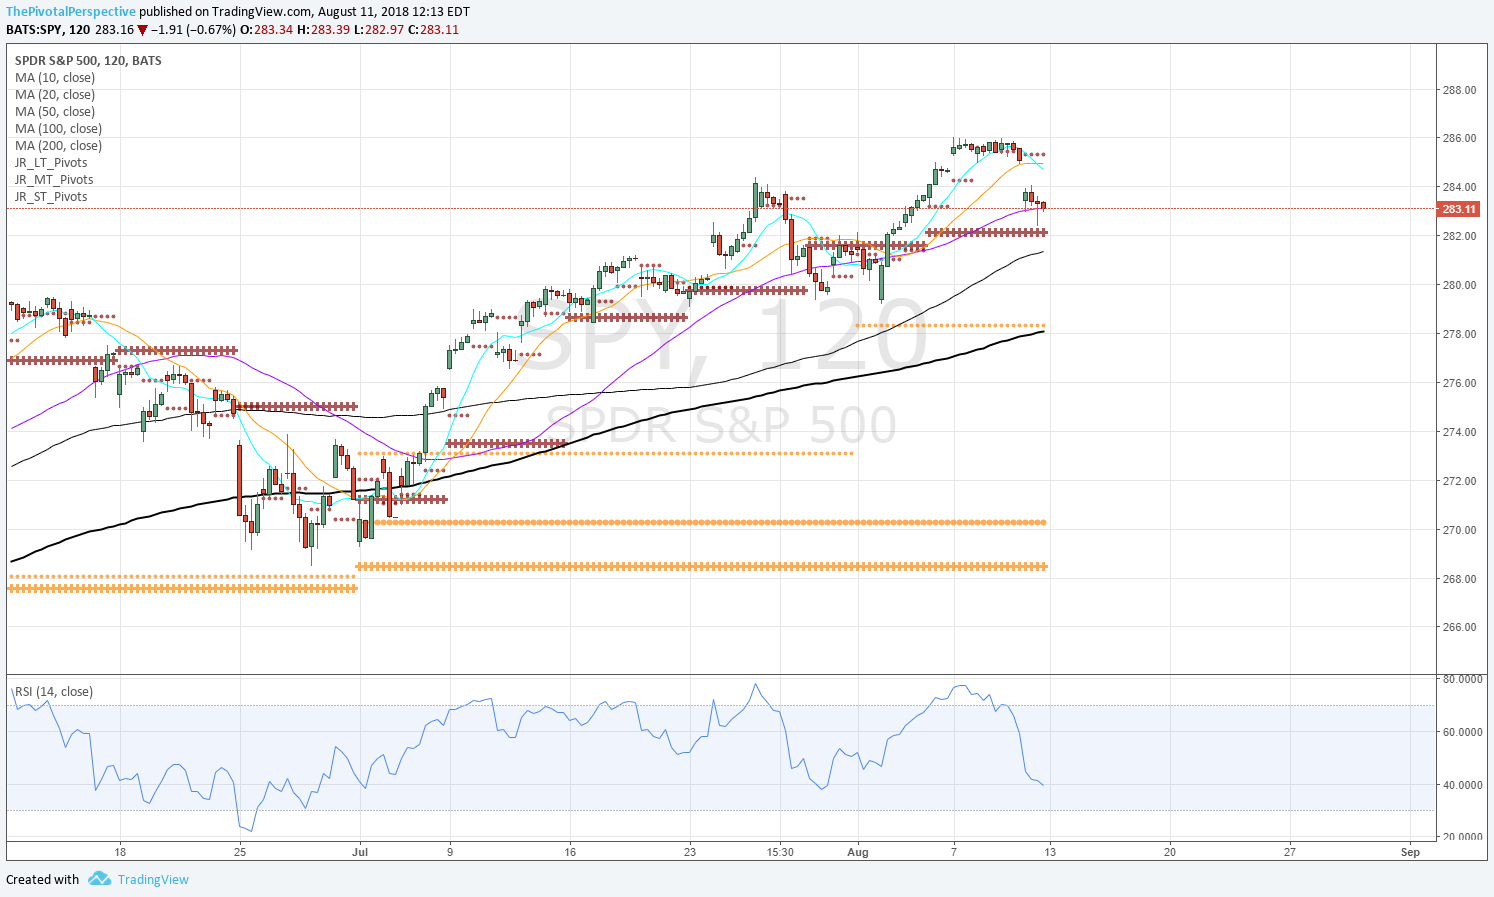
Playing the long side on USA equities from Q3 had had an easy 2 months of gains for the best trending period of the year so far. Touches of monthly pivots have been key entries or hold points, as what happens in a healthy up market. In early July, early August and then most recently mid August multiple USA mains either cleared their monthly pivot (July) or test and held (both times in August).

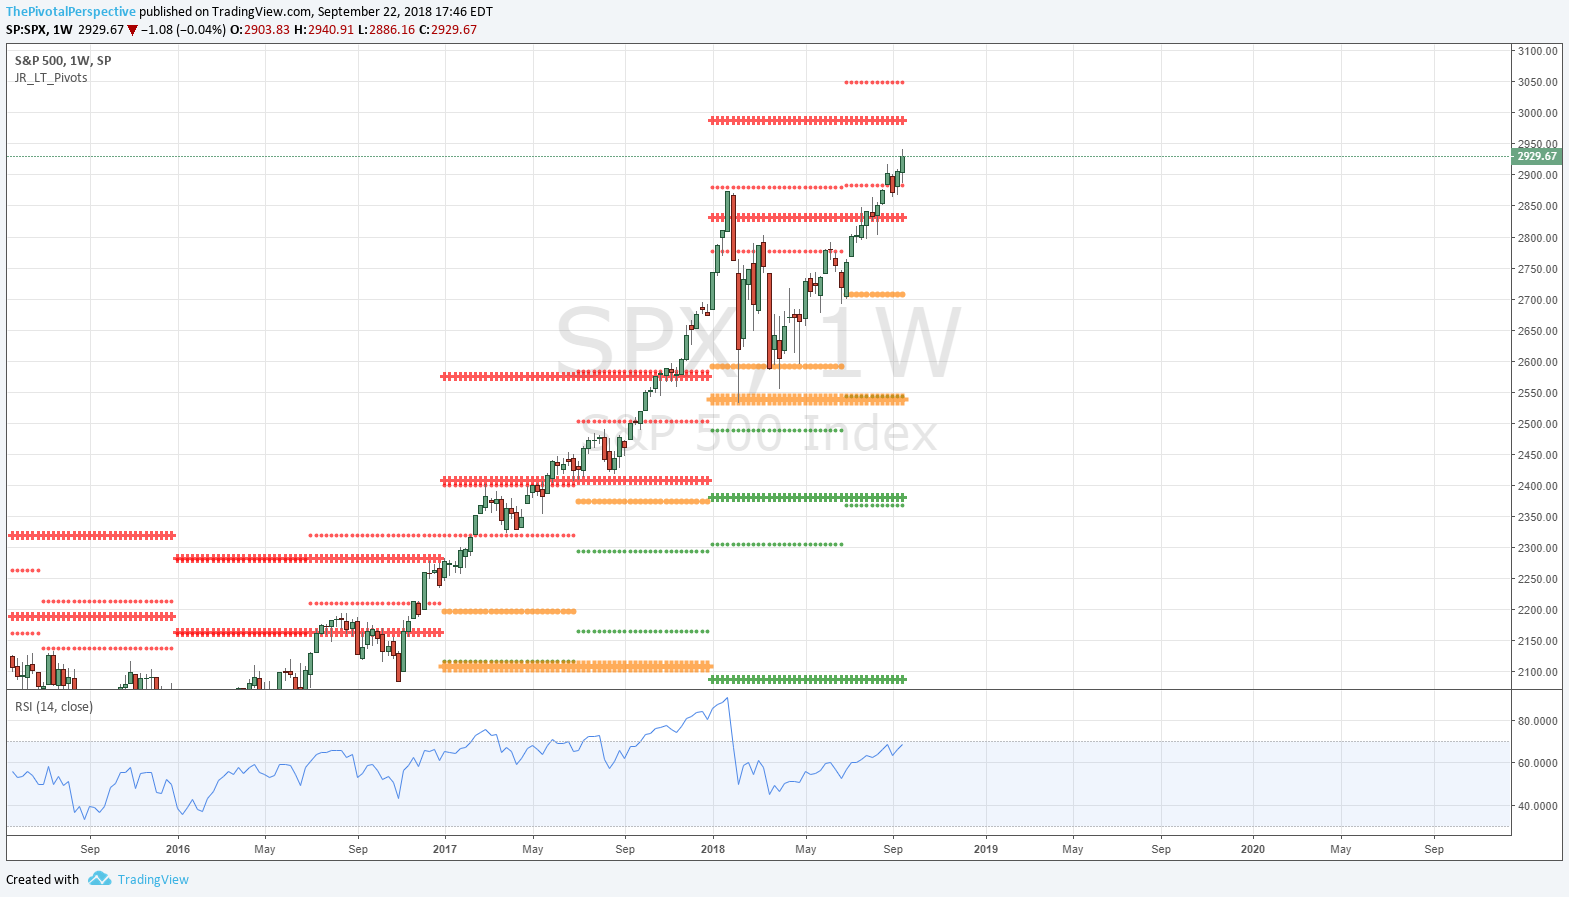
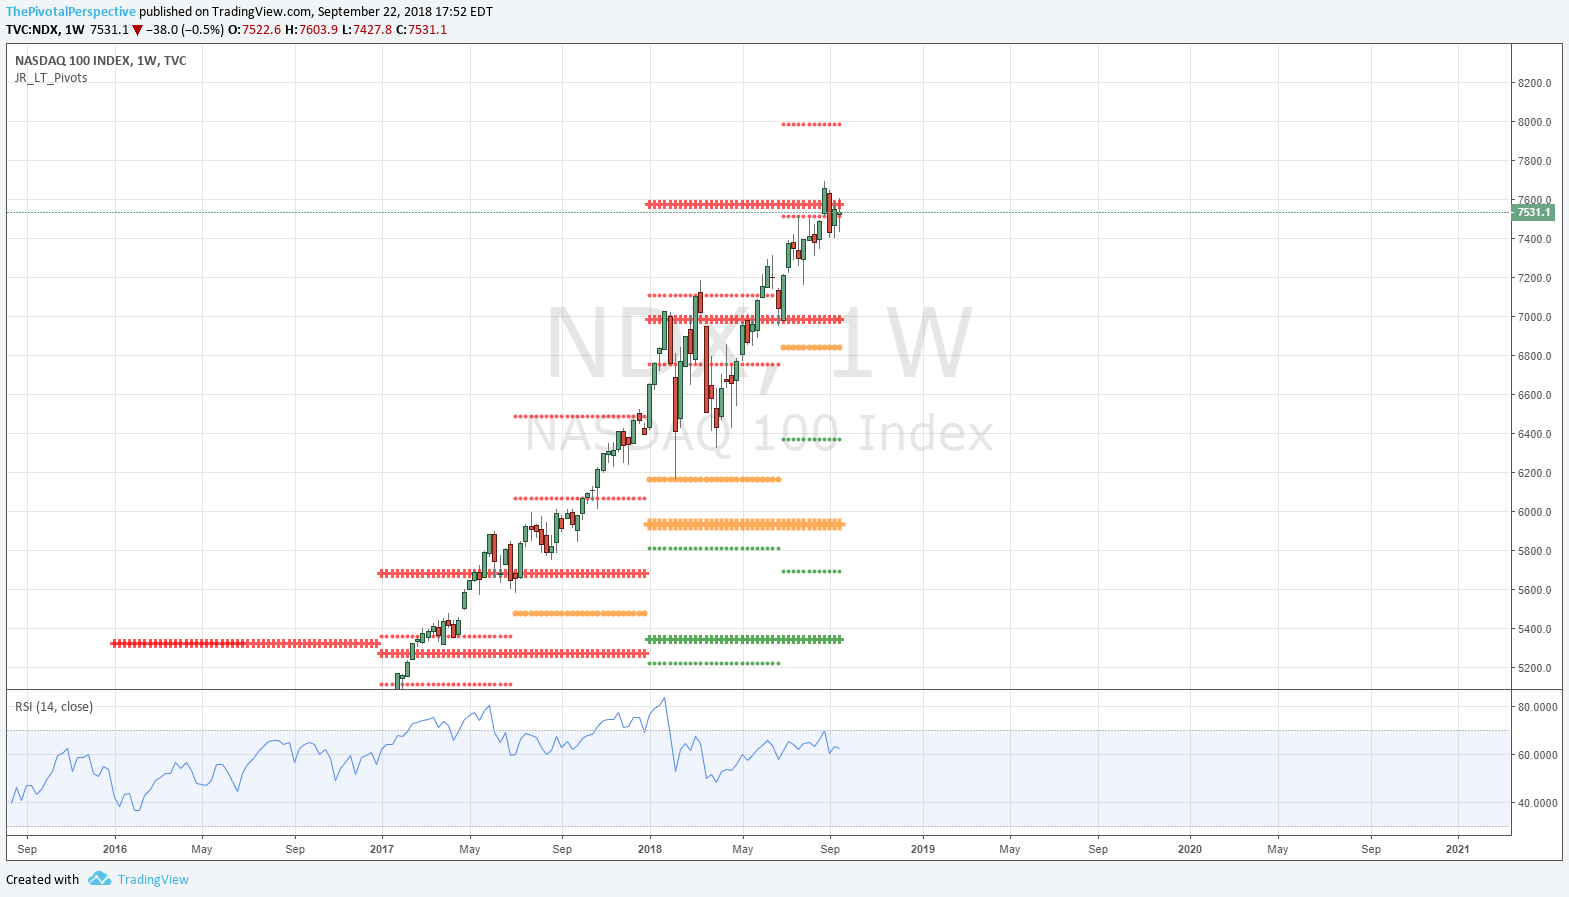
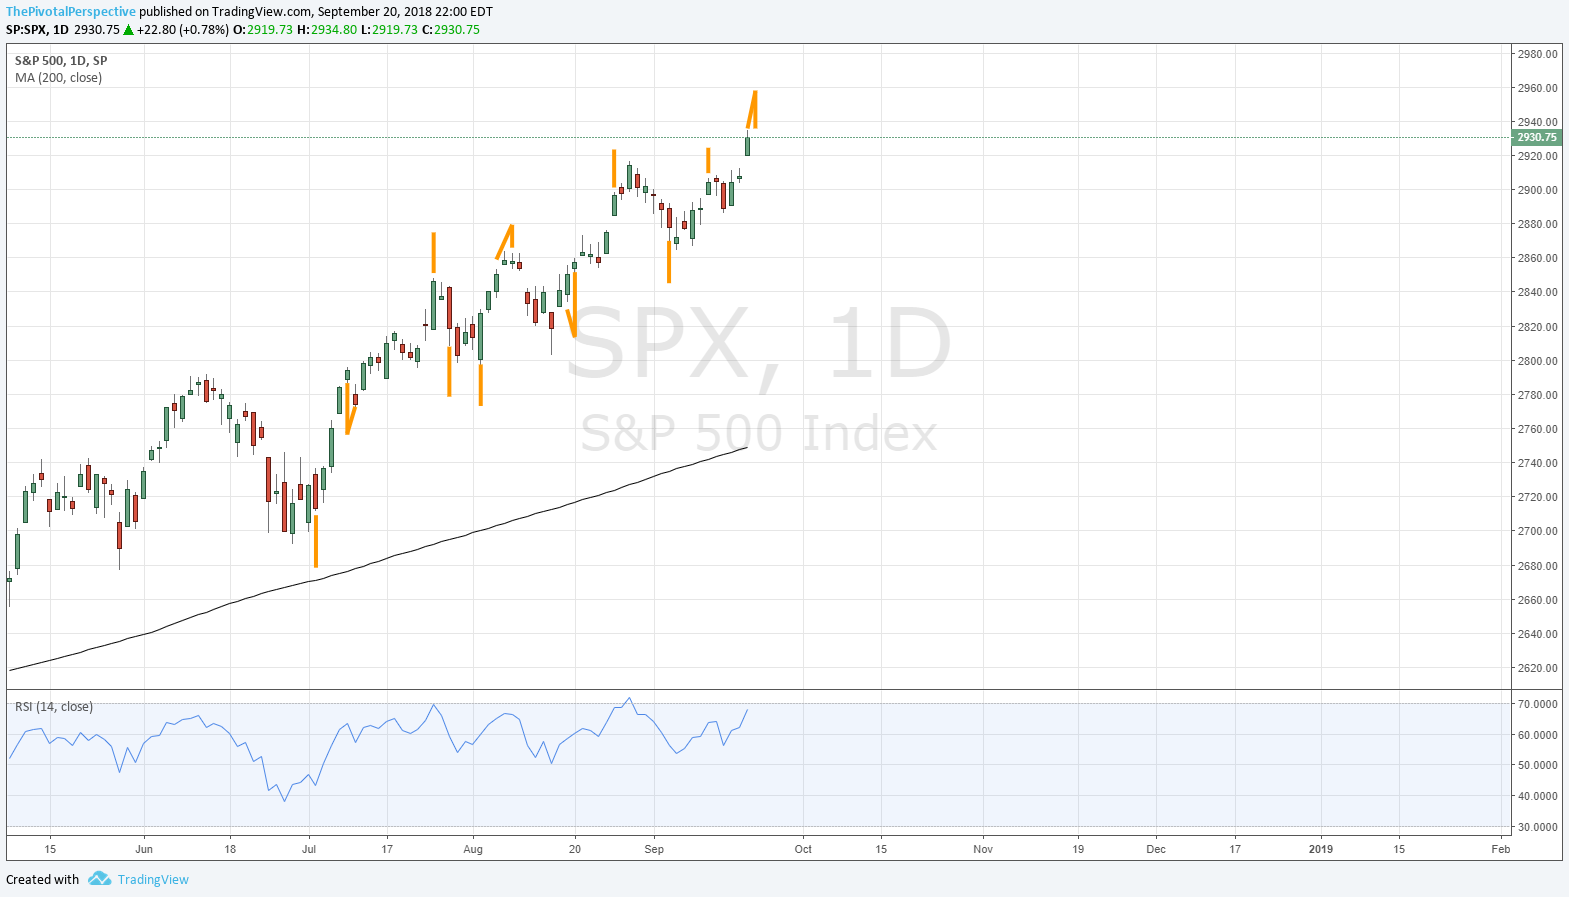
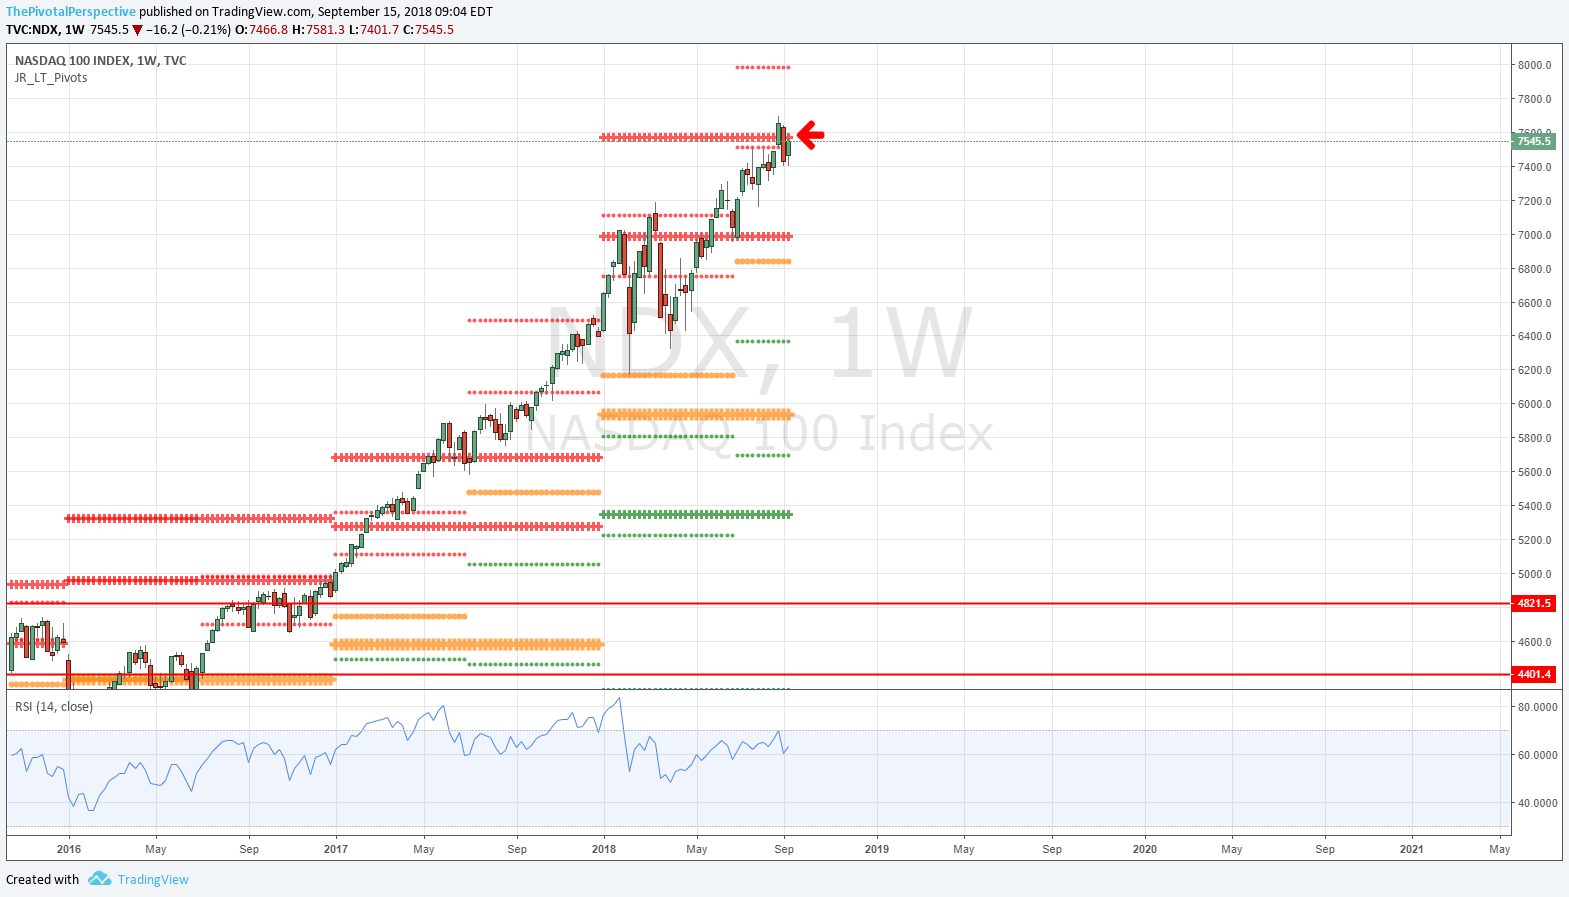
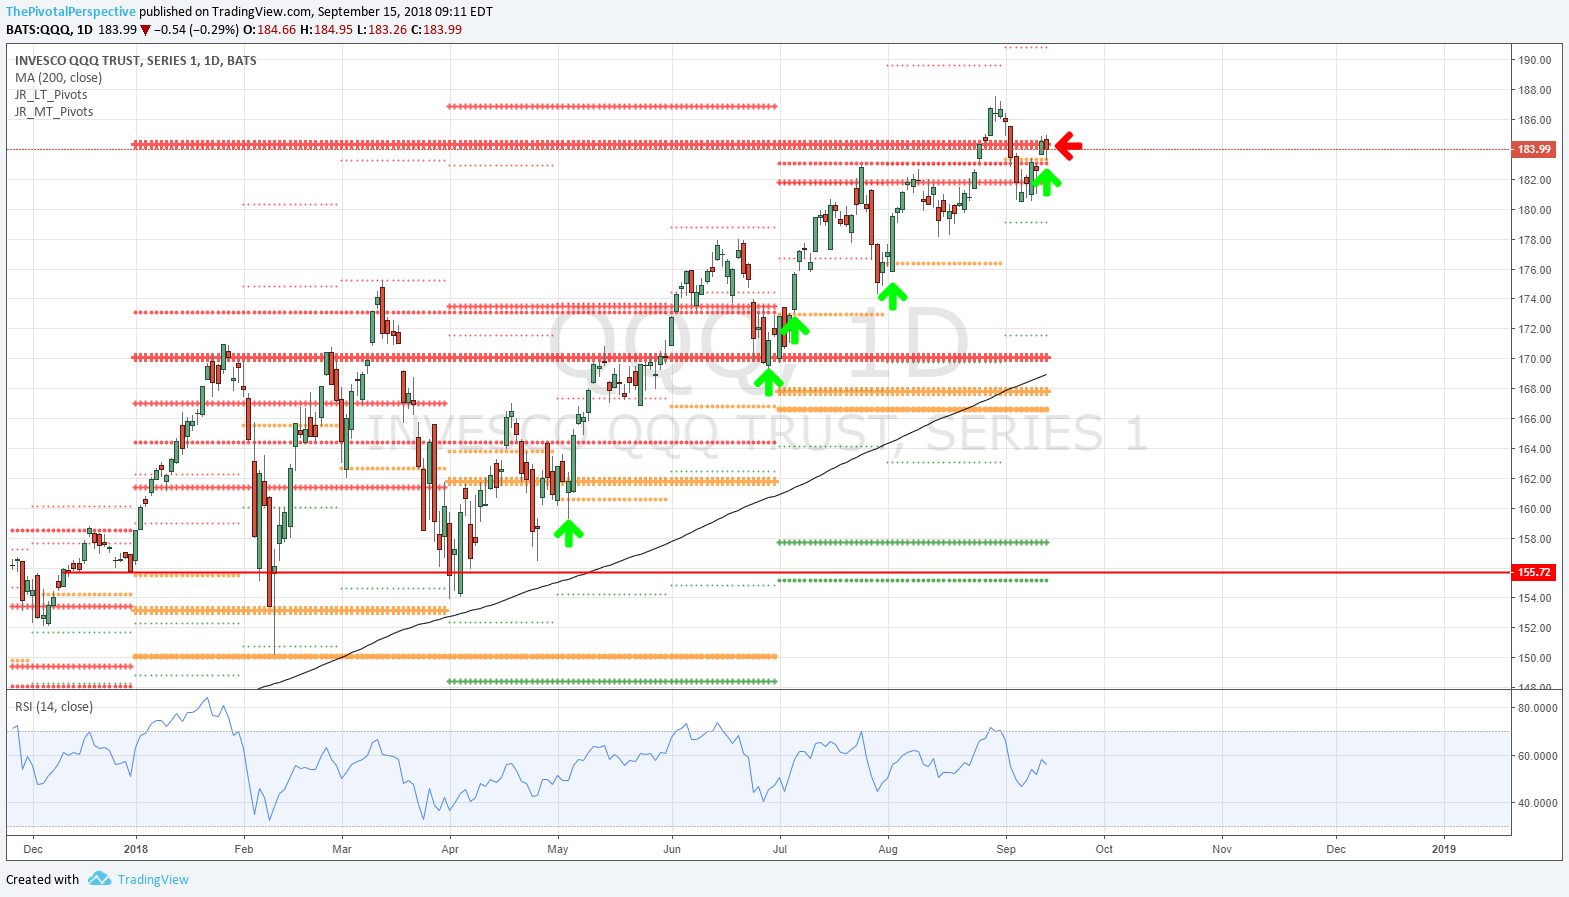
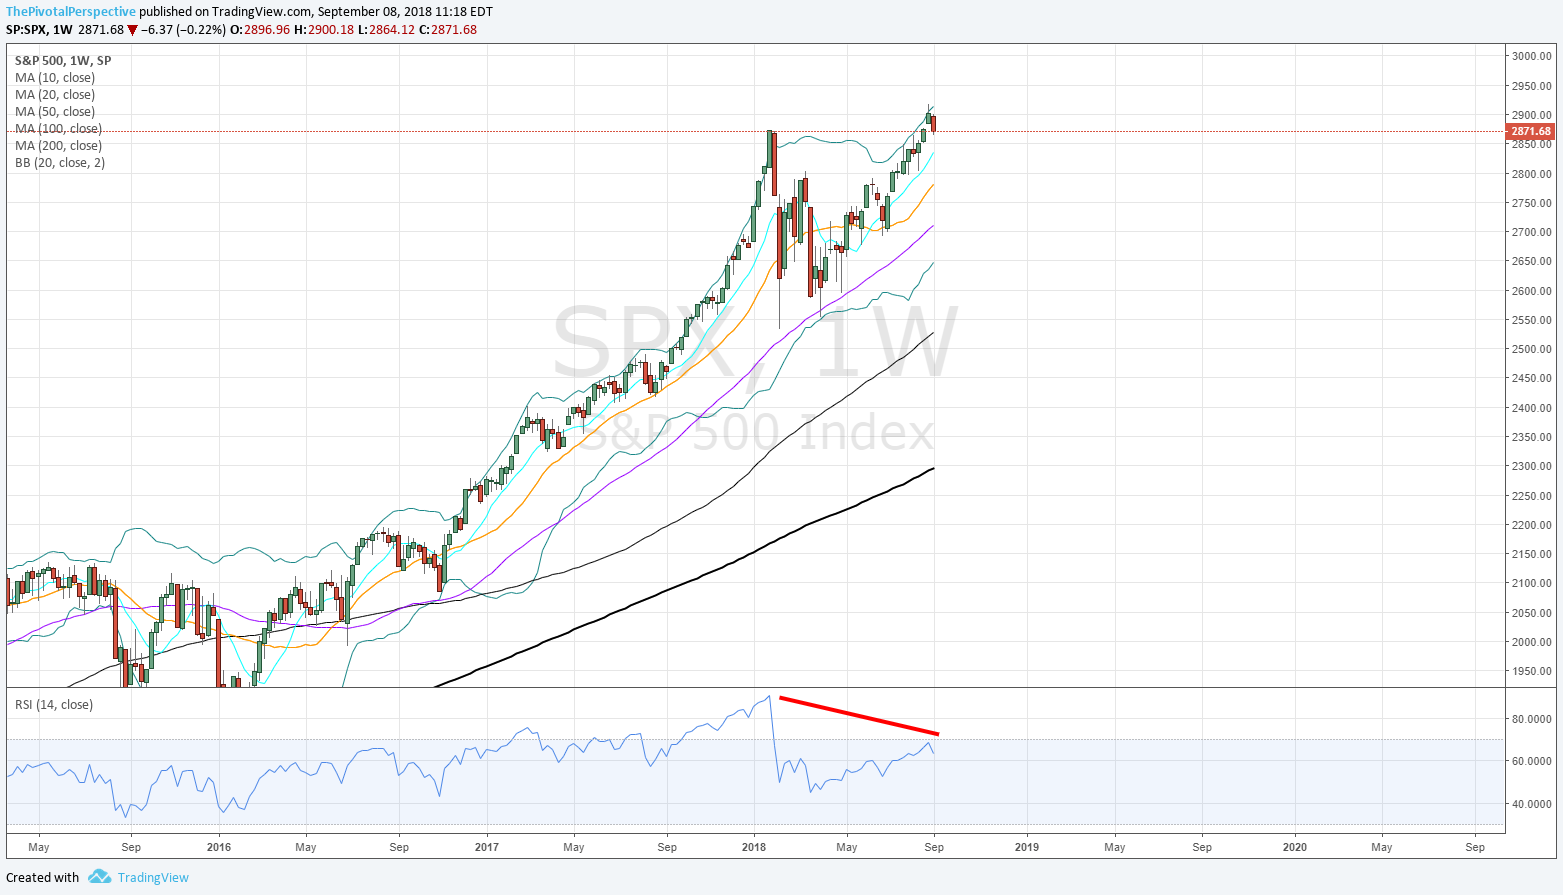
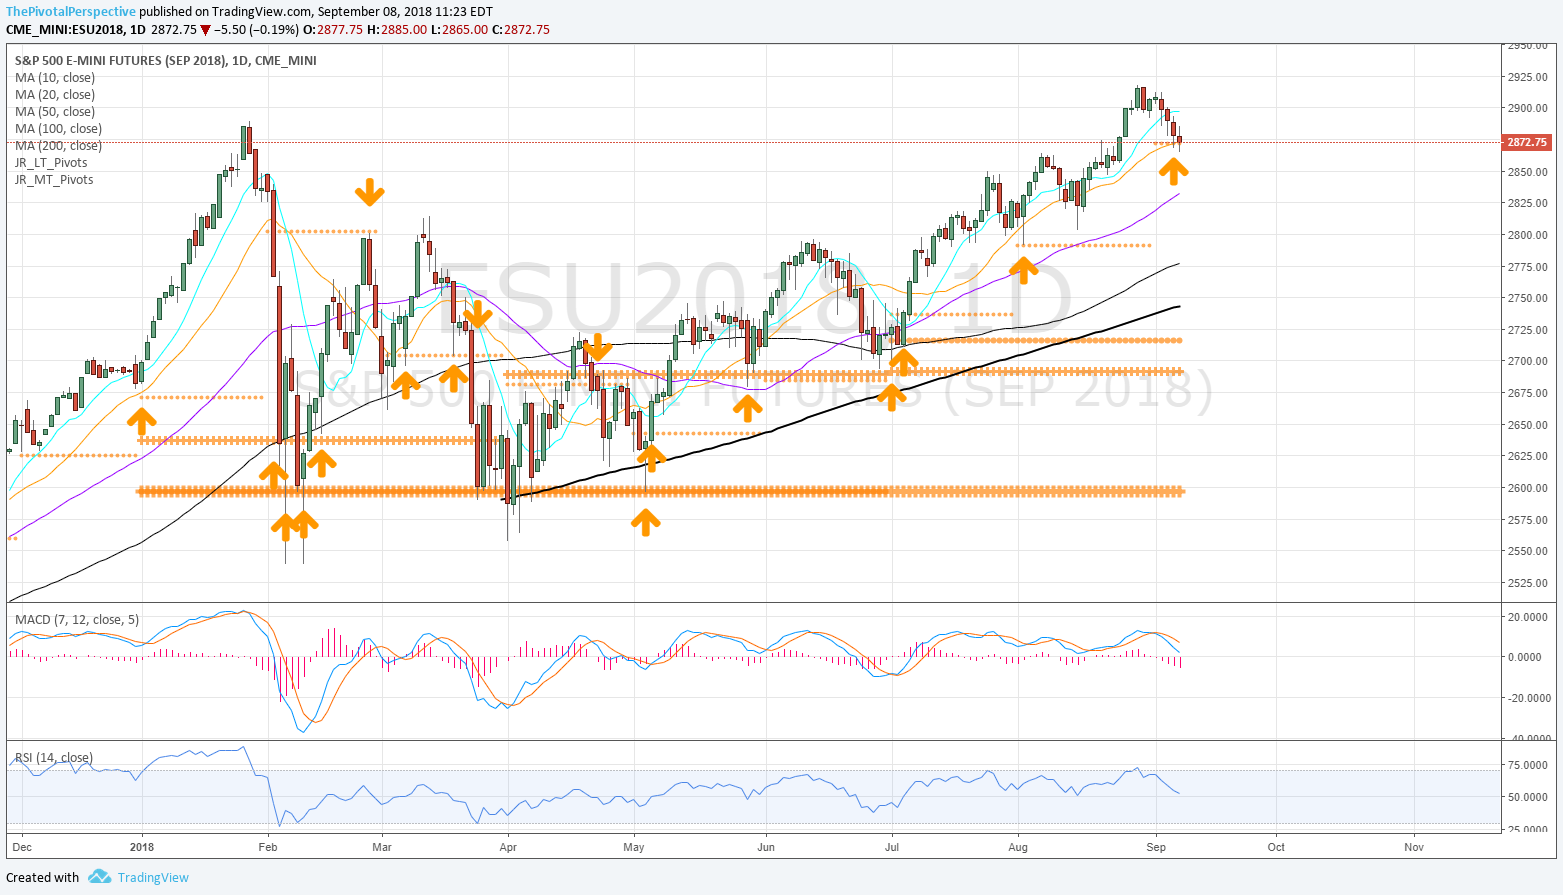
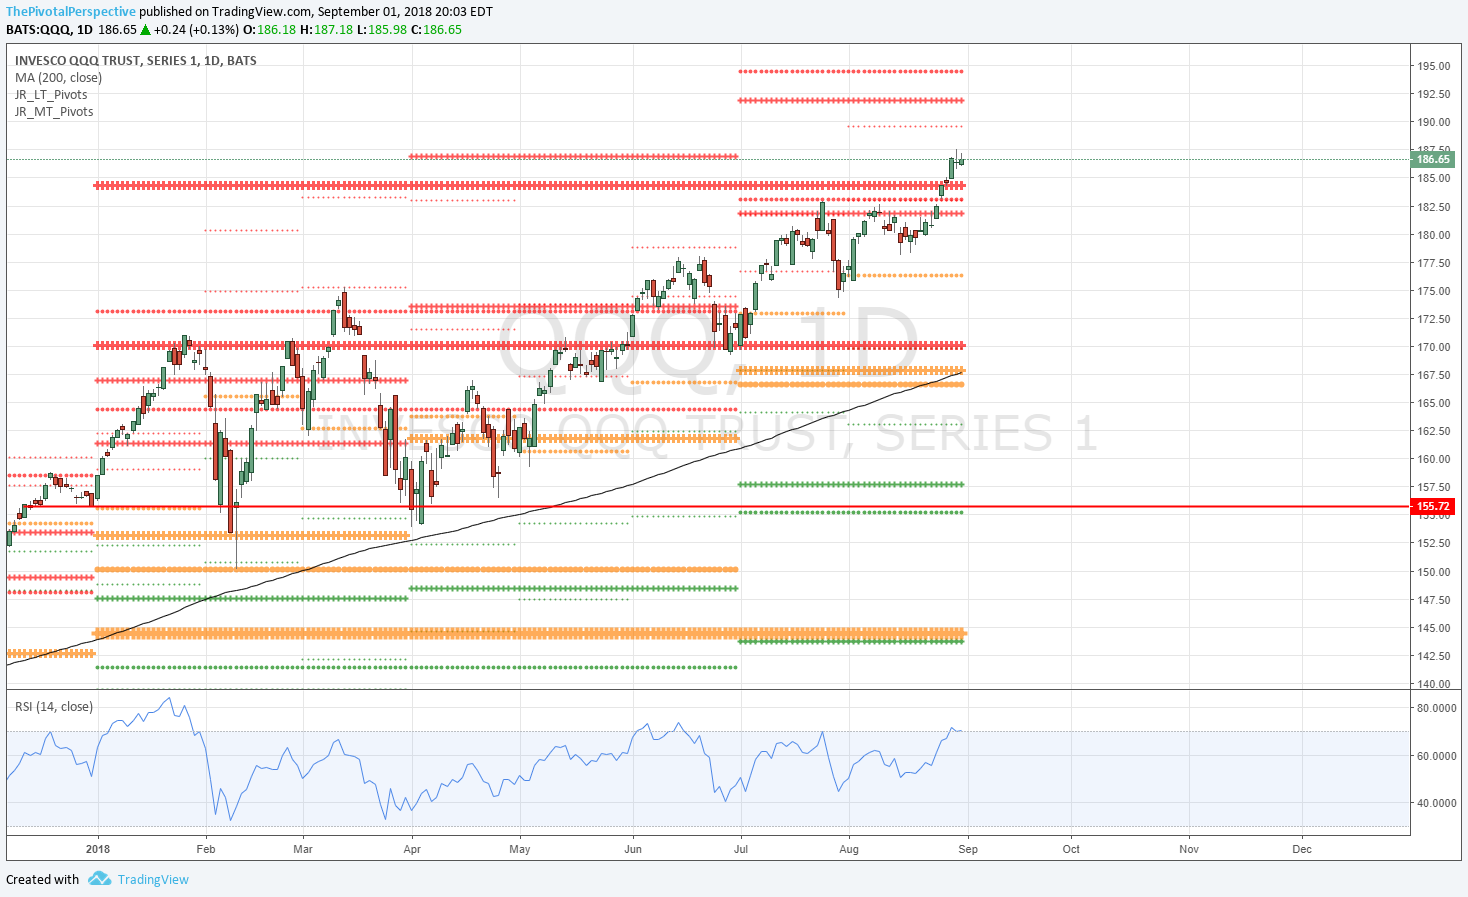
Last week 2 main indexes cleared major resistance - SPX above HR1 2883, which as long as that maintains, points to the chance of YR2 at 2987. Similarly NDX cleared YR2, and as big turns can happen at major levels it is more bullish for the market for the index leading in gains to be above resistance.

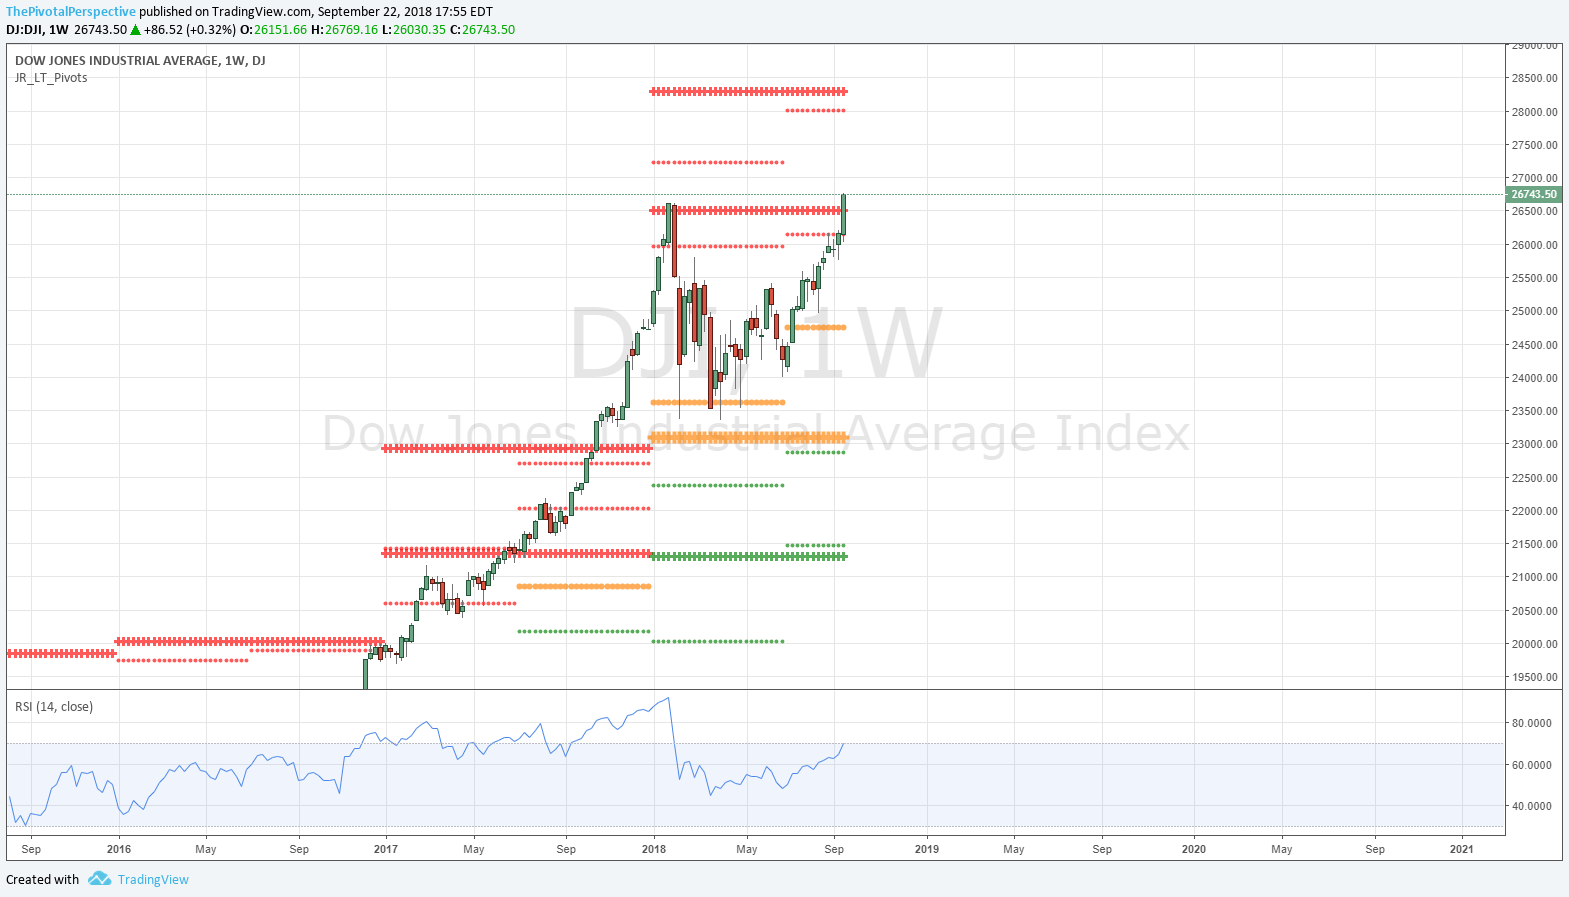
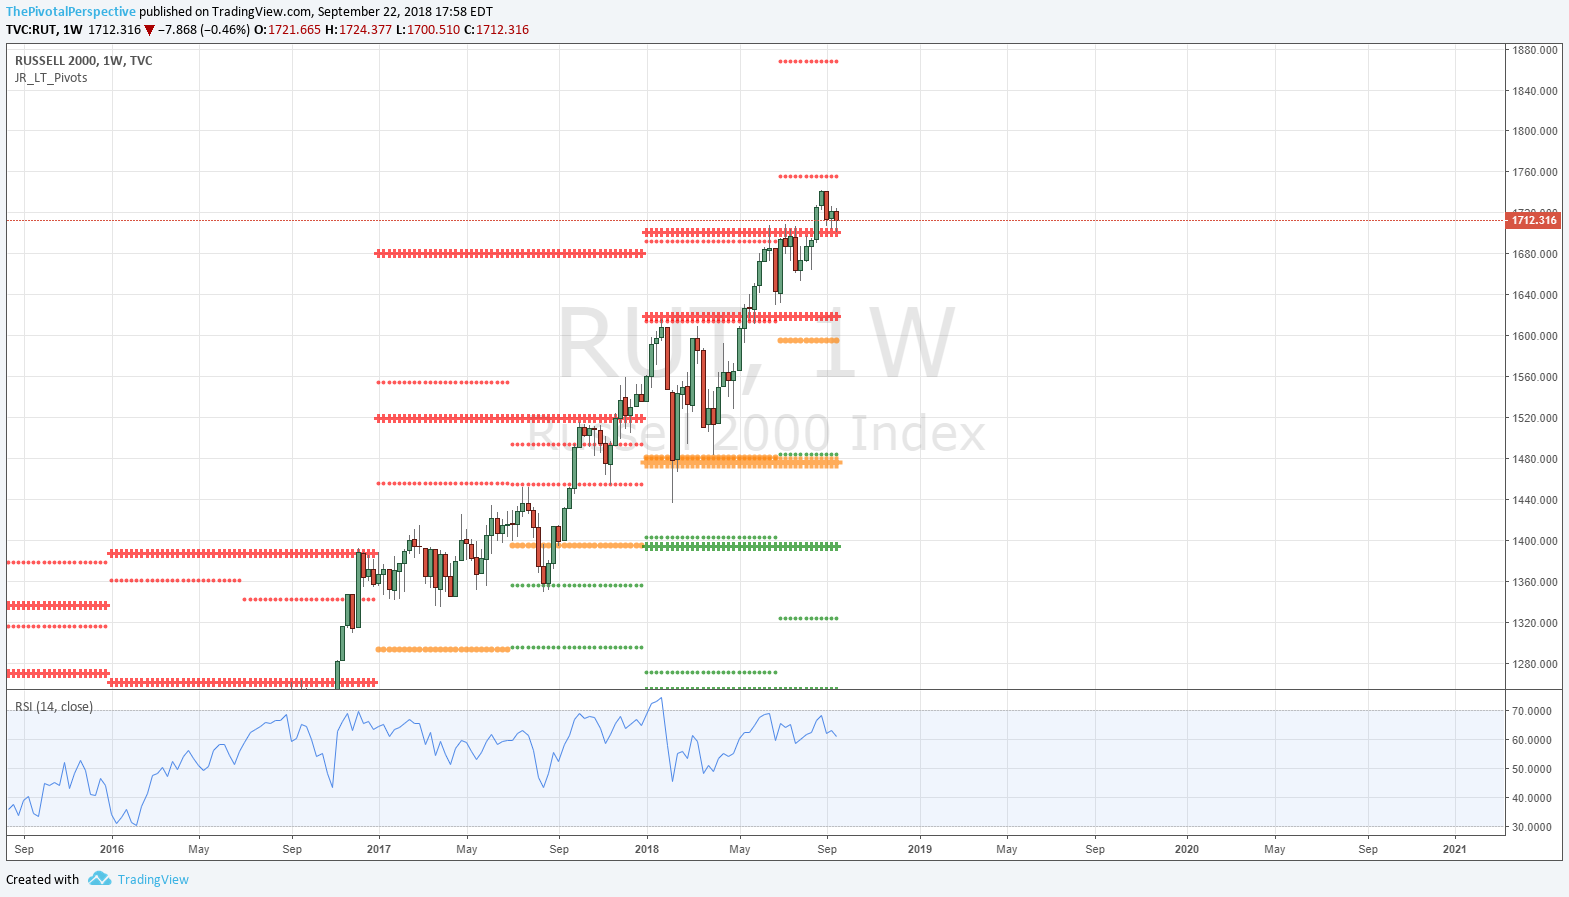
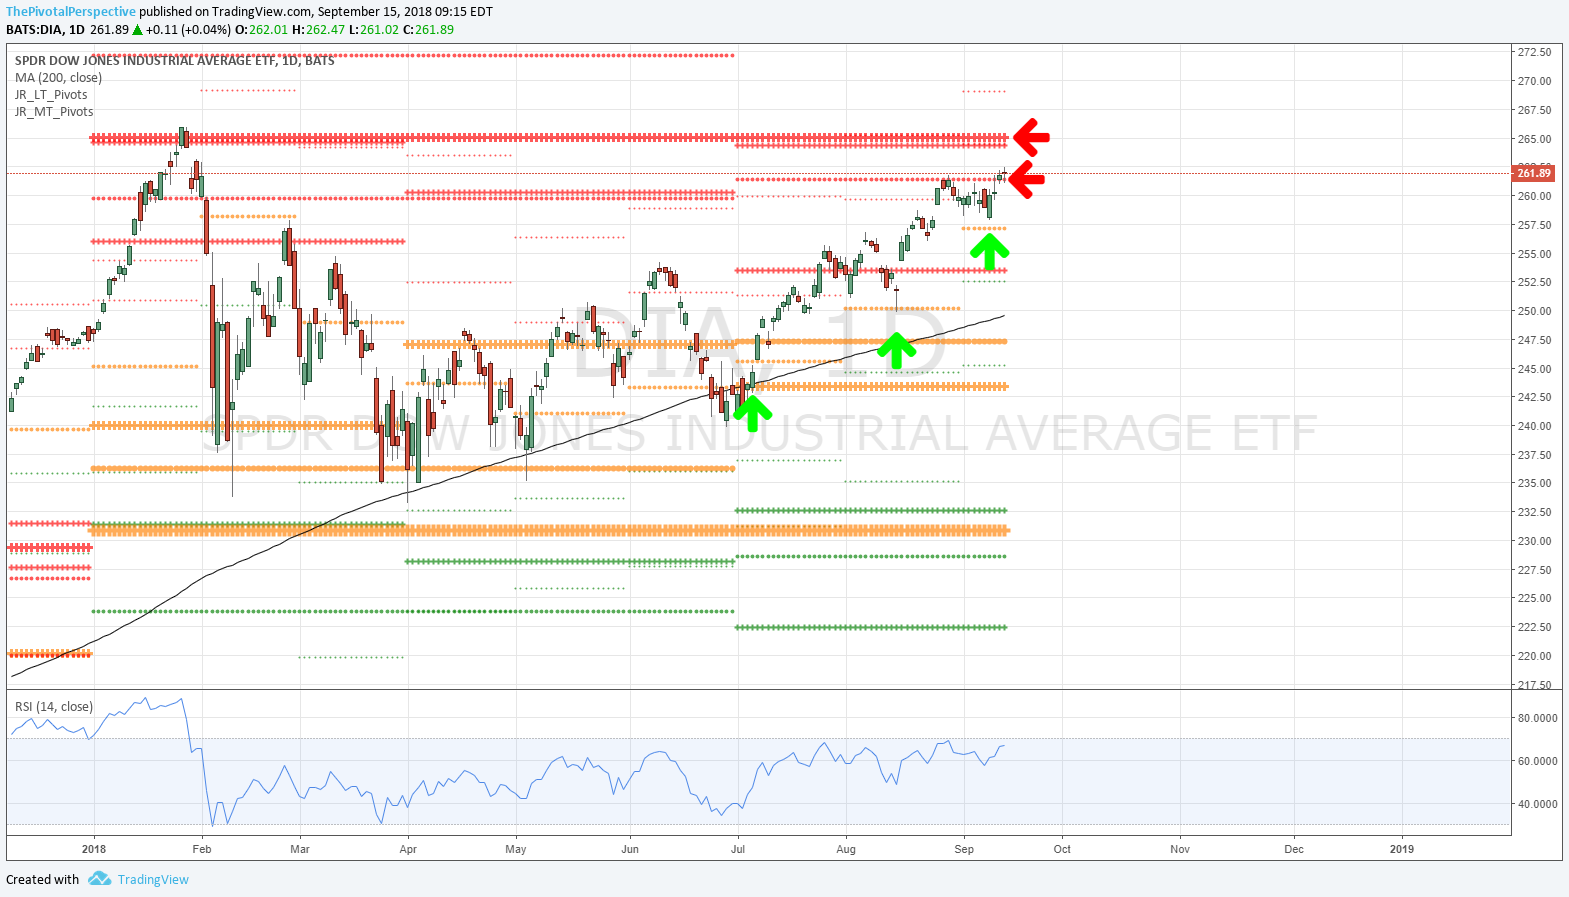
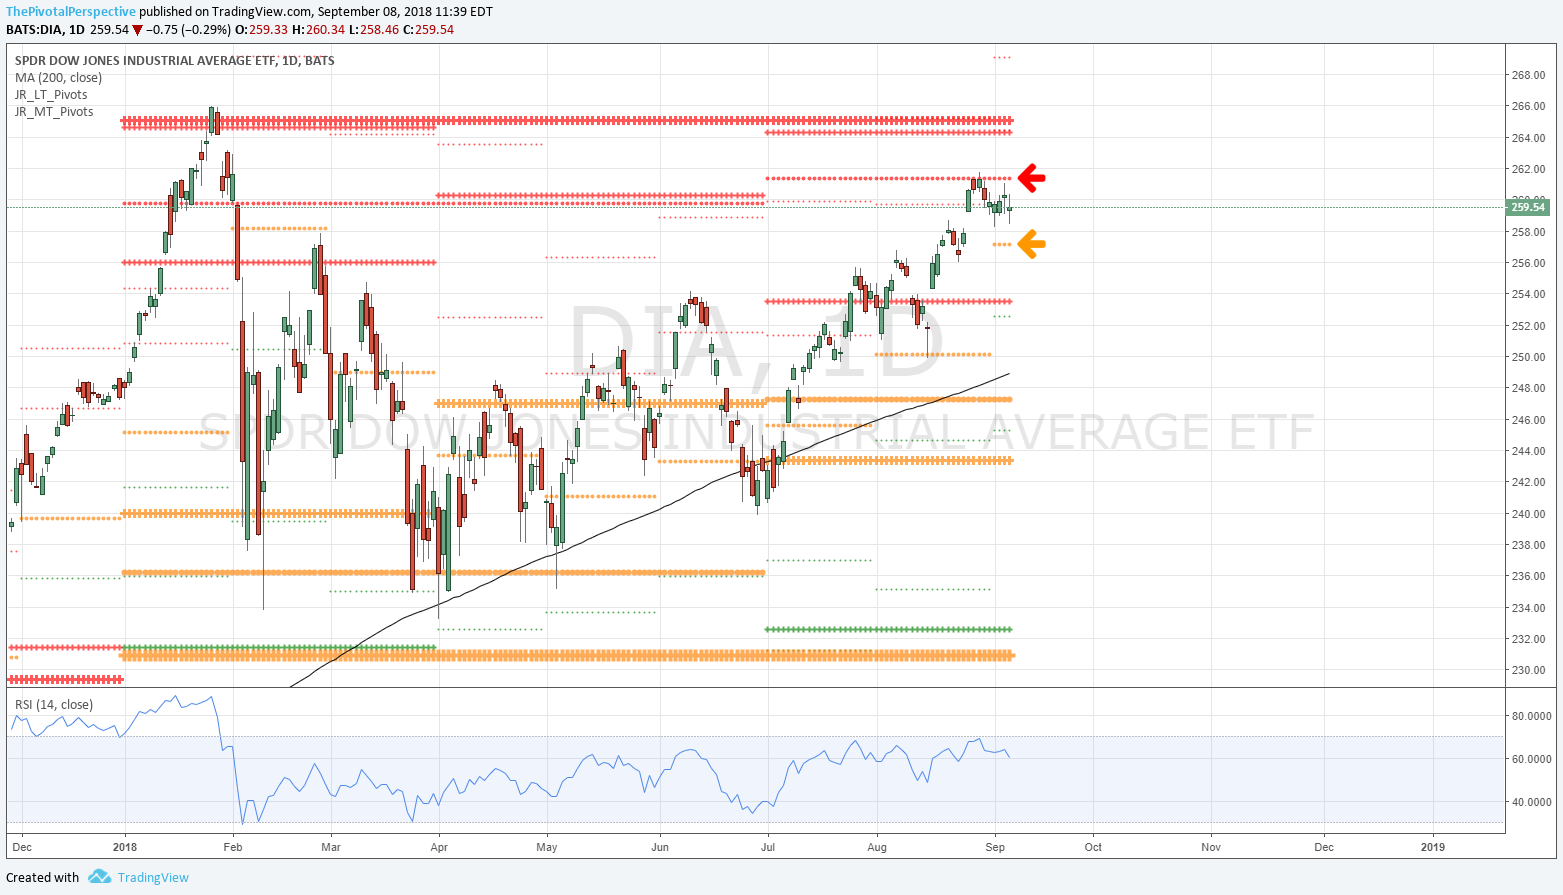
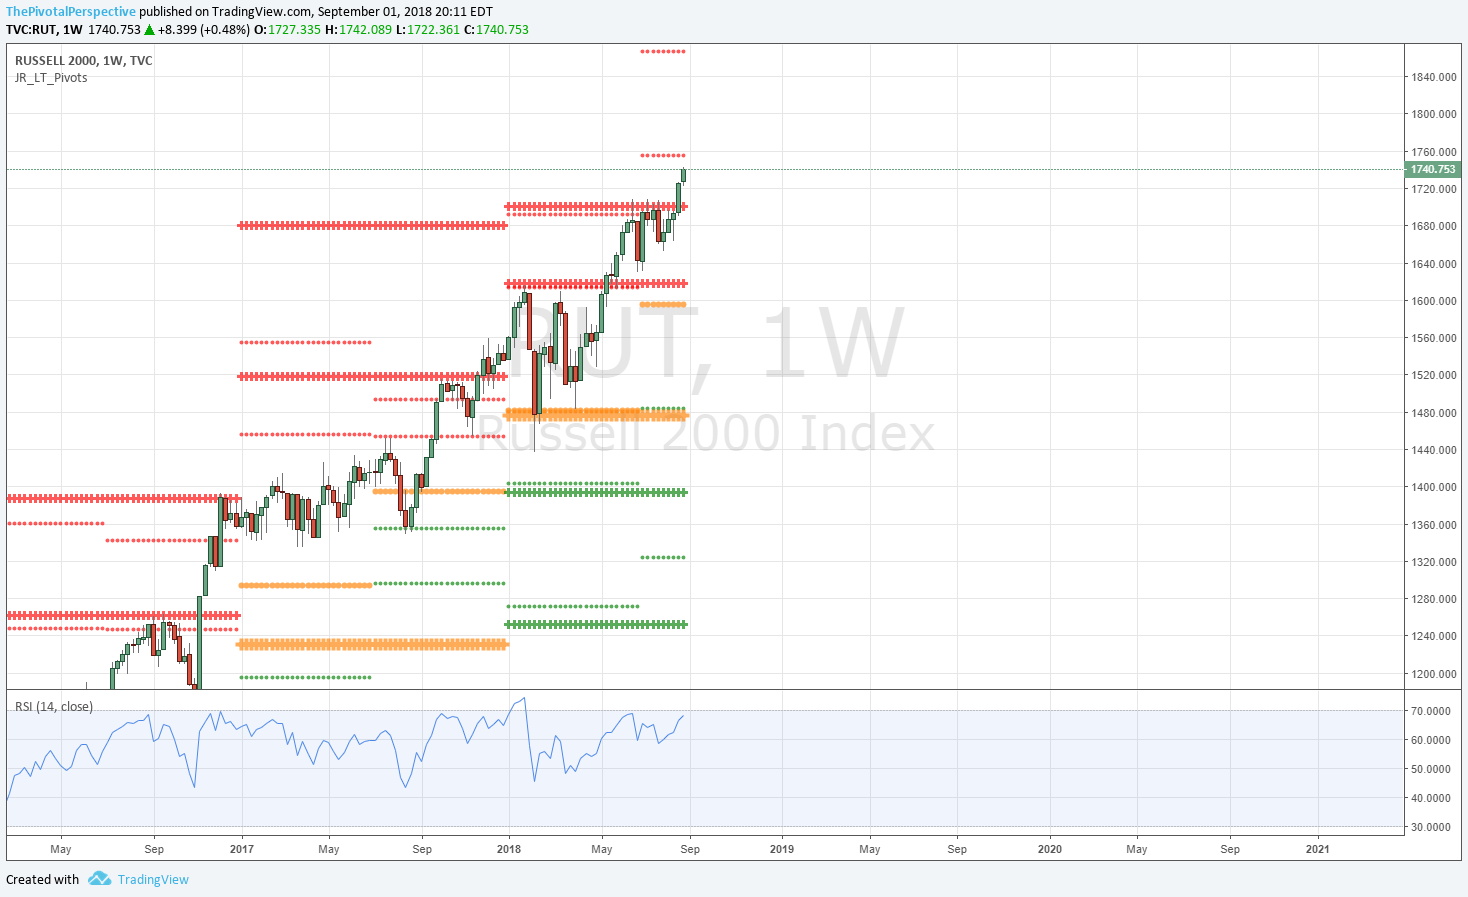
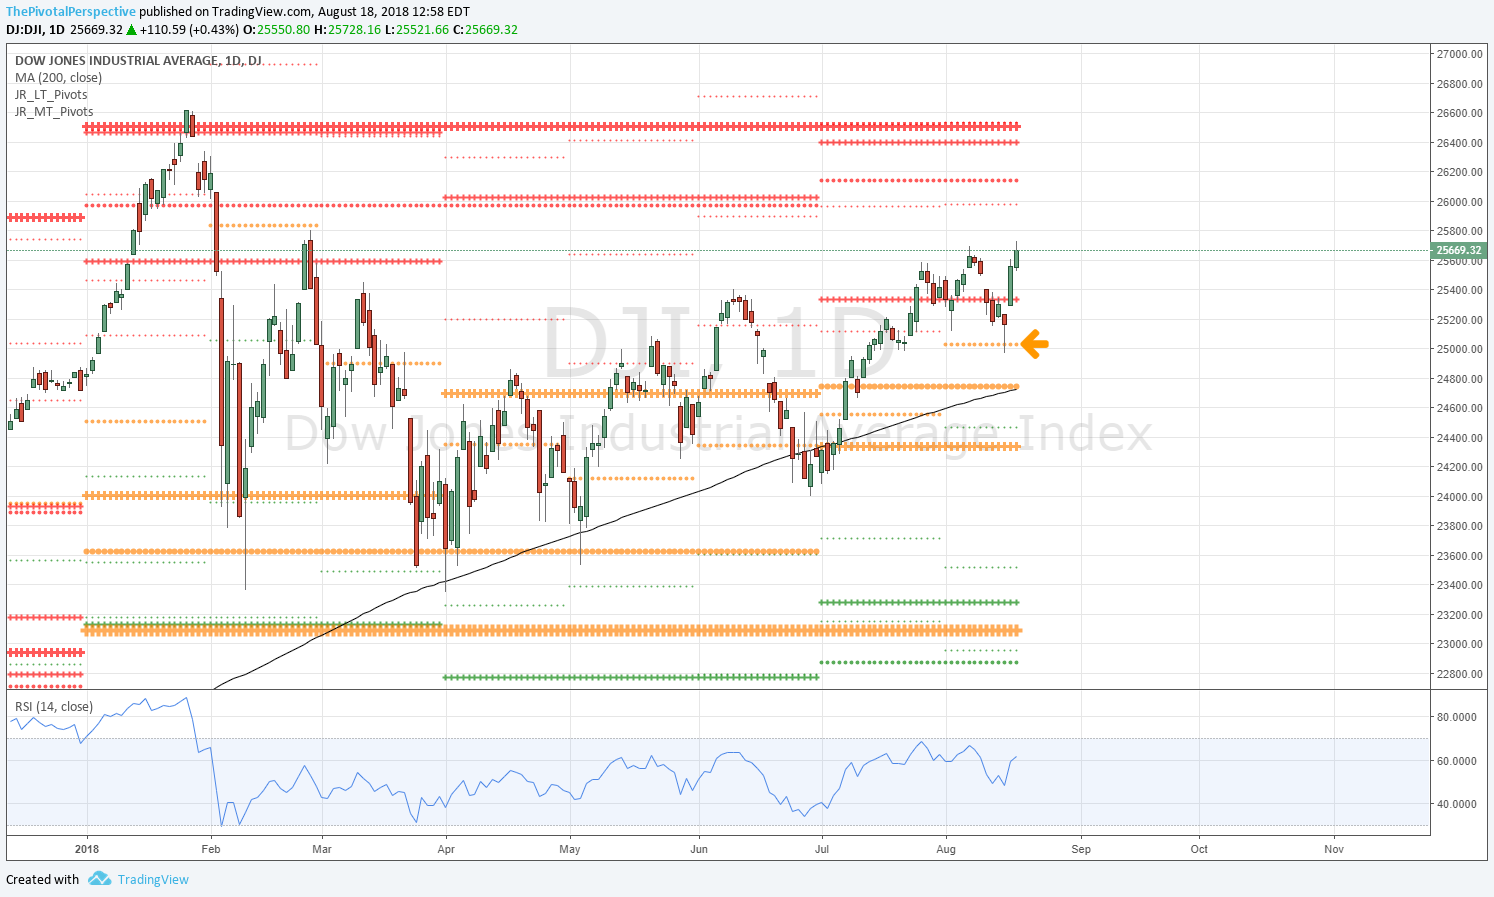
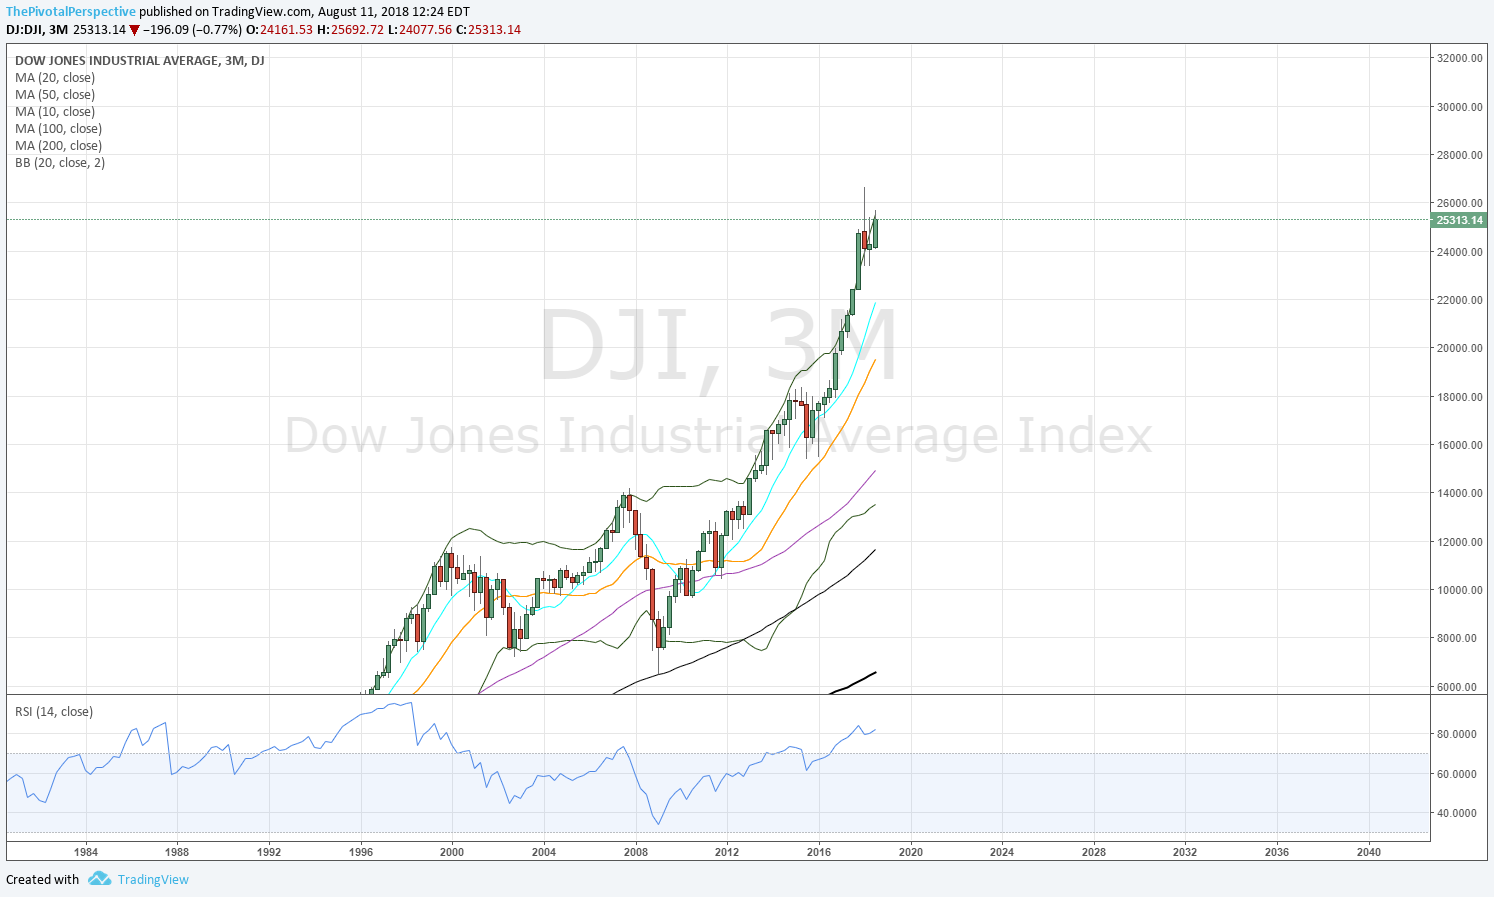
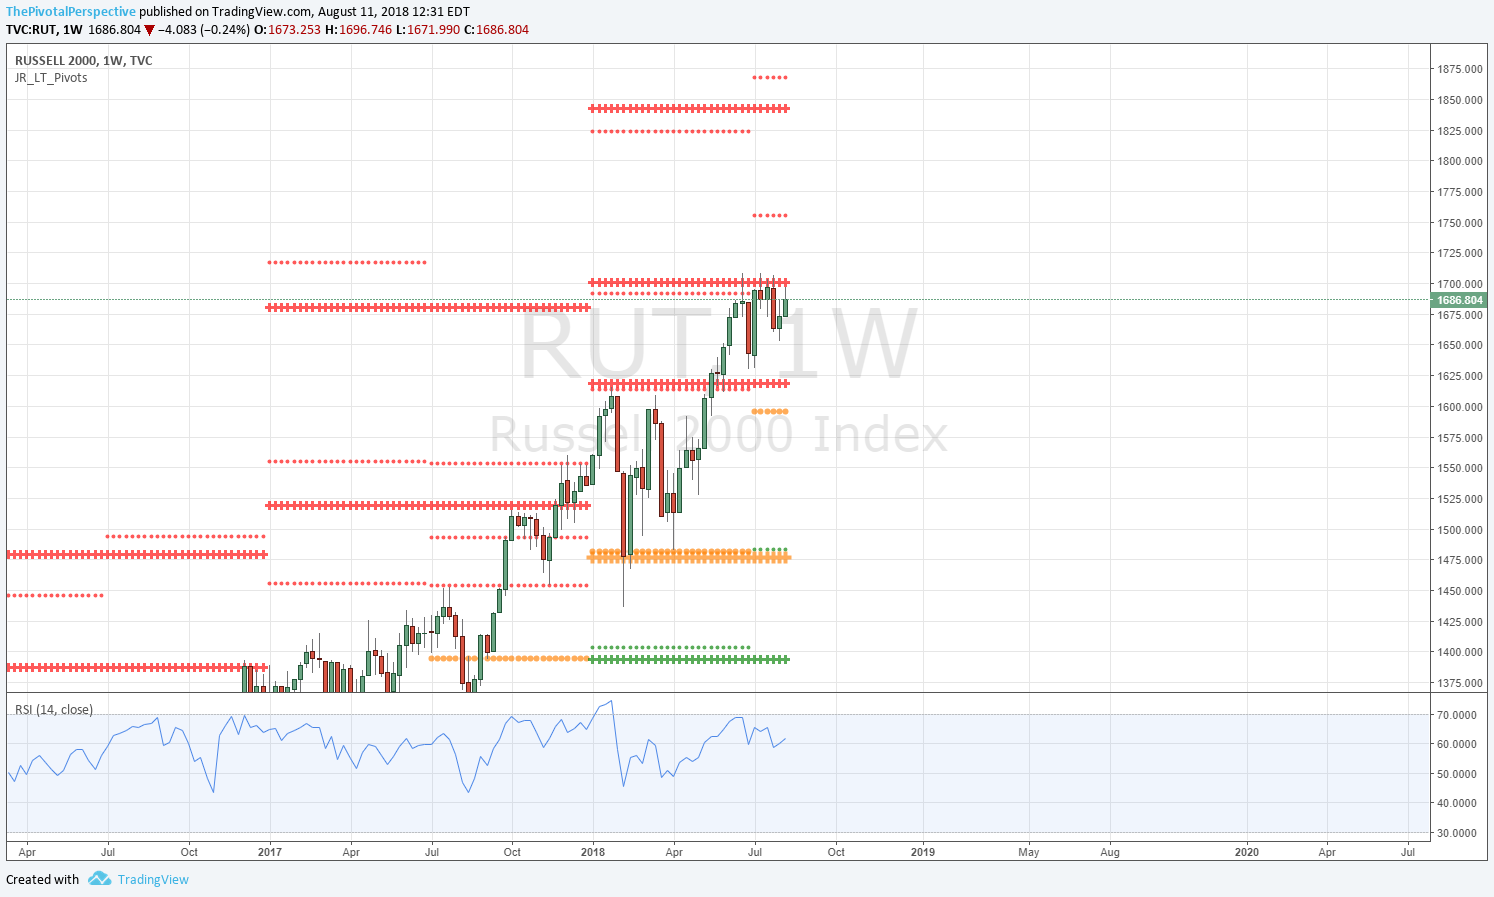
However, DJI stopped bang on its HR1, and RUT is testing QR1. Indexes are overbought or nearly so across timeframes (Q M W D), and a pause or small pullback week would be normal at this stage.

As usual it is international trouble that is leading the way lower, with all 3 China related ETFs, FXI EEM KWEB, trying and failing to recover yearly pivots on the weekly close. 

In addition, sentiment while not extreme is starting to be more of a headwind than tailwind, with PC and PCE dropping down to lower end of 2018 ranges. Other indexes like AAII bull bear spread is the 3rd highest since Q2. 

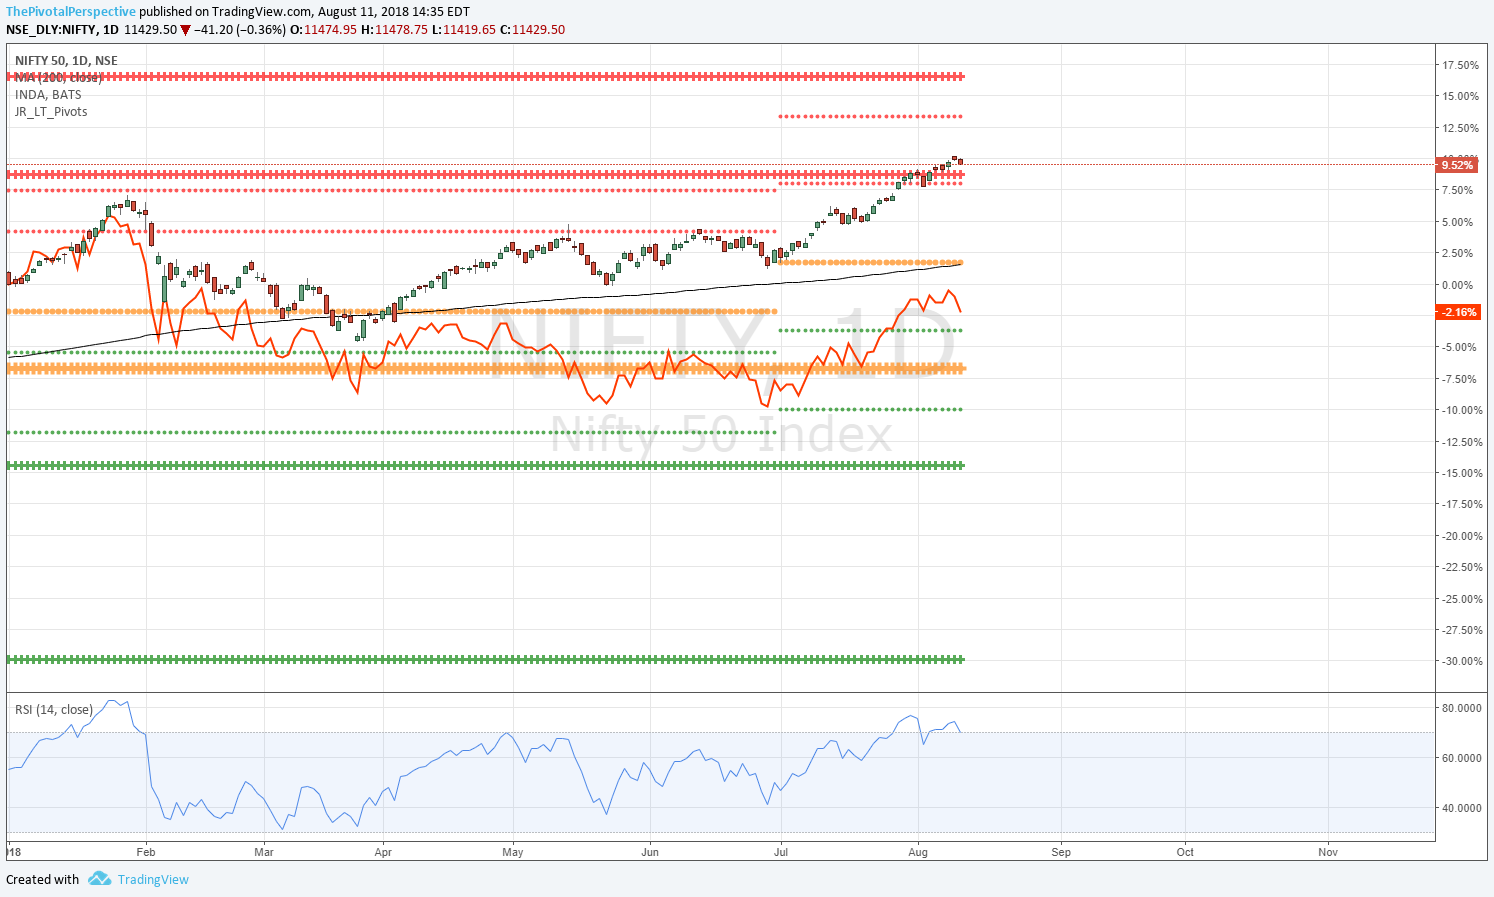
Recent long focus has been: SPX, NDX, RUT, XBI, SMH, INDA, USO. If indexes do suggest weakness then hedges could be DJI short, TLT long should it rally back above HP again, or FXI short with maximum risk a daily close under the YP. While not threatening, VIX and VXX have not made lower lows on the recent move higher in indexes, which is some sign that smart money is starting to play for a fade. 

Due to strength of NDX and SPX I do not expect a major top here, but if NDX fails back under its YR2 then the configuration could be more threatening. Until that happens market in buy the dip mode as I think pros are eyeing SPX 3000 area, which is well under 18X forward earnings and very doable. 

Bottom line - Often DJI pivots give the definitive tells. The market just stopped at DJI HR1 so taking steps to lock in some gains, or play for a bit of downside while holding longs, should work or will have low cost at worst. In addition, September is known for weakness followed by a strong Q4 especially in bull markets, so a strategy for near term weakness but likely higher highs seems to fit the market here. 

PIVOTS
USA main indexes - SPX and NDX cleared long term resistance levels but DJI did not. (RUT had already cleared the prior week.)

Sectors of note - XBI and SMH both recently held key support, and noting this helped the tech trade. 

Developed - DAX has had several weekly closes below its YP this year, but what has started to happen is that the weekly 50MA has been starting to roll over with downward slope. Um, this is my technical definition of a bear market. USA may ignore this for a while but not forever. Nikkei is above all pivots and participated in the recent rally but not above January highs yet.

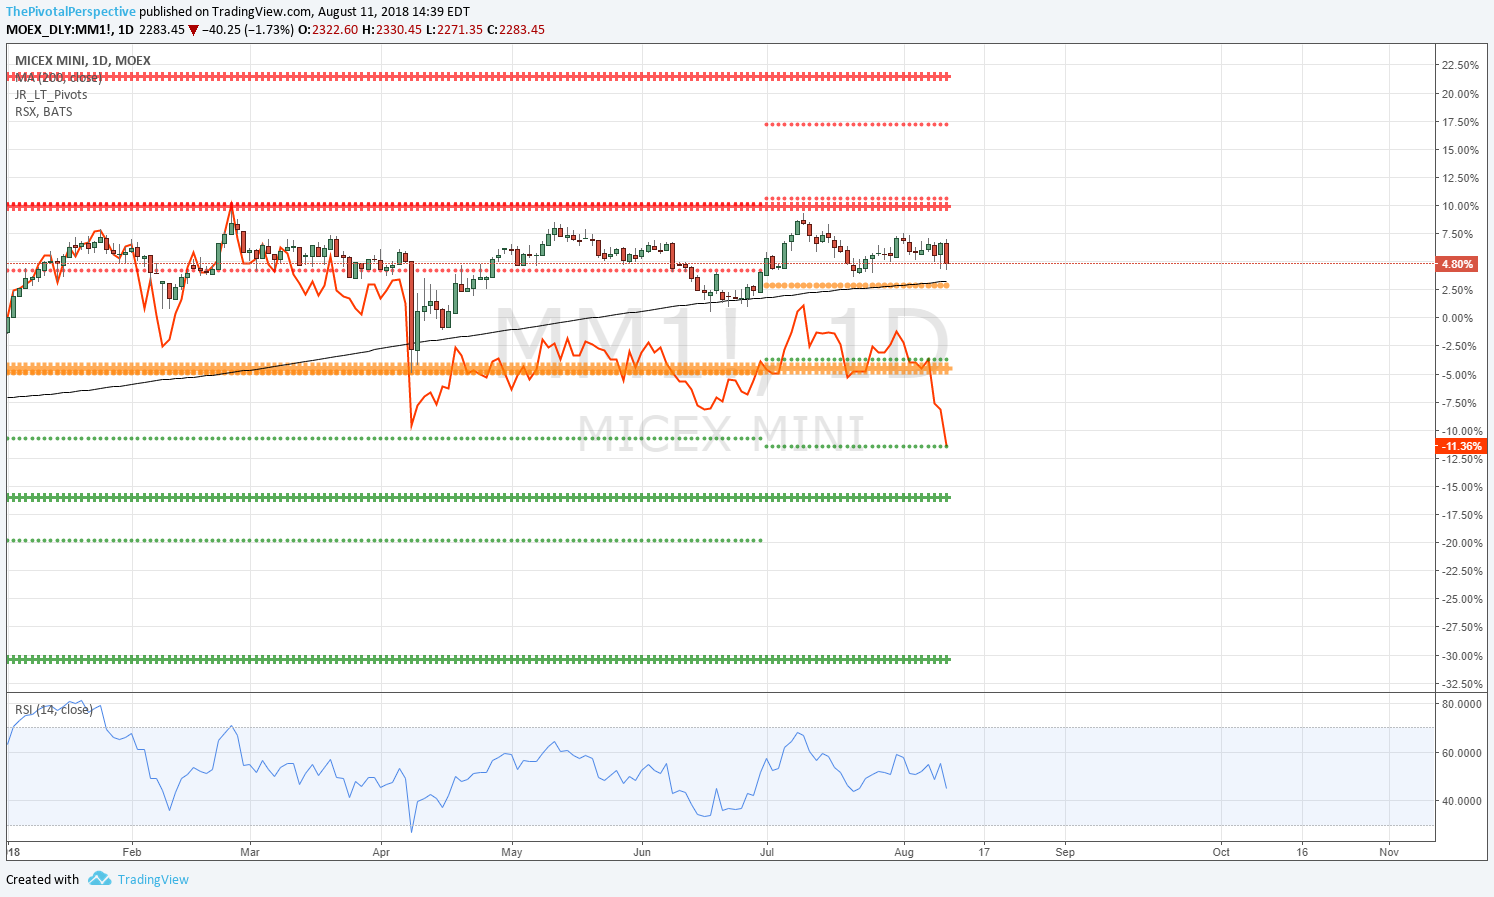
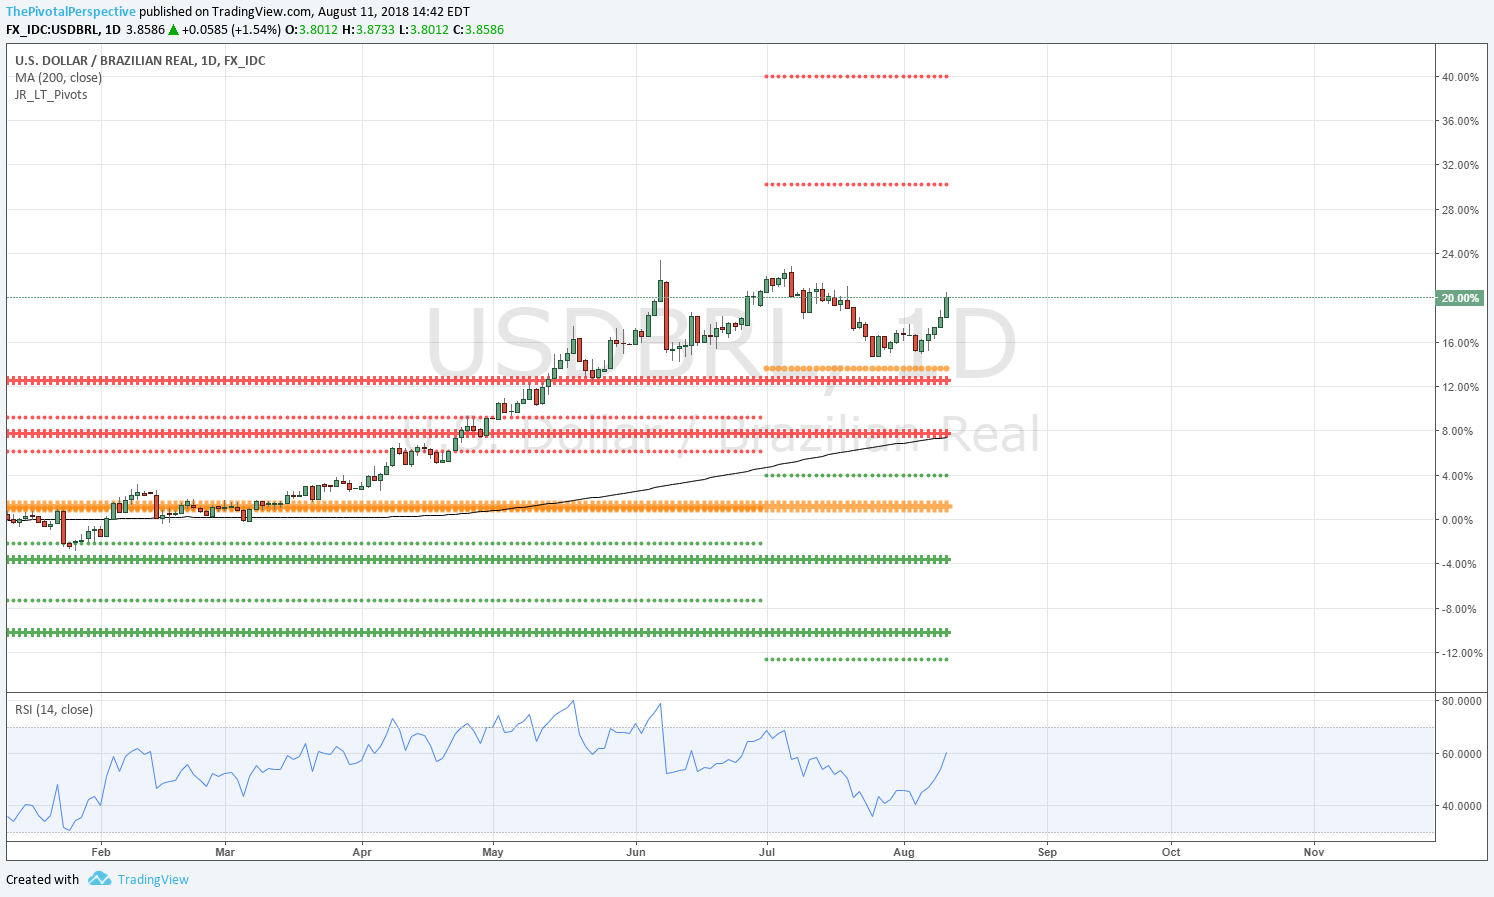
Emerging - As noted above, FXI, EEM and KWEB briefly recovered YPs but failed on weekly close. EWZ and RSX are of course well under YPs. This leaves only ACWI (index but not really trading vehicle) and INDA in any bullish condition, and both above all pivots. 

Safe havens - VIX jumped back above its YP last week, but held the MP as support. I'll be watching the new monthly pivot very carefully because VIX above would further confirm to play defense for a bit. TLT has been testing its HP. Rally above, fail, another attempt above and fail. This is a crowded short so may work in a risk off situation. Not sure if metals have bottomed. GLD is above YS1 but GDX has had a very weak bounce and already back near lows, and the same for SLV. 

Commodities - Just off the oil lows I noted that it might have been it and bam 2 weeks later back near highs. This has been a strong move and helped risk on sentiment. Big jump came on recovery of HP and then after holding its MP another strong advance.

Currency - Not sure what to make of DXY here. Monthly bar looks bearish, weekly looks ready to rally. YP resistance, so we'll see where the SepP falls. 

Cryptos - BTCUSD again testing QP from underneath so a 2nd move above would be bullish and noted by smart money as D200MA is starting to flatten and slope upward. For now edge to bulls as it is above SepP.

OTHER TECHNICALS
Overbought across the board would mean Q M W D and 2H session ETF charts. This condition there or nearly so on quite a lot of USA main indexes recently.

VALUATION
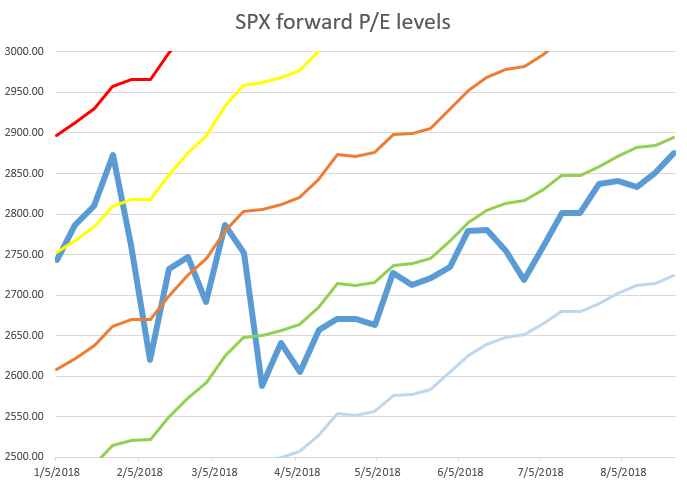
SPX tagging 17X forward earnings on moving average basis. (Green line 10 week avg of 17X forward earnings, blue line SPX weekly close). Valuation levels still trending up nicely which means rising profits. 18X currently 3075.

Sentiment
PC 10MA on the lower side of 2018 values. 

TIMING
See this recent review. 

August dates (posted 7/22 Total market view)
8/2 - Stock pullback low
8/6-8 strong - "Seems like setting up for high"
8/17-20 - 8/21 minor high and mild pullback

8/27 (adding) - Missed top by 2 days so not close enough, non event. 

September dates

9/6
9/13
9/20-21

USA main indexes

Sum
The 2 USA leaders, RUT and NDX, have powered up above YR2s in the last 2 weeks. SPX rallied above its HR1 last week as well, and if it reaches YR2 this year that means a move to nearly 3000. But DJI and NYA look considerably weaker, with DJI topping bang on HR1 and looking like down more likely as the next move. NYA similar to DJI but not yet on resistance. 

3 of 5 USA main indexes just cleared major resistance and that is bullish. That said, near term pause looks a bit more likely. 

SPX W: Above HR1 2883 opens door to YR2 near 3000.
SPY D: Between levels.
ES D: Last touches of MPs have been the key pullback buys in May, July and August. 
SPY 2H: Last touch of WP was 2 weeks ago - very strong but due for another test. 
SPX sum: Bigger picture above HR1 points to YR2 near 3000. Near term suggests pause week with nearly all timeframes overbought near near overbought. 

1 3 ES D.png
1 4 SPY 2H.png

NDX QQQ
NDX W: Power up above YR2, very strong.
QQQ D: Next targets significantly higher.
NDX sum: Leader still leading with strong move above YR2. 

1 5 NDX W.png
1 6 QQQ D.png

DJI IWM
W: HR1 resistance. 
D: Fade under HR1. 
DJI sum: Clearly weaker with trouble at HR1 and bar suggesting lower as next move. 

1 8 DIA D.png

RUT IWM
RUT W: Heading towards HR1. 
IWM D: QR1 resistance with HR1 above that. 

1 11 RUT W.png
1 12 IWM D.png

NYA
W: Not at levels
D: Near tag of AugR1 for the high.

1 NYA W.png
1 13 NYA D.png

Total market view

REVIEW
8/19/2018 Total market view: "The current configurations point to higher before a top of significance. Sentiment per put call is fairly bearish, valuation hanging around mid 16s per SPX forward P/E, and even a return to 17X implies a test of SPX 2018 highs at minimum. ... of all the sectors that look ready to propel higher I think IWM and other various small cap growth will make the move." 

Result - IWM blasted through to new highs on Tuesday and helped pull other indexes higher into Friday.

SUM
Of the 5 USA main indexes, RUT IWM has jumped above YR2. SPX and NDX area currently testing major resistance. DJI and NYA haven't made it yet. Playing for the small cap breakout worked nicely as positions are now an easy hold above that level.

In terms of what is next, watching for reactions to SPX HR1 and then NDX HR1 / YR2. Due the following factors I think we will see SPX above HR1:

* 2018 2nd half trending nicely, not like start and stop of most of 1st half.
* SPX forward P/E in the high 16s; in January at the same price it was above 19 (this is how much the tax cut and positive environment has benefited corporate earnings).
* Sentiment not that euphoric, with put-call and equity only put-call near median levels for the year so far; in January put-call was at a multi-year low. 
* New highs / new low ratio looks fine.
* Growth / value ratios actually perking up again in favor of growth; out-performance of value along with bond strength would be a concern.
* VIX trading below its YP helps the bull case.

All that said NDX YR2 will be an interesting area to watch and some reaction possible from that level. 

At this point, only recent bond strength with TLT above HP and D200MA is questioning my bullish idea. 

Global indexes got a boost from a dollar index DXY back under its YP, a move I did not expect after the convincing clear earlier in August. INDA (first rec early July) looking great and the clear winner of the global indexes I track. EEM, FXI, KWEB all on the verge of recovering YPs which would add to the bull case. 

Another weak link SMH just jumped from a big support area - HP QP D200MA and then cleared MP, back above all pivots. XBI also held HP QP combo but did not finish above its MP. Still, tech perking up typically helps the market, and at least increases the chance of seeing NDX YR2 7572.

Bottom line - The Pivotal Perspective has been bullish since early July, and anticipated a minor shuffle from the 7/25 high. Adding back into small caps worked very well last week, so mostly in monitoring phase. While I would like to see SPX clear its HR1, I'm not sure that NDX will blast through its YR2 on the first try. Note that RUT was stuck under its YR2 after first test on 6/20 and had several selling attempts before it finally cleared - something to keep in mind for tech longs.

For now though SMH XBI both lifting off key support, and USO about to clear all pivots if there is room to put capital to work. Also watching EEM FXI and KWEB as a coordinated recovery of their YPs could be a decent setup.

SUM
USA main indexes - RUT IWM leading, first to clear above YR2. Note how many weeks it took to do that. Will NDX blast through on first try? I'm bullish on the market in general but think odds favor tradeable reaction down from that level. 

Sectors of note - XLE oddly tepid compared to USO but this has happened before and it could get in gear. SMH and XBI recovering / holding HPs helps the market.

Developed - DAX is below all pivots, but didn't have much of a drop before returning to test QP from underneath. Nikkei similar to SMH, a recent move below HP QP and D200MA and now back above all. 

Emerging - INDA the big winner in the second half. Perhaps instead of looking for others I should just be adding here. That said watching EEM FXI KWEB YPs this week.

Safe havens - VIX under YP helps the stock bull case, and VXX not on a level yet. Bonds showing some concern with TLT strength; actually returning to long term buy. 

Commodities - Last week I wrote that CL1 (continuous contract) has given many good signals, and although CL below pivots it may recover due to CL1 D200MA. Exactly how it played out with big rally in CL USO last week, with USO finishing on its MP; any higher and above all pivots.

Currency - DXY under YP, a move I did not anticipate after working so hard to clear. 

Crypto - If ETHUSD recaptures QP 7430 for the 2nd time then may have second thoughts about my 3-4K preferred low. 

OTHER TECHNICALS
New lows turning down as new highs perk up - bullish. Although you could say new high level far off June, so continuing motion higher would be helpful. 

VALUATION
Price the same with valuation in 16s compared to the 19s in January. I think smart money is eyeing 18X, which currently targets above 3000. Continued bond strength and yield curve inversion, should that happen, along with other defensive rotations would threaten that view.

26 31 SPX.PNG

TIMING
See this recent review. 

August dates (posted 7/22 Total market view)
8/2 - Stock pullback low
8/6-8 strong - "Seems like setting up for high"
8/17-20 - 8/21 minor high and mild pullback

8/27 (adding)

September dates

9/6
9/13
9/20-21


USA main indexes

Sum
RUT IWM main index leader blasted to new highs and above YR2. SPX made a new high, but testing HR1. NDX also in a resistance cluster of QR1 HR1 then YR2 above. DJI and NYA bringing up the rear, not yet at long term resistance.

So the thing to no is watch the reactions at these levels. Given the trend of the second half, I think SPX will clear HR1. But I am not so sure that NDX will clear YR2 on the first try. This will be an interesting level to watch. I suppose RUT clearing increases the chances that NDX will do so; however, if pros wanted to lighten up on tech this is where it would happen. 

SPX SPY ES
SPX W: Above YR1 for the 4th bar in a row and soon testing HR1. Above that would start to target YR2, 2987.
SPY D: SPY already at HR1; this week had 2 days of pause, one day weak selling and then a confident advance. 
ES D: Last touches of monthly pivots have been near key lows, AugMP and Jul HP MP area. 
SPY 2H: Latest overbought reading briefly sold, but right back higher in a few days. Last time near oversold quickly scooped up - bullish action. 
SPX sum: SPX breaking out to new highs with HR1 and MR1 (AugR1) just above. Confidently moving to level with just a 2 day brief pause and 1 day weak selling before. Watching for reversals this week but so far strength pointing to getting above. This is especially the case if you consider the market from 2018 second half which is trending up quite nicely, compared to the choppy 2 steps forward 2 steps back of most of the first half. 

26 7 SPY D.png
26 8 ES D.png
26 9 SPY D.png

NDX QQQ
NDX W: Heading into HR1 and YR2 just above. This will be an interesting area to watch. 
QQQ D: QR1 cleared, HR1 and YR2 just above. 
NDX sum: Helps the bull case for tech to be getting in gear but still in important resistance cluster of QR1 HR1 and especially YR2. If pros wanted to lighten up on tech this is where it would happen so carefully watching reaction from this area. 

26 10 NDX W.png
26 11 QQQ D.png

DJI DIA
DJI W: Not at long term resistance yet. Weaker up bar may invite selling. 
DIA D: AugR1 a bit higher then HR1 also in play before it reaches the 2018 high. 
DJI sum: More work to do to test long term resistance, and 2018 high seems a bit far at this point. 

RUT IWM
RUT W: Got through YR2 as planned from last week. 
IWM D: Breaking out above a 3 month consolidation. 
RUT sum: Nice looking clear of YR2 so low opportunity cost to hold for higher levels. 

26 15 IWM D.png

NYA
W: Still stuck in range of Feb high and low. 
D: Above QR and recently held HP D200MA combo. 
NYA sum: Recent hold of HP and D200MA added to the bullish picture for markets overall. However, clear that international names are still the weak link. 

Bull bear and what really matters

Lots of hoopla around the "longest bull market ever" this week. But it requires some fuzzy math around the -19% drops that happened in 1997, 1998 and 2011. See this tweet for the details. 

Other usually smart people have made the argument to start counting from the recovery. Um, right. So NDX didn't have a bull market after 2000 until late 2016? What about the ~300+% rally off the 2009 low?

There are plenty of other incidences like this: Nikkei rally from 2012, Shanghai Comp from 2014, EEM from 2016, etc. Plenty of money to made on those three rallies, so saying the bull "doesn't count" because it isn't above a prior high made years or decades ago doesn't work if you are about making money. 

What really matters is whether you should have allocation to an asset class. Let's think about it the other way, when you shouldn't have exposure to an asset class.

Weekly close below YP* (*fractional closes are judgment calls; clear rejection is a better signal)
Weekly close under W50MA
W50MA is falling

Paying attention to these three conditions will get you out of the asset classes that are really in trouble. Here are a few examples this year. 

People who want to do a little more fine turning can include HPs as well.

EWZ clear rejection of YP (and HP), below W50; at the time W50 was probably nearly flat. First long term sell / avoid signal since recovery above YP in 2016. 

GLD first below W50 and HP, and then soon after broke YP and went a lot lower after that. 

26 3 GLD.png

Gold miners GDX have been more significantly bearish for most of the year, and had more damage on the drop.

Remember to use total return technicals on any higher yielding asset. Here's TLT from stockcharts.com, showing a longer term avoid in January, several holds of YS1, and a recent recovery of OK to allocate status (above YP, above 50MA, yet 50MA is still falling somewhat).

Timing notes follow up

This is a follow up to a post from June. I'm going to review the Twitter timing call and the timing dates for July and August that are posted in each Total market view. 

Twitter 6/19/2018: "6/26 - 8/10 momentum trades meaning $IWM and $FAANG should take a hit or be sideways at most; additionally some chance of wildcard haywire event like summer 2011." [Follow up tweet same day] "If I have misjudged the damage potential then here is how it is likely to be off: 7/3H & 7/25-27H."

Follow up 7/24: "My initial read of timing cycle 6/26-8/10 off, but that is also why i listed bullish variation with 7/3H (eh) and 7/25-27H - on track (could be anytime now). Chart comments here and on my site convinced bullish from 7/9+ looking for $SPX 2020-30. Ding!"

OK, one by one:
"6/26-8/10 Momentum trades meaning IWM and FAANG should take a hit or be sideways at most."
Not bad. From 6/25 close to 8/10 IWM about +1.5%, though QQQ (not mentioned in tweet) much better with +5%. From date of tweet 6/19 the sideways call was better. That said, RUT IWM has been stuck under its YR2 2018 high the entire time. On track though for summertime not that notable a call.

"Some chance of wildcard haywire event like summer 2011." 
OK folks this did happen to $FB the first of the FAANGs with a -20% plunge off highs exactly in this window. By 8/10 NFLX also had double digit decline through reached greater than -20% after 8/10. Who else called for potential of -20% swoon in FAANG in June to happen in a specific window? Didn't think so. 

China momentum tech had even worse drop during this period, but I didn't mention in the tweet so FWIW.

"If I have misjudged the damage potential then here it is likely to be off: 7/3H and 7/25-27H."
Just keep in mind that post was 6/19 and yup NDX 7/25 top. Nailed that. All my chart commentary such as Daily comments and Total market views was emphatically bullish after the first week of July when charts made it clear the bullish variation playing out.

Sum
IWM and FAANG take a hit or sideways at most - 5 of 10, IWM just above sideways and 2 big hits in FAANG.
Wildcard haywire event - 9 of 10, not all but FB -20% and NFLX not far behind; China tech also walloped.
If off then 7/3H and 7/25-27H - 9 of 10, 7/3 not a high but 7/25 bang on 5 weeks in advance of the date.
Total score 7.5

Not completely perfect but the FB swoon and NFLX drop is really notable considering the exact call for FAANG wildcard drop within an exact 7 week window. I believe that is the largest single day decline in market cap $ in stock market history - DING!

Now to timing dates - listed in advance in each Total market view.

July dates first posted 6/24/2018 Total market view:
7/4 (then edited to 7/3 on 7/1 TMV)
7/10 (then edited to 7/10-11 on 7/1 TMV)
7/25
7/27 (added in 7/22 TMV with specific call for volatility spike)

7/3 - pullback low across USA indexes including the close low of the 2nd half so far
7/10-11 - mild pullback low across USA indexes
7/25 - DING, NDX high, EEM and many other emerging market bounce highs
7/27 - Vol spike idea correct but VIX bit higher 7/30 +1 still counts as hit in my work (but not +/-2)

August dates posted 7/29/2018 TMV

August dates
8/2
8/6-8 strong
8/17-20

8/2 - stock pullback low (low of month SPY and QQQ), DING
8/6-8 strong - SPY high of month 8/7, DING
8/17-20 TBD, seems like setting up for non event or stock high

Is it any wonder that an open minded hedge fund sought my opinion on markets as a full time dedicated consultant? (Fund sadly closed late 2015 after generating spectacular returns in 2013.) The techniques generating these calls are different than almost everyone else in the industry. I'm an alternative analyst with an eclectic yet surprisingly accurate take on markets as evidenced above and additionally throughout Featured posts. I'm calling the market alongside the best of anyone and doing this very part time to boot. What could I do full time? 

Total market view

REVIEW
8/11/2018 Total market view: "Bottom line - Risk trends are up. Events like Turkey tend to be one day bear wonders. Anyone remember the great Cypress sell-off of 2013? Didn't think so - and yet this was a real headline at the time. Last week SPX had a simple pullback to YR1 & WP support, as well as rising 10 & 20 D MAs. Usually a bounce is the next move. That said, if VIX is above its YP then I'm less sure SPX will test its 2018 high. Given seasonality, there might be more weeks of range-bound congestion before another move higher. If this happens then DJI DIA likely to lead down given DXY strength. Also, as noted above, both biotechs and semi-conductors (XBI and SMH) are a bit weaker, which makes it less likely that NDX QQQ will power up above its YR2."

Result - Instead of a 1 day bear wonder Turkey was 2 days with indexes lower on Monday. China was the larger reason for the decline on Wednesday, when DJI did in fact lead down and then held monthly pivot support. RUT IWM also held its MP, and along with VXX MP rejection, these three led to an index gain into Friday. Tech was notably missing from the party as semi-conductors (SMH) and also biotechs (XBI) have been weaker, both under one or more pivots. Essentially range bound congestion continues, but in the context of larger uptrend for USA main indexes.

SUM
Last week 3 of 5 USA main indexes tested support and held nicely. DJI and RUT held AugPs (MPs), and NYA tested HP along with D200MA. In addition, VXX tested and rejected its MP. The dip was the first oversold reading on 2 hour charts since the start of the 2nd half and it was quickly bought. SPX had a mild break of its YR1 level and immediately came back the next day. 

Typically when multiple USA mains test and hold support along with VIX / VXX confirmation, the next move is up. I still think this is quite likely. 

But it is the second half of August, total volume is understandably low, and there may not be enough juice for a broader advance. More consolidation could easily happen as 2018 leaders NDX and RUT have been paused under resistance for the last several weeks (especially the case on RUT, under its YR2 since June). 

That said, my expectations for USA mains (if not this week then in the next few weeks) are:
SPX to test HR1 2883 at minimum, very likely if YR1 2830 holds.
NDX consolidation may continue, likely HR1 YR2 area test (will be very important to watch).
DJI looking good to play catch up.
RUT expect move above YR2 1701 if not immediately then soon enough.
NYA also playing catch up.

A few items of concern are:
VIX again testing YP 12.29 area - indexes much more likely to power up if VIX breaks that level.
TLT testing long term resistance HP and D200MA - safety trade strength would increase chances of a fail at major resistance (such as SPX HR1 NDX YR2).
VTV / VUG (Vanguard value / growth) ratio perking up - although it has done this many times in the context of a brutal downtrend for most of the decade.

International indexes have of course been weaker - all 8 of the emerging indexes I track were under Q2Ps to begin that quarter, and after subsequent declines 7 of these traded under YP support. Currently only ACWI (broader index like NYA) INDA are above YPs. But weekly charts look to me like a trading low is getting close or already in - and if this idea plays out, USA tech will perk up and indexes will be broadly higher along with a safe haven fade. If KWEB recovers its YP I might be a buyer, but INDA (rec from early July) has been the best emerging international play.

In sum the second half has been bullish for SPX and DJI, a bit less so but still up for NDX and RUT. Despite making some noise, safe havens VIX, VXX, TLT, and metals have been weaker. The larger move is still risk on. 

Oh yes, a note on the metals that I wish I picked up earlier - there were what appeared to be several moves below all pivots on GDX and SLV that went nowhere or squeezed shorts - but when GLD finally joined them below all pivots in July the plunge was on. The idea of coordinated moves works not just on the USA indexes which I devotedly track every day, but also other asset classes. For those thinking buy, it would be helpful to have a coordinated hold of YS1 YS2 levels, although typically it is better to put capital to work on strength not weakness. 

Speaking of coordinated moves, XBI has been under its MP since 7/27, although still holding HP and QP. SMH is below MP, QP, HP and D200MA. KWEB has been crushed with a -25% drop since mid June! Yet NDX QQQ holds firm, still above all medium and long term pivots. Will tech stabilize propelling NDX higher or will sector weakness spread? Not sure but YR2 area in a crowded trade will be something to watch carefully should NDX get there. 

Bottom line - trends are up, but the sideways period in NDX and RUT could easily continue. The current configurations point to higher before a top of significance. Sentiment per put call is fairly bearish, valuation hanging around mid 16s per SPX forward P/E, and even a return to 17X implies a test of SPX 2018 highs at minimum. For this week watching VIX YP, TLT HP and of course weekly pivots for short term moves. Of all the sectors that look ready to propel higher I think IWM and other various small cap growth will make the move. I'm referring to ETFs like VIOG, VIOO, VBK, VTWG here (though time may prevent detailed tracking). These are on the 2018 YTD leaderboard and I think greater potential to continue higher than the more crowded tech. 

Do you see a theme below? Tech and growth leading benchmark SPX by far. Keep in mind NDX quarterly RSI is 90+ and that is why I think small cap growth more potential and less risk from here. 

PIVOTS
USA main indexes - Last week DJI and RUT held MPs. SPX had mild break of YR1 and quickly recovered. Uptrends testing and holding typically lead to more up, especially when confirmed by VIX/VXX.

Sectors of note - Oddly SMH and XBI below MPs, and SMH even under HP and QP. XBI looks ready to bounce. 

Developed - DAX below all pivots, Nikkei below D200MA but will more easily recover.

Emerging - China taking it on the chin this summer. SHComp down -23% from highs and other tech cos like the ones in KWEB plunging more than that in just a few weeks. India Sensex and Nifty look magnificent and reflected in INDA rally, although currency differential making these charts look quite different. 

Safe havens - VIX back to YP. A big bounce from here along with TLT rally above HP will make me more cautious on the market. On the bonds I track - TLT AGG LQD HYG (using total return technicals!) all except high yield are on the verge of giving a long term buy which would be an interesting warning to stocks. I may add TIP to this watchlist as it is already in much better shape than equivalent duration IEF. Metals could bounce, sure. GDX is -21% on the year, with a -17% drop since 7/9. This is more likely if GDX holds YS2, GLD recovers YS1 and SLV recovers HS2 (ie, a coordinated move). However, why put capital to work here when small cap growth is pushing higher in the midst of consolidation in RUT and NDX and range bound SPX and DJI?

Currencies - Bullish DXY was the right idea, as it rallied to QR1 before pulling back. Given the amount of times YP tested from underneath I'm expecting this level to hold at least on first test. 

Commodities - USO broke under HP support along with DXY thrust. CL1 contract has given many good signals in the past and low bang on D200MA so far, so USO could recover soon. Over the weekend I read a PIMCO piece on rotating to more commodities and TIPSs for late cycle investing. I'm intrigued by this although USO has crushed other candidates or broader commodity funds like DBC, DBA (ags), UNG, COMT or COM. Right now all of these are under at least 1 of 3 long term support levels. I'd rather wait for the market to really turn and show leadership - until then riding USA indexes and especially small cap growth as noted above.

Crypto - BTCUSD has tried to rally fro 5-6K area 3 times, not counting the move last week. Each bounce is going lower. 3-4K target although high 4s might do on its Q3S1. A second recovery of BTCUSD QP 7370 would be more constructive.

OTHER TECHNICALS
New lows have crept higher, but new highs stayed mostly firm. New lows dropping back down would likely coincide to a push to highs in indexes. 

19 1 NHNL.png

VALUATION
Dip buyers active in second half so far - maybe SPX in the 16s P/E forward earnings is the reason? A return to 18X tag means 3000+, but also watching 17X currently near 2885. In chart below, red = 20, yellow = 19, orange = 18, green = 17 and light blue = 16. Thick blue is SPX weekly close. 

SENTIMENT
Put-call above the median for 2018, which is understandably much higher than 2017. Not so bullish despite SPX and RUT just a bit under 2018 highs.

19 3 PC.png

August dates (posted 7/22 Total market view)
8/2 - Stock pullback low
8/6-8 strong - "Seems like setting up for high"
8/17-20

8/17-20 setting up for stock high or non event. 

Another dedicated post on timing coming soon. 


USA main indexes

Sum
Bullish action on 4 of 5 USA mains last week:
SPX had mild break of YR1, then recovered
DJI held AugP exact and back above QR1
RUT also held AugP
NYA held HP and then moved back above all pivots

2018 gainers QQQ and IWM having trouble to push through resistance areas, but so far just going sideways. If other indexes are moving up then a rally on at least one of these is more likely. If picking one to get through I'm still think IWM has the better chance.  

Bottom line - path of least resistance is up. Pivot holds on 3 USA mains, DJI RUT NYA, and a major level slight break and recovery on SPX, usually mean indexes are going higher as the next move. But the second half of August may mean that the 2 indexes that have been sideways, NDX RUT, may continue in a congestion pattern. 

SPX SPY ES
SPX W: 10MA held as support and pushing towards highs. Nice uptrend since the start of the 2nd half.
SPX W: 3rd week above YR1, with the last 2 bars holding the level as support. Opens door to HR1 2883 and then potentially YR2 2987.
SPY D: YR1 level had a mild break and fast recovery. 
ES D: Monthly pivot the low of the month so far.
SPY 2H: First RSI oversold since the start of the second half was quickly scooped up, and SPY moved back above the WP. 
SPX Sum: All trends up. YR1 had a mild break and fast recovery. Maintaining above 2830 means SPX should visit HR1 2883 soon, and potentially higher by year end. Second half is moving quite differently from the first half so far with most bars up, and only 2 bars mild down / sideways. 

18 1 SPX W.png
18 2 SPX W.png
18 3 SPY D.png
18 4 ES D.png
18 5 SPY 2H.png

NDX QQQ
NDX W: Congesting under HR1 YR2 combo. 
QQQ D: Resistance cluster YR2 HR1 QR1 so far resistance from 7/24.
NQ D: Actually under D10 and D20, a slight bearish divergence compared to SPX SPY ES.
NDX sum: Uptrend intact, but congesting under the major resistance cluster of YR2 HR1 QR1. 
 

18 8 QQQ D.png
18 9 NQ D.png

DJI DIA
DJI W: 3 of last 4 bars have tagged the weekly band but still pushing up.
DJI W: Above long term support, not near resistance.
DIA D: AugP near exact on the low.
Sum: Low of month oh the August pivot, and a fast move back above QR1. Could see HR1 area  above 26000.

18 10 DJI W.png
18 12 DIA D.png

RUT IWM
RUT W: Stuck under YR2 since mid June. 
IWM D: AugP exact on the low. 
RUT sum: Stuck under YR2 since mid June, but just held AugP on the pullback and heading back up. A bit stronger than QQQ currently as it is also above all MAs.

18 13 RUT W.png
18 14 IWM D.png

NYA
W: Held HP.
D: Nice hold of 2HP, D200MA and back above the AugP the next day. 

18 15 NYA W.png
18 16 NYA D.png

Total market view

REVIEW
8/4/2018 Total market view: "Bottom line the earliest longs on RUT IWM and XBI were out on a profit taking move. Thankfully the next index longs on SPY QQQ then XLF and INDA are doing well. There is really no reason to not be fully long with all 5 USA mains above all pivots; SPY above YR1 is a good risk/reward level for later longs."

8/7/2018 Daily comment: "Sure daily bars look a bit toppy today. Short term charts (2H ETF session only) reached overbought again on all but IWM. Pushing outside daily Bollinger bands is fairly rare, and in August, that is just not likely to maintain."

8/8/2018 Daily comment: It is August so the market may not move too much. I am expecting some give back on this rally we have had from 8/2 open. But with current configurations, I still think this is a minor shuffle before another move higher. Also, VXX is near key support so if I am right about a near term shuffle this is now a good candidate for a hedging trade. The other thing to watch is very oversold gold which via GLD on HS1 and GC Z on YS1 is holding key support.

8/9/2018 Daily comment: "VXX bottomed today on the AugS1. Stock indexes had a minor reversal bar. As long as VIX remains under its YP I will keep to the view that SPX will test its high. That said a pullback to moving averages, and potentially a down week indexes, would be very normal at this stage. ... Minor pullback in stocks should be the next move."

Result - Pullback happened in the context of an uptrend, and VXX worked as a hedge as I nailed the low (and first volatility trade recommendation in months). However, VIX closing above its YP means the next pullback might inflict more damage than originally anticipated. 

SUM
Last week indexes fell back from a near high test on SPX and NDX, as DJI and NYA made new multi month highs. Though a pullback was expected from daily comments as I recommend a volatility hedge via VXX which worked well, I had been expecting SPX to fully test its 2018 high.

That still may yet happen, but VIX back above the YP makes me less sure. Basically, leaders NDX and RUT fell back from important resistance clusters. It is August so let's not read too much into this; in fact a pullback in a range would be more likely than a huge breakout. I tend to think the Turkey selloff will be a one day bear wonder. If this is right idea then VIX will drop back under its YP early next week as SPX holds its YR1 as support. If this plays out the leaders NDX and RUT should try again to make new highs.

However, if VIX remains above its YP perhaps there will be a larger pullback. Should this happen then DJI will likely lead lower among USA indexes.

Tech via NDX has been the 2018 main index leader with RUT in 2nd. But with recent dollar strength along with XBI and SMH weakness, I'm thinking that RUT IWM may resume leadership. If this idea is correct then we'll soon see RUT IWM above YR2. 

I'm in the monitoring phase of other longs recommended early in Q3 - XLF and INDA. XLF needs to hold its HP MP combo; INDA should stay above its D200MA and HP. Although I expect DXY strength to maintain, and therefore not allocating much to international indexes, due to the success of the XLF and INDA YP buys I'm also watching KWEB as it nears its YP.

Bottom line - Risk trends are up. Events like Turkey tend to be one day bear wonders. Anyone remember the great Cypress sell-off of 2013? Didn't think so - and yet this was a real headline at the time. Last week SPX had a simple pullback to YR1 & WP support, as well as rising 10 & 20 D MAs. Usually a bounce is the next move. That said, if VIX is above its YP then I'm less sure SPX will test its 2018 high. Given seasonality, there might be more weeks of range-bound congestion before another move higher. If this happens then DJI DIA likely to lead down given DXY strength. Also, as noted above, both biotechs and semi-conductors (XBI and SMH) are a bit weaker, which makes it less likely that NDX QQQ will power up above its YR2. Therefore, along with DXY strength, I'm thinking that RUT IWM will have the best chance at the next leadership move.

PIVOTS
USA main indexes - SPX holding YR1 as support so far. RUT stuck under YR2 for weeks. NDX resistance cluster YR2 HR1 QR1 not likely to blast through in summer trading. 

Sectors of note - XBI below MP and SMH could be having trouble again at the 2000 top. 

Developed - DAX back down to QP test after clearing above all pivots just 2 days ago. Nikkei comparatively better with a pullback to HP support, but it did break its MP and D200MA.

Emerging - DXY strength causing weakness in emerging market indexes I track. More on this here. It is interesting that currency is the real issue with say Brazil's Bovespa nearly flat for the year but EWZ -19%. Answer is all currency with USDBRL +20% YTD. That said given success of other recent XLF and INDA YP longs, I'm watching KWEB as it nears its YP for a buy.

Safe havens - VIX and VXX bottomed on AugS1s last week. VXX did not move as much as VIX according to pivots. If VIX drops back under its YP then there will be a clear answer - one day bear wonder. TLT popped up above YS1 and QP MP last week as some shorts covered on this crowded trade. Long term indicators are still negative so I'm expecting a move back down. Lastly, how worthless is gold if it cannot rally during a currency crisis? It is trying to hold YS1 area but GDX and SLV have already caved.

Currency - DXY above 95.70 YP looks for good. 

Commodity - Despite DXY strength oil was able to rally back above HP on both USO and CL(U) current contract. Watching this as maybe long, although nothing was triggered last week as USO could not clear its MP.

Crypto - BTCUSD Under all pivots. Rally to 8000+ was rather short lived excitement. For many months thinking 3-4K area, although 5K might do this quarter.

OTHER TECHNICALS
NDX has closed outside its quarterly Bollinger band the last 4 quarters in a row and working on #5. The 90s had a few that were close like this, with 1995-96 run of 7, then 2, then a pullback, then 2, then a pause, then 6, and that was IT. This time its quarterly RSI is above 90. Point here is not time to be complacent especially with 2 second half highs bang on HR1.

VALUATION
Interesting that SPX cannot seem to power through to 17X forward earnings (green line below) again. But this could be a seasonal thing. 

SENTIMENT
Not too toppy last week on the high, and put-call moving rapidly higher. It would be nice to see another move up to higher highs on SPX accompanied by much more bullish sentiment. 

TIMING
This section is quietly at the bottom of every total market view. I don't make a big deal about it. But jeez I've been nailing thins here. 

August dates (posted 7/22 Total market view)
8/2 - Stock pullback low
8/6-8 strong - "Seems like setting up for high"
8/17-20

8/6-8 had SPY price and close high 8/7, QQQ close high 8/8, DIA top 8/7, VXX close low 8/8.

DXY and its impact

Dollar strength made headlines last week. Time prevents me from detailed currency analysis these days, though it was part of the routine when I was at a fund.

Main point - DXY convincingly cleared its YP last week, and I expect that to hold going forward. DXY higher will mean lagging performance in DJI and most foreign stocks priced in US dollars. 

DXY
Q: RSI bottomed near 50, now above all MAs. Point here is that a move to upper band currently 105+ is entirely possible. 
M: At very least we might see upper band test of monthly chart so that would mean test of 100 area. I rather like this scenario. 
W: DXY pushing back above a nicely rising W200MA as well after that acted as resistance since May. OK you could say RSI near overbought but if DXY wants to rally it will ignore this like 2014. 
D: DXY cleared its QP for the 2nd time in April and since then has been pretty strong. It had tested or nearly tagged the YP several times until a big breakout last week. I do not expect this to return under the YP anytime soon. 

11 21 DXY M.png
11 22 DXY W.png
11 23 DXY D.png

DXY vs USA mains
From the start of Q2 as the dollar rally got going, no impact to percentage leaders QQQ and IWM, but seems to have been involved in lower returns of DIA and NYA. SPY in the middle. 

11 24 DXY comp.png

DXY is composed mostly of dollar vs Euro, Yen, British pound and Canadian dollar. But here is a different way of viewing dollar impact on investable foreign stocks.

Nifty vs INDA
Nifty 9.5% on the year vs -2% for INDA and that is coming after a decent rally to start the second half. Nifty has been entirely above its YP all year, found a low on its HP the first trading day of July then launched to rally above YR1. INDA has traded below its YP for a few days and hasn't come close to YR1.

INDA is designed to match the MSCI India Index which is not the same as the Nifty, but the main point here is the currency impact.

11 25 Nifty.png

Here it is another way with USD vs INR +9% for the year so far. 

Hang Seng
For some reason Hang Seng vs FXI doesn't have the same dramatic difference.

11 26 Hang Seng.png

But a huge difference on Micex index (Russia) futures vs RSX.

But even this wasn't as terrible as Bovespa vs EWZ, with Bovespa just about flat for the year with EWZ down near -19%.

11 28 Bovespa.png

Sure enough USD vs BRL +20% on the year so far. 

11 29 USDBRL.png

USA main indexes

Sum
2018 leaders NDX and RUT approached key resistance clusters and fell back. NDX had near tag of HR1, which is part of a larger YR2 HR1 QR1 cluster; and RUT has been stuck under YR2 since June.

SPX had cleared its YR1 for the 2nd time in early August, and so far the pullback found support at this level.

Laggards DJI and NYA are weaker across the board, with more trouble at quarterly and weekly Bollinger bands. 

Bottom line - to me SPX looks like normal pullback to support, so I'm expecting a bounce as the next move. If so then leaders NDX and RUT may try again at their resistance clusters. At this point I think RUT has a greater chance of clearing its YR2 than NDX. If weakness continues into next week then DJI will likely be the hedging short index vehicle of choice.

SPX SPY ES
SPX W: 2nd week above YR1 at 2830, and as long as that maintains HR1 test remains the target.
SPY D: A few too many trading tops not on pivot resistance this year since April - a bit annoying. 
ES D: Just a normal pullback to rising 10 and 20MAs, with the YR1 level also holding as support. This has been on a clear buy since 7/6 above all pivots and MAs.
SPY 2H: From RSI OB down to weekly support. Looks normal and next move typically bounce.
SPX sum: While I do wonder how long SPX will power up outside the quarterly Bollinger, so far trend gets benefit of the doubt with a normal pullback to support on pivots (YR1), moving averages (10 & 20 daily MAs), and short term support on the weekly pivot (different next week but still, so far near the low). 

11 5 SPY D.png
11 6 ES D.png
11 7 SPY 2H.png

NDX QQQ
NDX W: Looks more toppy with near test of HR1 and sharp drop from that high. Also note: NDX quarterly chart (not shown) RSI 90+ and has closed outside its BB 4 quarters in a row, now working on #5.
QQQ D: Doesn't look too bad, just some shuffle off highs. I do think this QR1 HR1 YR2 area will not breakout so easily though. Note the action in the first half from these levels. 
ND Q: Still above all pivots and MAs. If lower then D50 along with AugP is support. 
NDX sum: Everyone knows NDX has been the leader of the bull market. Even just tracking NDX over SPX has generated substantial outperformance for most of the decade. But quartelry RSI is 90+ and when these things end it may not be gradual. Currently the index has tested a resistance cluster of YR2 HR1 QR1 twice and so far not getting through. I don't think the index will be powering up through these levels in August so easily. 

11 8 NDX W.png
11 9 QQQ D.png
11 10 NQ D.png

DJI DIA
DJI Q: Pushing the band but last quarter and this one so far more difficulty to trade above (as SPX and especially NDX are doing without any issues).
DJI M: Down for the month so far. 
DJI W: Trouble at the weekly BB 2 of the last 3 weeks. 
DJI W: Above 2HP, but not near any long term resistance. 
DIA D: Shuffle at QR1 with 3 tries above and 3 breaks. 
DJI sum: Having trouble at quarterly and weekly BBs and lagging SPX and NDX. Given DXY and international issues, this is likely to continue. 

11 11 DJI Q.png
11 12 DJI M.png
11 13 DJI W.png
11 14 DJI W.png
11 15 DIA D.png

RUT IWM
RUT W: Stuck under YR2 since 6/11 bar. One could also say 2 decent selling attempts and itis back to the level for the 5th or so time. With DXY strength this is poised to resume leadership which implies clearing this level.
IWM D: Above Aug P, but this chart shows how clearly YR2 has acted as resistance. The move from 4/2 low to 5/1-3 higher lows then move to YR2 is a thing of beauty to my eyes. 
RUT sum: Stuck under YR2 since June, but back near highs. I don't know if it will get above but given macro situation I think more chance of RUT clearing YR2 than NDX as this point. 

11 16 IWM D.png

NYA
NYA W: Looks more like DJI.
NYA W: Above 2HP, but probably will be first to break if weakness continues. 
NYA D: Still above AugP though it too back under QR1.

11 17 NYA W.png
11 18 NYA W.png
11 19 NYA D.png

Total market view

REVIEW
7/29/2018 Total market view: "Bottom line - Buying into the rally from early Q3 has done moderately well. It turned out the better gains came on the setups after the first IWM & XBI longs - SPY, QQQ, then XLF and INDA. With former leaders now leading down, and former laggards turning into leaders, there is no simple index hedge (though you can always hedge a QQQ long with the same short). That means taking profits, or at least not letting gains turn into losses, was the right move. If DIA and NYA were leading down and VIX moved more to upside last week, I'd be thinking about a major turn. But with markets making more of a rotation move, I will think at some point soon there will be another attempt to move broadly higher."

Result - Pullback continued Monday and early Thursday, and then most indexes went back up.

SUM
All 5 USA main indexes are above all pivots. AugPs had test or near test on SPX, NDX, DJI, RUT and NYA and this was bought very aggressively. 3 indexes, SPX, DJI and NYA cleared resistance levels (YR1 and two QR1s). All this is very bullish.

Similarly, VIX tested its AugP and rejected it. Friday closed decently under its YP - actually rare this year for VIX to move below all pivots. VIX pivot rejections tend to be risk-on for stocks not just one day but several days ahead. VXX also below all pivots and not near any major support.

Simply stated path of least resistance is higher for indexes, and for now we can watch SPX YR1 to hold as support and VIX YP to hold as resistance. Should these continue it will be likely to see SPX test its 2018 high.

Interestingly, though RUT IWM was the clear leader early in Q2, first to reclaim status of above all pivots, which was a great tell for a 2 month rally, it is not the same in Q3. So far YR2 has stopped the rally three times and if there is any weakness next week it will likely be the first USA main to move again below its AugP.

Similarly, 2018 performance leader XBI started Q3 strong, actually the first leading above all pivots, but has faded quite a bit. Friday closed under its AugP and below YR1 with look of rejection.

This is happening as two of the FAANG stocks, FB and NFLX are also having trouble. But instead of the momentum leaders dragging everything down it seems rotation is the more likely move. NYA is perking up, meaning renewed buying for some international names, and value ETFs also were popping at the end of last week. I like the idea of a rotation into value as growth has far outperformed for so long. 

Bonds are a crowded short but TLT below all pivots and I'm not keen to allocate here with indexes looking so strong.

Metals are also extended on downside and may have reached exhaustion on GLD HS1, GDX YS1 and SLV YS1. Above a WP could trigger a speculative long. 

Bottom line the earliest longs on RUT IWM and XBI were out on a profit taking move. Thankfully the next index longs on SPY QQQ then XLF and INDA are doing well. There is really no reason to not be fully long with all 5 USA mains above all pivots; SPY above YR1 is a good risk/reward level for later longs. I also like the value theme as above, and may try a GLD position and play for a quick pop or more. Lastly I will be watching USO as potential long candidate if above all pivots. If I want to increase reduce long exposure then first choices likely IWM & XBI shorts, and potentially a TLT long if it stays above its YS1.

PIVOTS
USA main indexes - Better if RUT IWM can hold its AugP. If not that is a good r/r (risk reward) on short side.

Sectors of note - XBI turning around in 2H, from performance leader up nearly 20% YTD to be the first to technically break down, below AugP and YR1 rejection last week. XLF seems like it has the most potential though XLE could also get in gear if USO moves back above all pivots.

Developed - Lagging, thought N225 is above all pivots. Currency impact makes these less optimal choices.

Emerging - China looking terrible both on Shanghai Comp, Hang Seng, FXI and KWEB. Sensex / INDA has picked up and have to say thinking that institutions would overweight India to escape China drama was a great call, with INDA turning into the best % gainer in 2H so far. 

Safe havens - VIX under all pivots is bullish for stocks. TLT YS1 worth watching, but I suspect bonds will move lower so not inclined to make any counter-trend plays here. GLD fully oversold on W chart with RSI divergence, and on long term support across the metals - GLD HS1, GDX YS1 and GDX YS1. This is a place were a bounce becomes more likely. If not here, then I'll be watching GLD YS1.

Currencies - DXY high 95 area and YP has been resistance for a long time, but it is back there again. 

Cryptos - ETH and LTC look pretty bad, and BTC is fading back under all pivots as I type. Perhaps that 3-4K target is on track after all. 4800 is the first major support for Q3. 

OTHER TECHNICALS
New highs & new lows indicator did a great job of remaining committed to the bull side both in early May and early July. That said there was some chop earlier this year. Current posture new lows rising from 7/17, but new highs still strong. 
 

4 13 NHNL.png

VALUATION
If SPX reaches 18X forward earnings again, that will be over 3000. For this to happen it needs to get into the 17Xs, which has been near resistance since March of this year. 

4 14 SPX.PNG

SENTIMENT
Not too bullish here despite the proximity to highs. Put call and Equity only put call currencly not near January and June extremes. 

TIMING
7/3 - Stock index pullback low
7/10-11 - Actually looks like pullback low on 7/11
7/25 - "Pulling for a stock high" DING
7/27 (adding) - "Looks like volatility spike" DING

August dates (posted 7/22 Total market view)
8/2 - Stock pullback low
8/6-8 strong - Seems like setting up for high
8/17-20